
Performance Analysis and Failure Mitigation Strategies for
a Resilient Dynamic Evacuation Guidance System
Akira Tsurushima
a
Intelligent Systems Laboratory, SECOM CO., LTD., Japan
Keywords:
Distributed Problem Solving, Multi-Agent Simulation, System Failure Analysis.
Abstract:
Resilience is a critical factor in dynamic evacuation guidance systems, which must remain functional in harsh
environments. However, most evacuation studies have seldom addressed system resilience. This study pro-
poses a distributed dynamic evacuation guidance system that sustains functionality even when some compo-
nents are damaged during evacuation, thereby enhancing the overall reliability and redundancy of the system
by avoiding single points of failure. We evaluated the system performance through asynchronous multi-agent
simulations to assess its effectiveness in maintaining guidance during a spreading fire that compromised its
components. The experiments revealed that the proposed system with failed components performed compara-
bly to a fully operational system when failures occurred in response to the fire severity. The adverse effects of
random component failure were mitigated using two strategies: spatial interpolation and persistent guidance,
resulting in a performance comparable to that of a failure-free system.
1 INTRODUCTION
Disaster evacuation occurs in harsh environments
where most computer systems are prone to failure.
Ensuring system resilience is crucial for evacuation
support systems because advanced functions become
ineffective if the system ceases to operate. Numerous
studies have explored dynamic evacuation guidance
systems that assist people in exiting buildings during
disasters (Galea et al., 2014; Galea et al., 2017; Lin
et al., 2017). These systems use sensors and signage
to alter evacuation routes and display directions based
on the sensor data. However, many of these studies
assume perfect system functionality in harsh environ-
ments and often overlook the importance of system
resilience. In this study, resilience is based on the
concept that a system can maintain its overall func-
tionality, even if some agents are lost.
Distributed systems, in which independent au-
tonomous agents communicate through peer-to-peer
networks, offer promising solutions for enhancing re-
silience. Unlike centralized systems with a single
point of failure, distributed systems maintain their
functionality even if agents fail or communication is
interrupted. The independence of the agents allows
the remaining network to continue functioning and
a
https://orcid.org/0000-0003-2711-297X
to coordinate to solve problems. However, the lo-
calized information associated with each agent, com-
munication uncertainties, and coordination complex-
ities present challenges. Whether such systems can
achieve acceptable evacuation guidance performance
remains uncertain, particularly when agents lose their
functionality.
In this study, we used a dynamic evacuation
guidance system incorporating the distributed Broad-
cast and UpdateSign algorithms proposed by (Tsu-
rushima, 2024b) to conduct evacuation simulations
under fire conditions with system components mal-
functioning because of disasters. Two failure scenar-
ios were investigated: component failure according to
fire severity and random component failure. In the
former scenario, the system with failed components
performed nearly as well as the fully operational sys-
tem, whereas in the latter scenario, the performance
was inferior. To mitigate the adverse effects of system
failures, two strategies have been proposed: imputing
missing data from failed components using spatial in-
terpolation and employing persistent guidance, where
failed components continue to display the last guid-
ance direction before malfunctioning. Both strategies
demonstrated positive results in terms of reducing the
adverse effects of system failures on evacuation guid-
ance. The effects of time delays and drifts on the per-
formance of the distributed system were also studied.
Tsurushima, A.
Performance Analysis and Failure Mitigation Strategies for a Resilient Dynamic Evacuation Guidance System.
DOI: 10.5220/0013234400003890
In Proceedings of the 17th International Conference on Agents and Artificial Intelligence (ICAART 2025) - Volume 1, pages 497-506
ISBN: 978-989-758-737-5; ISSN: 2184-433X
Copyright © 2025 by Paper published under CC license (CC BY-NC-ND 4.0)
497

The remainder of this paper is organized as fol-
lows. Section 2 reviews related work, and Section 3
outlines the problems discussed in this paper. The dis-
tributed algorithms employed in this method are de-
tailed in Section 4, and Section 5 describes the asyn-
chronous simulation framework. Section 6 discusses
the experiments and results of the failure simulations.
Finally, the discussion and conclusions are presented
in the subsequent sections.
2 RELATED WORK
Numerous studies have investigated public safety,
crowd dynamics, and evacuation processes (Haghani,
2020a; Haghani, 2020b). Various crowd models
have been proposed (Helbing et al., 2000; Lovreglio
et al., 2016) to demonstrate the effectiveness of mul-
tiagent simulations in evacuation studies. Research
on dynamic evacuation guidance using signage sys-
tems has garnered significant attention (Galea et al.,
2014; Galea et al., 2017), followed by studies employ-
ing multiagent simulation models (Lin et al., 2017).
Technologies that aim to enhance the efficiency of
dynamic evacuation guidance include shortest-path
finding using the Dijkstra algorithm (Baidal et al.,
2020), and the Bellman–Ford algorithm (Zu and Dai,
2017). To reduce computational costs, a decom-
posed approach that divides the original problem into
subproblems was investigated (Lujak et al., 2017;
Nguyen et al., 2022). Systems that use smartphones
or PDA devices for evacuation guidance have also
been explored (Lujak et al., 2017; Zu and Dai, 2017;
Kawahara et al., 2023; Zhao et al., 2017); however,
these distributed approaches do not address system
resilience. Distributed systems are a promising ap-
proach for solving optimization problems (Rust et al.,
2020). Zhao et al. were the first to discuss distributed
approaches to system resilience in evacuation guid-
ance systems (Zhao et al., 2022). However, their work
lacked technical details and did not analyze the sys-
tem failures during evacuation.
To the best of our knowledge, this is the first study
to perform dynamic evacuation guidance simulations
that incorporate component failure during guidance
and to analyze its impact on system performance.
3 PROBLEM
3.1 Environment
Let t = 0, ...,T
max
denote simulation time. An ex-
ample of a fire-spread evacuation simulation within
a central core floor (Tsurushima, 2024a) is shown
in Fig. 1(a). The floor comprises cells (x,y) where
−40 ≤ x ≤ 40 and −25 ≤ y ≤ 25. Two exits, la-
beled 23 and 24 (blue), are located in the central core
(dark gray square region), along with the aisles and
corners (labeled 11–22 in black). The doors connect-
ing the aisles to the surrounding area (light brown
region) are marked in yellow and numbered 1–10
in black, allowing evacuees to move from the sur-
rounding spaces to the aisles and eventually to an
exit. The surrounding space and aisles in the cen-
tral core are divided into 38 spaces C
1
,... ,C
38
(indi-
cated by the red numbers in (A)). These spaces corre-
spond to the edges of the universal evacuation graph
(Fig. 1(B)). Note that the red numbers 19–26 repre-
sent the small spaces occupied by doors. Each space
C
i
has representative coordinates x(C
i
),y(C
i
), and the
distance between the two spaces C
i
and C
j
is defined
as d
i j
=
p
(x(C
i
) − x(C
j
))
2
+ (y(C
i
) − y(C
j
))
2
. The
black cells at the top right of the surrounding space
indicate the area occupied by fire, and the light-gray
cells around the black cells indicate that they were
filled with smoke. Fire in the environment was simu-
lated using a simple but reasonable fire-spread model
(Tsurushima, 2024a). The fire hazard level of cell
(x,y) at time t is represented by: h
t
(x,y)
∈ R, which
propagates to the neighboring cells. ζ(x,y) with prob-
ability p
1
by
h
t
(x,y)
= (1 − p
2
)h
t−1
(x,y)
+ p
2
max{h
t
( ˙x, ˙y)∈ζ(x,y)
}, (1)
where p
2
is the ratio of these two terms. We as-
sumed that p
1
= 0.07 and p
2
= 0.2. In (A), cells with
h
(x,y)
≥ 100 are shown in black, and 100 > h
(x,y)
≥ 0
are shown in gray to white, depending on the value. A
cell (x,y) was randomly selected from the surround-
ing space, and h
0
(x,y)
was set to 10
5
at time t = 0.
3.2 Evacuation Agent
At time t = 0, 800 evacuation agents A
0
=
{a
1
,... , a
800
} were randomly distributed in the sur-
rounding space. When the simulation began, each
agent attempted to exit the surrounding space through
the doors, aisles, and exits. If agents behaved in-
telligently, this would overshadow the true effective-
ness of the system. Therefore, unlike humans, evac-
uation agents lack intelligence and cannot indepen-
dently avoid hazards. They operate based on a sim-
ple decision model that allows random selection in
decision-making situations. The only decision rule
that evacuation agents follow, aside from making ran-
dom choices, is to adhere to the guidance provided by
a signage agent; however, this is contingent on the sig-
nage agent being within their field of view. The agents
ICAART 2025 - 17th International Conference on Agents and Artificial Intelligence
498

(A) (B) (C)
Figure 1: (A) Simulation screen, (B) Universal evacuation graph, (C) Evacuation graph.
choose doors if they are located in the surrounding
space and corners, or exits if they are in the central
core.
The hazard contamination of an evacuation agent
a is denoted by θ
a
if the agent is exposed to cells with
h > 0. This value accumulates over the simulation
period according to θ
a
=
∑
T
max
t=0
min{100,h
t
}, where
T
max
is the time at which all evacuation agents com-
plete the evacuation or when (h
(x(v
23
),y(v
23
))
> 100) ∧
(h
(x(v
24
),y(v
24
))
> 100). Here, x(v) and y(v) denote the
x- and y-coordinates of node v, indicating an incom-
plete evacuation when these conditions are met.
3.3 Signage Agent
Signage agents directing evacuation agents to evac-
uation routes are indicated by green arrowheads lo-
cated at doors or corners, as shown in Fig. 1 (A).
They are positioned either on doors (1–10), corners
(11–22), or (23, 24). Figure 1(B) shows universal
evacuation graph G = (V,E,W), a graphical represen-
tation in (A) (Tsurushima, 2024b). Nodes (v
i
∈ V )
represent signage agents at doors (v
1
,... , v
10
), cor-
ners (v
11
,... , v
22
), or exits (V
g
= {v
23
,v
24
}); the edges
((v
i
,v
j
) = e
k
∈ E) represent possible evacuation guid-
ance directions at each location. Furthermore, w
k
∈
W,w
k
∈ R denote the associated edge weights on
e
k
, representing fire severity in C
k
, which is critical
for determining a safe evacuation route. A univer-
sal evacuation graph can be considered as a represen-
tation of an evacuation guidance system, where the
nodes represent signage agents, and directed edges
(i, j) represent possible guidance directions for node
i (∆ : V → 2
V
, j ∈ ∆(i),(i, j) ∈ E) at their correspond-
ing locations. The edges also represent the system
connections of the signage agents, where the signage
agents communicate with each other through these
edges. The black nodes indicate faulty components
and the blue edges indicate failures caused by fire.
Thus, Node 6 is faulty and unable to communicate
with adjacent Nodes 5, 7, or 15; ϕ : V ∪E → {0,1} in-
dicates whether the nodes or edges function ϕ(v) = 1
if signage agent v functions and ϕ(v) = 0 otherwise.
We assume ϕ({i, j}) = 0 if either ϕ(i) = 0 or ϕ( j) = 0
is true.
Figure 1(C) shows
˙
G = (V,
˙
E,
˙
W ) (Tsurushima,
2024b) where
˙
E ⊂ E,
˙
W ⊂ W represents the evacu-
ation routes suggested by the signage agents. Each
edge indicates the suggested direction δ(i) (δ : V →
V, j ∈ ∆(i), (i, j) ∈
˙
E) that a signage agent i dis-
plays for evacuees to follow for safe evacuation at
the corresponding location. Here, ∆(i) denotes the
adjacent nodes of i and Ω(i) represents the neigh-
boring edges. For instance, ∆(1) = {2,10, 11} and
Ω(1) = {1, 27,36}. If a node’s signage agent fails, it
ceases to indicate the evacuation direction, resulting
in random behavior by evacuation agents.
Evacuation guidance performance was evaluated
based on the total evacuation time (T
max
) and mean
hazard contamination (
¯
θ). The decision making of
a signage agent follows two distributed algorithms:
Broadcast and UpdateSign , which are detailed in the
next section.
4 ALGORITHM
We employed the distributed broadcast and Update-
Sign algorithms proposed in (Tsurushima, 2024b;
Tsurushima, 2024a) to solve the dynamic evacua-
tion guidance problem presented in the previous sec-
tion. To ensure the asynchronous execution of sig-
nage agents within the simulation, these algorithms
were adapted to use a message-passing system (lines
10 and 11 in Algorithms 1 and 2, respectively) in-
stead of the function calls in their original versions.
Furthermore, a data imputation mechanism was intro-
duced in Algorithm 2 (lines 3–5) to enhance the re-
Performance Analysis and Failure Mitigation Strategies for a Resilient Dynamic Evacuation Guidance System
499

Algorithm 1: Broadcast at node i.
Local variable:
b
˙
E,
c
W
C
,
b
T
1 Procedure
Broadcast(m
b
= ⟨o, j, t , L (o)⟩):
2 ⟨δ(o), Ω(o), ϒ
C
(o)⟩ = L (o);
3 if ϕ(i) = 1 &
b
T [o] < t then
4
b
T [o] ← t;
5
b
˙
E[o] ← δ(o);
6 foreach k ∈ 1, ..., |Ω(o)| do
7
c
W
C
[Ω(o)[k]] ← ϒ
C
(o)[k];
8 end
9 foreach a ∈ ∆(i) \ { j} do
10 send m
b
= ⟨o, i,t,L (o)⟩ to node a;
11 end
12 end
13 end
Algorithm 2: UpdateSign at node i.
Local variable:
b
˙
E,
c
W
C
,δ(i),
b
T
1 Procedure UpdateSign:
2 if ϕ(i) = 1 then
3 if Failure node found in
b
T then
4
b
W
C
← SpatialInterpolation;
5 end
6 l
∗
ig
← Search(i,
b
˙
E,
b
W
C
) ;
7 (i, next) ← l
∗
ig
[1];
8
b
˙
E[i] ← (i, next);
9 δ(i) ←
b
˙
E[i];
10 if
b
˙
E include a cycle then
11 send message m
u
to node next;
12 end
13 end
14 end
silience of the guidance system. The nodes in Fig. 1
(B) represent signage agents that function as compu-
tational processes capable of executing both Broad-
cast and UpdateSign . To provide efficient evacuation
guidance, both algorithms were executed in two ways:
1. at regular intervals at each node, or 2. triggered by
messages from the other nodes.
The Broadcast procedure, which is a simple flood-
ing algorithm that distributes the local information
of a node throughout graph G, is presented in Algo-
rithm 1. In this procedure, o is the initiator node of the
Broadcast , j is the message-sending node activating
this procedure, t is the time of initiation of o, and L (o)
is the local information of o, which is distributed to
the other nodes; that is, L (o) = ⟨δ(o), Ω(o), ϒ
C
(o)⟩,
where δ(o) denotes the guidance direction of o, Ω(o)
the neighboring edges of o, and ϒ
C
(o) the edge weight
w
C
associated with Ω(o).
The weights w
C
i
used to derive efficient evacuation
guidance were calculated as follows:
w
C
i
(t) = α(t)l
ξ
(w
B
i
(t)) + (1 − α(t))w
A
i
(t), (2)
where l
ξ
=
x if x ≥ ξ
0 otherwise,
and α(t) = β α(t − 1).
Here, w
A
i
and w
B
i
are defined as
w
A
i
=
1
|C
i
|
2
∑
(x,y)∈C
i
h
t
(x,y)
, (3)
and
w
B
i
= w
A
i
(t) + γ max{ζ(e
i
)/|C
i
|}, (4)
where ζ : E → 2
W
C
(t−1)
, which refers to previous
weights of the neighboring edges of e
i
, and γ denote
the scaling factor.
Each node i has its own local variables:
b
˙
E,
b
W
C
,
b
T ,
and δ(i). where |
b
˙
E| = |
b
T |, and
b
W
C
= {w
C
1
,... , w
C
38
}.
These variables were used to manage local informa-
tion during evacuation guidance.
b
T records the initia-
tion time of each node.
The broadcast procedure is triggered when a mes-
sage m
b
= ⟨o, j,t,L (o)⟩ is received or when it is initi-
ated by sending m
b
= ⟨i,i,t,L(i)⟩ to itself after a spec-
ified interval. Each time m
b
is initiated, the previous
weights
b
W
C
are stored in the local memory to calcu-
late w
B
i
in Equation 4. To initiate m
b
, ϒ
C
is calculated
using the node i’s sensors and previous weights, as
shown in Equations 2–4.
UpdateSign is presented in Algorithm 2. Update-
Sign searches for the minimum weight path to one
of the exits, based on the local information provided
by Broadcast , using a breadth-first search (line 6).
This process determines the guidance direction δ(i).
If a cycle is found on the path to the exit, Update-
Sign sends a message m
u
to the next node to break the
cycle.
When a node receives message m
u
, the Update-
Sign procedure is executed. Node i also initi-
ates message m
u
after a certain delay to begin the
UpdateSign process. The parameters were op-
timized using multi-objective black-box optimiza-
tion (Tsurushima, 2024a), yielding estimates α(0) =
0.223, β = 0.024, ξ = 1.26e-5, and γ = 0.020.
ICAART 2025 - 17th International Conference on Agents and Artificial Intelligence
500

Figure 2: Message delivery of the Broadcast procedure be-
tween nodes initiated by node 1. The x-axis represents the
simulation time, and the y-axis indicates the node IDs in-
volved in the communication process.
5 ASYNCHRONOUS
SIMULATION
By incorporating the Broadcast and UpdateSign algo-
rithms, the nodes in the graph communicate through
edges representing the communication channels, as
shown in Fig. 1 (B).
These algorithms are structured to operate asyn-
chronously, accommodating potential malfunctions
of nodes (signage agents) or communication edges. In
asynchronous systems, there is no unified global time
for synchronizing node operations. Message trans-
fer can experience delays of unknown duration, and
the execution interval of each procedure may vary un-
predictably with no guaranteed upper execution time
limit. To model these conditions, we assume the
following speed hierarchy for the system processes:
s
p
,s
c
,s
w
, and s
f
, which represent the speeds of the in-
ternal process execution, inter-node communication,
evacuee movement, and fire spread, respectively. The
relationship s
p
≻ s
c
≻ s
w
≻ s
f
indicates that each pro-
cess is faster than the one that succeed.
In UpdateSign , the update of the guiding direction
δ(i) precedes the dispatching of cycle-breaking mes-
sages 11 in Algorithm 2). Considering s
p
≻ s
c
≻ s
w
,
this is reasonable because breaking the cycle on the
evacuation routes can be achieved more quickly than
when the evacuees reach the next signage agents.
For the integrated simulation model, fire-spread,
evacuation agent, and evacuation guidance system
models were developed (Tsurushima, 2024a) to inves-
tigate effective control mechanisms for the problems
stated in Section 3. The model was implemented us-
ing the multiagent simulation platform NetLogo 6.0.2
(Wilensky, 1999), which does not provide an asyn-
chronously distributed simulation mechanism. We
developed a message-passing framework that emu-
lates an asynchronous distributed simulation, in ad-
dition to NetLogo 6.0.2.
Let I
∗
b
and I
∗
u
be the intervals between the ini-
tiation of Broadcast and UpdateSign , respectively.
They are initiated with intervals of I
b
= I
∗
b
+ ε
b
and
I
u
= I
∗
u
+ε
u
owing to drifts. Additionally, let z = ε
z
de-
note the delay for a message sent between two nodes.
Random variables ε
b
∼ U(0, ε
∗
b
), ε
u
∼ U(0, ε
∗
u
), and
ε
z
∼ U(0, ε
∗
z
) are introduced to emulate the drifts for
each interval. Consequently, Broadcast and Update-
Sign occur after I
b
and I
u
time units from previous
executions. The destination node receives messages z
time units after they are sent.
An agenda queue Q is introduced to schedule the
messages sent by Broadcast and UpdateSign in lines
10 and 11 of Algorithms 1 and 2. Both types of mes-
sages are posted to Q along with the execution times-
tamp τ = t + z, where t denotes the current time if it
is an initiation, or the timestamp of the previous mes-
sage if it is a message reception. The messages are
sorted by τ in Q, and messages with τ earlier than the
current time are selected from the top and sequentially
executed. Notably, the execution of a message can
generate other messages stored in Q that are sched-
uled for execution.
Figure 2 illustrates how Broadcast messages are
delivered between nodes when the first two messages
are sent by Node 1, assuming I
∗
b
= 5, ε
∗
b
= 3 and ε
∗
z
=
2. The arrow represents messages originating from
the root node to the target nodes, with 2|E| − |V | + 1
messages sent per broadcast. The second message
was sent by Node 1 before the first message was re-
ceived by the other nodes. In this study, the process-
ing times for both Broadcast and UpdateSign within a
process are assumed to be negligible, with I
∗
b
= 5 and
I
∗
u
= 10.
5.1 Analysis
Distributed dynamic evacuation guidance is provided
by UpdateSign running on individual signs. The per-
formance of UpdateSign depends on the information
provided by the Broadcast . Evacuation guidance is
effective when all the local information
b
G provided
by Broadcast is consistent for each sign. Ensuring
consistency in the local information on every sign is
crucial.
Let
b
˙
E
i
and
b
W
C
i
denote the local information vec-
tors for the evacuation routes and edge weights at sig-
nage agent i;
b
˙
E
i
[k] and
b
W
C
i
[k] represent the k th el-
ement of vectors
b
˙
E
i
and
b
W
C
i
, respectively. Consider
the cosine similarity between
b
˙
E
i
and
b
˙
E
j
, denoted by
Performance Analysis and Failure Mitigation Strategies for a Resilient Dynamic Evacuation Guidance System
501
(A) (B) (C)
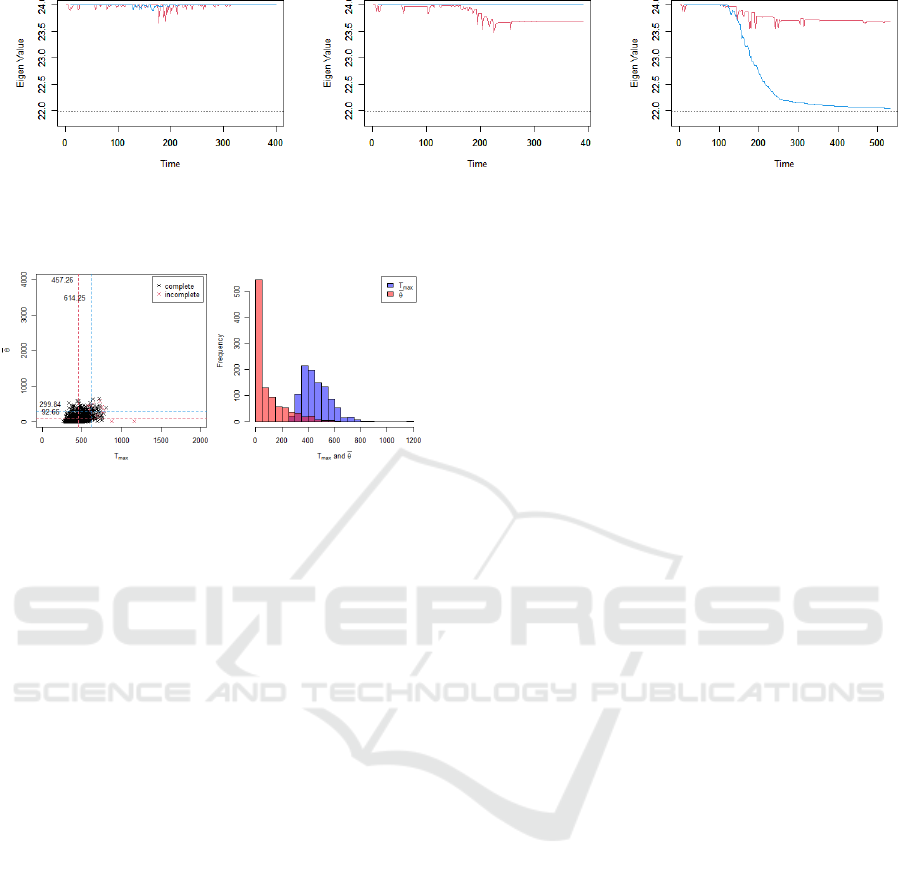
Figure 3: Temporal change in the maximum eigenvalue of the similarity matrix of local images with no failure (A), Scenario
1 (B), and Scenario 2 (C).
Figure 4: Baseline with ε
∗
b
= 3, ε
∗
u
= 3, and ε
∗
z
= 2.
r
E
i j
, and between
b
W
C
i
and
b
W
C
j
, denoted as r
W
i j
. We have
|N|×|N| similarity matrices R
E
for r
E
i j
and R
W
for r
W
i j
.
Subsequently, the maximum eigenvalues λ
E
and λ
W
are obtained for R
E
, R
W
, Specifically, λ
E
= 24 when
all
b
˙
E
i
s are identical, and the same is true for λ
W
be-
cause r
i j
= 1 if the vectors i j are identical. The min-
imum value of λ
E
is unknown because
b
˙
E can only as-
sume certain values. For example,
b
˙
E[1] ∈ {2,10,11},
As a baseline, the minimum value of λ
E
was esti-
mated to be 21.98 in 1000 Monte Carlo simulations
for randomly generated vectors
b
˙
E.
Assuming that all components of the system are
functional throughout the simulation, the temporal
evolutions of λ
E
and λ
W
are presented in red and blue,
respectively, in Fig. 3 (A), indicating that both values
were approximately 24 during the simulation.
6 EXPERIMENT AND RESULT
Assuming that all system components function as ex-
pected during fire-spread evacuations, 1000 evacua-
tion guidance simulations were performed as a base-
line for the analysis. The left-hand sides of Fig.
4 presents the results, where the x-axis represents
T
max
and the y-axis represents
¯
θ. Black × denotes
complete evacuation, implying that all evacuees fled,
whereas red × denotes incomplete evacuation, signi-
fying that the fire occupied both exits before all evac-
uees escaped. The red dashed lines indicate the mean,
and the blue dashed lines represent AVaR
0.2
, which
denotes the mean of the worst 20 % of the samples
(Tsurushima, 2024a). In this analysis, ε
∗
b
= 3, ε
∗
u
= 3,
and ε
∗
z
= 2 were assumed. A summary is presented
in row A of Table 2. The right-hand chart in the fig-
ure shows the histograms of T
max
and
¯
θ; the former
is illustrated in blue, and the latter in red. The non-
Gaussian nature of the distributions, particularly
¯
θ,
complicates the analysis.
The effects of system failure on the evacuation
performance of the distributed dynamic evacuation
guidance system were evaluated through simulations
covering two random scenarios: system component
failure according to fire severity (Scenario 1) and ran-
dom failure (Scenario 2).
Scenario 1 In this scenario, the signage agents of the
evacuation guidance system fail based on the fire haz-
ard levels (h
t
(x,y)
) of the cells in which they were in-
stalled. The failure probability of i is h
t
(x,y)
×10
−2
and
changes ϕ(v
i
) = 1 to zero. Edge {i, j} fails based on i
or j. In this scenario, the system attempts to move the
evacuees away from the fire where the signage agents
are most likely to fail. If the system works well, sig-
nage agent failures will have little effect on evacua-
tion performance, because evacuees will have left the
area in which signage agents are likely to fail. In ad-
dition, the evacuation guidance system is expected to
be adversely affected by process-time drift and com-
munication delays inherent in asynchronous systems.
Therefore, the effects of system failures and delays on
evacuation guidance performance should be assessed.
Figure 3 (B) shows the temporal evolution of λ
E
and λ
W
in Scenario 1. Compared to Fig. 3 (A), λ
E
decreases but remains at approximately 23.5, which
is still above the baseline of 21.98. This suggests that
the variance among the local images in the signage
agents may not be substantial.
Scenario 2 In real buildings, variations in the aisle and
connection patterns between signage agents can lead
to random failures if the connection between two ad-
jacent signage agents is located within a fire-affected
ICAART 2025 - 17th International Conference on Agents and Artificial Intelligence
502

Figure 5: Dynamic guidance with ε
∗
b
= 3, ε
∗
u
= 3, & ε
∗
z
= 2.
Figure 6: Dynamic guidance with and without failure for 64
drift cases.
area. In this scenario, signage agents fail randomly ir-
respective of the fire hazard h
t
(x,y)
. The failure proba-
bility p
f
remains constant throughout the simulation,
and each signage agent fails with this probability at
every simulation time t. Because the specific sign that
will cause failure is unknown, the impact of system
failure is expected to be significant; a sign that is crit-
ical to several evacuees may fail at a crucial moment.
The connectivity of the graph is likely compromised
because of random failures. By contrast, in Scenario
1, the failure nodes were typically clustered together
because they were highly related to the areas occu-
pied by the fire, which preserved high connectivity
in the graph. The loss of graph connectivity can sig-
nificantly affect the performance of distributed algo-
rithms because messages cannot be delivered to nodes
in an isolated graph.
Figure 3 (C) shows the temporal evolution of the
maximum eigenvalues λ
E
and λ
W
for Scenario 2.
Compared with Fig. 3 (A), both λ
E
and λ
W
decrease
significantly, particularly λ
W
, because of graph con-
nectivity loss.
Comparing Scenarios 1 and 2 is challenging be-
cause we must estimate p
f
for Scenario 2, in a man-
ner comparable to Scenario 1. To accomplish this, we
used the median number of failed nodes at the end of
the simulation for each scenario. We conducted 100
simulations by varying ε
∗
z
, ε
∗
u
, and ε
∗
b
from 0,1,2,3,
resulting in 6400 data points for both scenarios. The
median values were compared. The same experiments
were performed by varying p
f
, which was estimated
to be p
f
= 0.0006. Table 1 lists the minimum, me-
dian, mean, and maximum numbers of failed nodes at
the end of the simulations for Scenarios 1 and 2 with
p
f
= 0.0006.
Table 1: Number of failure nodes observed in Scenarios 1
and 2.
Scenario min median mean max
1 0.0 7.0 8.0 23.0
2 (p
f
= 0.0006) 0.0 7.0 7.6 20.0
We randomly sampled 100 data points from each
dataset and conducted a Wilcoxon rank-sum test,
which yielded W = 4861 and a p-value of 0.73. Con-
sequently, the null hypothesis was accepted, indi-
cating no significant difference between the datasets
when p
f
= 0.0006.
We performed 1000 system failure simulations in
which some components malfunctioned during fire
evacuation in Scenarios 1 and 2. The chart on the
left side of Fig. 5 shows the results for Scenario
1, whereas the right-hand chart shows the results for
Scenario 2, as summarized in row B of Table 2. Lines
3–5 of Algorithm 2 were omitted from this analysis.
We performed 100 simulations with ε
∗
z
, ε
∗
u
, and ε
∗
b
varying from 0, 1,2,3, resulting in 64 cases to com-
pare conditions with and without failure. The medi-
ans of T
max
and
¯
θ were used for the evaluation, and
Wilcoxon rank-sum tests were applied because of the
non-Gaussian distributions. In Scenario 1, only 17 of
the 64 cases were statistically significant, suggesting
a minimal impact of failure in most instances. Con-
versely, in Scenario 2, all 64 cases were statistically
significant for either T
max
or
¯
θ, with 34 cases being
significant for both, indicating a pronounced system
failure effect.
Figure 6 shows the means and medians of T
max
and
¯
θ for the 64 cases, with the means shown in blue
and the medians in red as ε
∗
z
, ε
∗
u
, and ε
∗
b
, respec-
tively. The diagonal line plots illustrate that the re-
sults with and without failures are similar. Given non-
Gaussian distributions, medians serve as better sum-
mary statistics. However, considering rare but catas-
trophic events (RBCE), which are critical in evacua-
tion studies (Tsurushima, 2024a), means should also
be considered. These charts represent overlapping
units (time and hazard) within a single chart.
6.1 Spatial Interpolation
Figure 6 illustrates that the means of
¯
θ are above the
diagonal line in Scenario 1, and all plots (including
the means and medians of T
max
and
¯
θ) are above the
diagonal line in Scenario 2, indicating the significant
Performance Analysis and Failure Mitigation Strategies for a Resilient Dynamic Evacuation Guidance System
503
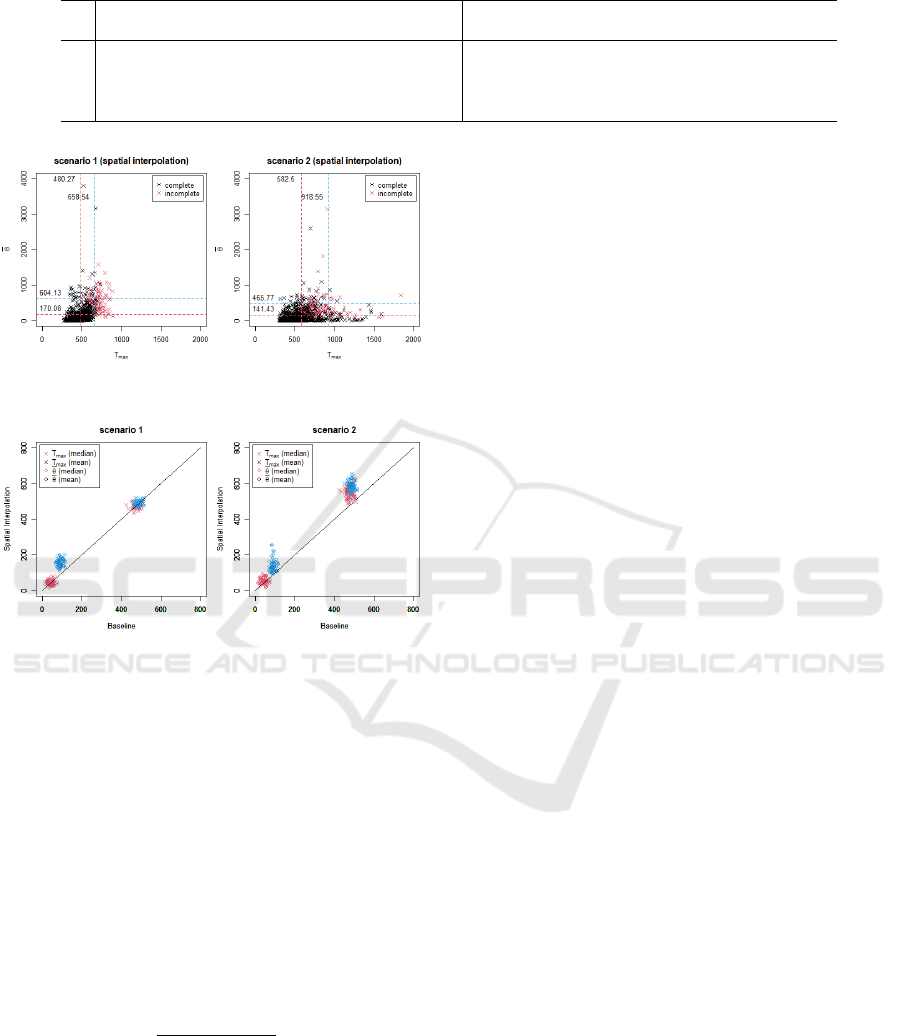
Table 2: Summary of the results.
ˆ
T
max
,
¯
T
max
,
˙
T
max
denotes the median, mean, AVaR
0.2
of T
max
, similar to
ˆ
θ,
¯
θ,
˙
θ.
Scenario 1 Scenario 2
ˆ
T
max
¯
T
max
˙
T
max
ˆ
θ
¯
θ
˙
θ
ˆ
T
max
¯
T
max
˙
T
max
ˆ
θ
¯
θ
˙
θ
A 443.00 457.26 614.25 33.53 92.66 299.84 - - - - - -
B 462.00 481.56 669.36 48.62 174.51 621.35 568.00 631.88 1040.97 62.72 200.59 720.49
C 462.00 480.27 658.54 50.37 170.08 604.13 531.50 582.50 918.55 54.19 141.43 465.77
D 444.50 451.04 577.29 38.44 112.92 380.30 400.00 427.97 626.68 33.55 103.62 346.48
Figure 7: Spatial interpolation results with ε
∗
b
= 3, ε
∗
u
= 3,
& ε
∗
z
= 2.
Figure 8: Spacial interpolation with and without failure for
64 drift cases.
effects of failures that need to be mitigated.
These adverse effects are generally caused by
missing data regarding component failures, which can
be estimated using spatial interpolation techniques.
To enhance the evacuation guidance when component
failures are identified,
b
W
C
, which is used to search
for an optimal path in Algorithm 2, is modified us-
ing a spatial interpolation technique (lines 3–5). We
assume that each signage agent determines an edge
k = (i, j) as malfunctioning if both t −
b
T [i] and t −
b
T [ j]
exceed I
∗
b
+ ε
∗
b
+ ε
∗
z
, where t denotes the current time.
The estimation of w
C
k
is as follows:
˜
w
C
k
=
∑
n∈Φ(k)
d
−2
kn
w
C
n
∑
m∈Φ(k)
d
−2
km
, (5)
where Φ(k) denotes the set of neighboring edges of k;
for instance, Φ(1) = {2, 13, 27,36}. w
C
k
is updated by
˜
w
C
k
when edge k is determined to have malfunctioned.
Figure 7 shows the results of 1000 simulations us-
ing a spatial interpolation. The results indicate that
the mean and AVaR values are suppressed in Scenario
2, whereas they remain comparable in Scenario 1, A
summary of these results can be found in row C of
Table 2.
Figure 8 shows the impact of drifts ranging from
zero to three on the medians and means of T
max
and
¯
θ
when spatial interpolation is employed. Compared to
Fig. 6, the plots are positioned closer to the diagonal
lines, particularly in Scenario 2, indicating the posi-
tive impact of spatial interpolation in mitigating the
adverse effects of component failures.
6.2 Persistent Guidance in Failure
Up to this point, we assumed that failed signage
agents do not provide any guidance direction, lead-
ing to random behaviors by evacuation agents, be-
cause they can only make random selections. This as-
sumption leads to prolonged evacuation times and in-
creased fire hazards for evacuation agents, potentially
resulting in unrealistic or overestimated values of T
max
and
¯
θ. An alternative assumption is that failed signs
continue to display the last guidance direction, as
shown before malfunctioning. This approach, known
as persistent guidance, is feasible if physical indica-
tors, rather than electrical devices, are used to indi-
cate the guidance direction. Although the direction of
guidance from failed signs may be inaccurate, evacu-
ation agents do not resort to random behaviors.
We conducted 1000 simulations under the as-
sumption of persistent guidance during sign failures.
The results are presented in Fig. 9 and summarized
in row D of Table 2 indicate that persistent guidance
produces nearly comparable or, in some cases, better
outcomes. This improvement is attributed to the ab-
sence of random behaviors among the agents, result-
ing in shorter evacuation times and potentially lower
fire hazards.
Figure 10 shows the effect of drifts ranging from
zero to three on the medians and means of T
max
and
¯
θ when persistent guidance is employed. In these fig-
ures, many fall on or below the diagonal lines, indicat-
ing the positive effects of persistent guidance. How-
ever, a few plots appear above the diagonal lines, with
some showing exceptionally high values, suggesting
rare but catastrophic outcomes that need to be miti-
gated.
ICAART 2025 - 17th International Conference on Agents and Artificial Intelligence
504
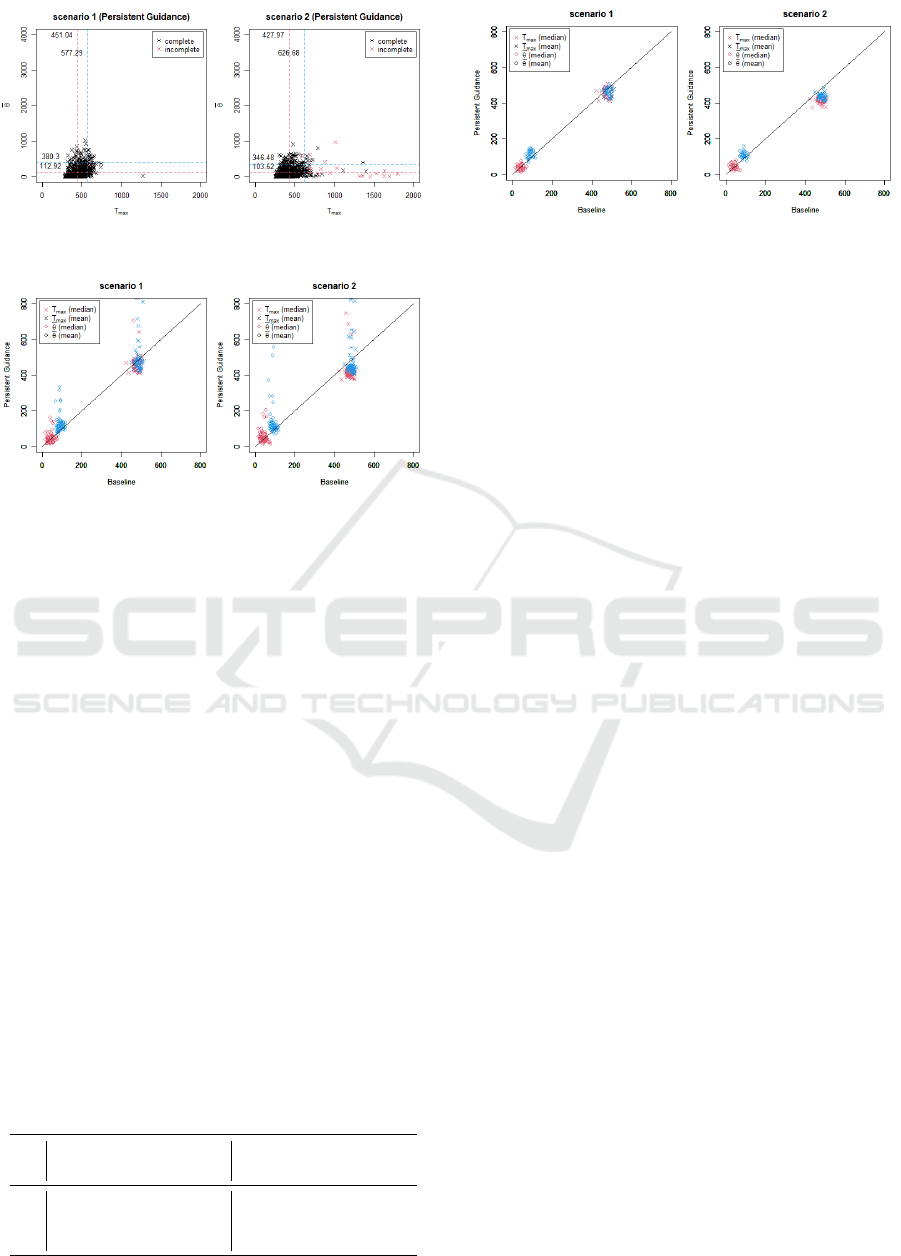
Figure 9: Persistent guidance results with ε
∗
b
= 3, ε
∗
u
= 3, &
ε
∗
z
= 2.
Figure 10: Persistent guidance with and without failure for
64 drift cases.
To assess the impact of drifts, we performed
a multiple regression analysis using T
max
/T
∗
max
and
¯
θ/
¯
θ
∗
as dependent variables and ε
∗
b
, ε
∗
u
, and ε
∗
z
as inde-
pendent variables. Here, T
max
and
¯
θ denote the results
with persistent guidance, whereas T
∗
max
and
¯
θ
∗
repre-
sent the baseline results. The results are summarized
in Table 3, indicating the negative impact of ε
∗
b
and
the positive impact of ε
∗
z
(p values for Scenarios 1 and
2 were 2.2e-16 and 3.6e-13, respectively).
Considering the negative and positive impacts of
ε
∗
b
and ε
∗
z
, assuming a range for ε
∗
b
of 1,2,3, and for
ε
∗
z
of 0,1,2, we filtered 36 of the 64 cases depicted in
Fig. 11. In this filtered set, nearly all the plots fell on
or below the diagonal lines, indicating that persistent
guidance with limited time drifts and delays yielded a
performance comparable to that of an ideal system.
7 DISCUSSION
In this study, we investigated two types of uncer-
tainties in a distributed dynamic evacuation guidance
Table 3: Results of multiple regression analysis highlight-
ing the effects of variables on guidance performance.
Scenario 1 Scenario 2
coeff p-value coeff p-value
ε
∗
u
-0.0053 0.752 0.0345 0.577
ε
∗
b
-0.1495 2e-16 *** -0.3950 7.31e-10 ***
ε
∗
z
1.1076 1.14e-13 *** 0.3237 2e-16 ***
Figure 11: Persistent guidance with limited drifts, with and
without failure, for 64 drift cases.
system: missing information owing to failed sys-
tem components and inaccurate information caused
by delays and drifts in the message-passing mech-
anism used for information sharing among compo-
nents. Spatial interpolation was tested to mitigate the
former uncertainty, which resulted in positive effects
in both scenarios. However, the results did not reach
baseline levels (Fig. 8). Figure 10 demonstrates that
persistent guidance is promising, because most plots
lie on or below the diagonal lines in both scenarios,
indicating comparable or better results than the base-
line. Although these two methods cannot be directly
compared owing to their differing assumptions, these
experiments may provide valuable insights for real-
world applications.
This figure also highlights a critical issue not ob-
served in other cases: a small number of plots de-
viate significantly from the diagonal lines, indicating
the presence of RBCE. Unlike in other cases, delays
and drifts in the distributed system adversely affect
the guidance results for persistent guidance. Multi-
ple regression analysis revealed intriguing insights: ε
∗
b
had a negative effect, whereas ε
∗
z
had a positive effect
on the guidance performance. The negative effect of
ε
∗
b
, such as when ε
∗
b
= 0, is counterintuitive, because
this condition implies that all nodes estimate their lo-
cal information simultaneously, ensuring consistency,
provided ε
∗
z
= 0. However, when ε
∗
z
̸= 0, ε
∗
b
= 0 causes
inconsistencies in the graph information, resulting in
several cycles on the graph. In persistent guidance,
all agents adhered to the sign directions without ex-
hibiting random behaviors, which led to catastrophic
outcomes when the graph contained cycles.
The techniques employed in this study are rela-
tively straightforward, including the Broadcast and
UpdateSign algorithms, as well as spatial interpola-
tion. Although these techniques can be enhanced us-
ing more advanced methods, doing so may pose chal-
lenges. We developed a pretrained denoising autoen-
coder that learns fire-spread patterns in the environ-
ment and incorporates them into signs for spatial in-
terpolation. However, this approach resulted in an in-
Performance Analysis and Failure Mitigation Strategies for a Resilient Dynamic Evacuation Guidance System
505

ferior performance compared to the simple spatial in-
terpolation technique proposed in this study.
Furthermore, the optimal placement of signage
agents and their connections within the floor plan
is crucial but presents challenges. Although simple
agents have been used for system evaluation, studying
the impact of human factors on evacuation guidance
performance is also crucial. Addressing these issues
will be essential for future studies.
8 CONCLUSION
A distributed dynamic evacuation guidance system
utilizing Broadcast and UpdateSign algorithms was
proposed. System performance was evaluated using
an asynchronous multiagent simulation framework.
Two strategies were introduced to mitigate the ad-
verse effects of component failure. Remarkably, the
system with failed components not only maintained
functionality, but also performed comparably to a
fully operational system. This advancement repre-
sents a significant step toward developing evacuation
support systems capable of operating effectively un-
der disaster conditions, offering valuable insights into
creating resilient systems that can sustain functional-
ity in harsh environments.
ACKNOWLEDGEMENT
The author would like to thank Mr. Kei Marukawa for
his assistance and helpful discussions, as well as Ed-
itage (www.editage.jp) for English language editing.
REFERENCES
Baidal, C., Arreaga, N., and Padilla, V. (2020). Design
and testing of a dynamic reactive signage network to-
wards fire emergency evacuations. International Jour-
nal of Electrical and Computer Engineering (IJECE),
10:5853.
Galea, E., Xie, H., Deere, S., Cooney, D., and Filippidis, L.
(2017). Evaluating the effectiveness of an improved
active dynamic signage system using full scale evacu-
ation trials. Fire Safety Journal, 91.
Galea, R. E., Xie, H., and Lawrence, J. P. (2014). Experi-
mental and survey studies on the effectiveness of dy-
namic signage systems. Fire Safety Science, 11:1129–
1143.
Haghani, M. (2020a). Empirical methods in pedestrian,
crowd and evacuation dynamics: Part I. experimen-
tal methods and merging topics. Safety Science,
129:104743.
Haghani, M. (2020b). Empirical methods in pedestrian,
crowd and evacuation dynamics: Part II. field methods
and controversial topics. Safety Science, 129:104760.
Helbing, D., Farkas, I., and Vicsek, T. (2000). Simu-
lating dynamical features of escape panic. Nature,
407(28):487–490.
Kawahara, J., Hara, T., and Sasabe, M. (2023). On robust-
ness against evacuees’ unexpected movement in auto-
matic evacuation guiding. Computers and Electrical
Engineering, 105:108531.
Lin, H.-M., Chen, S.-H., Kao, J., Lee, Y.-M., Lin, C.-
Y., and Hsiao, G. (2017). Applying active dynamic
signage system in complex underground construction.
International Journal of Scientific & Engineering Re-
search, 8.
Lovreglio, R., Fonzone, A., and dell’Olio, L. (2016). A
mixed logit model for predicting exit choice during
building evacuations. Transaportation Research Part
A: Policy and Practice, 92:59–75.
Lujak, M., Billhardt, H., Dunkel, J., Fern
´
andez, A., Her-
moso, R., and Ossowski, S. (2017). A distributed ar-
chitecture for real-time evacuation guidance in large
smart buildings. Computer Science and Information
Systems, 14:257–282.
Nguyen, V.-Q., Vu, H.-T., Nguyen, V.-H., and Kim, K.
(2022). A smart evacuation guidance system for large
buildings. Electronics, 11:2938.
Rust, P., Picard, G., and Ramparany, F. (2020). Resilient
distributed constraint optimization in physical multi-
agent systems. 24th European Conference on Artifi-
cial Intelligence - ECAI 2020, pages 195–202.
Tsurushima, A. (2024a). Integrated simulation approach for
dynamic distributed evacuation guidance under fire
spread and rare but catastrophic events. Proceed-
ings of the 16th International Conference on Agents
and Artificial Intelligence - Volume 1 (ICAART2024),
pages 105–116.
Tsurushima, A. (2024b). Simulation analysis of evacuation
guidance using dynamic distributed signage. Proceed-
ings of the 16th International Conference on Agents
and Artificial Intelligence - Volume 1 (ICAART2024),
pages 179–188.
Wilensky, U. (1999). Netlogo. Center for Connected Learn-
ing and Computer-Based Modeling, Northwesten
University, Evanston, IL.
Zhao, H., Schwabe, A., Schl
¨
afli, F., Thrash, T., Aguilar, L.,
Dubey, R., Karjalainen, J., H
¨
olscher, C., Helbing, D.,
and Schinazi, V. (2022). Fire evacuation supported
by centralized and decentralized visual guidance sys-
tems. Safety Science, 145:105451.
Zhao, H., Winter, S., and Tomko, M. (2017). Integrating de-
centralized indoor evacuation with information repos-
itories in the field. ISPRS International Journal of
Geo-Information, 6(7):213.
Zu, Y. and Dai, R. (2017). Distributed path planning for
building evacuation guidance. Cyber-Physical Sys-
tems, 3(1-4):1–21.
ICAART 2025 - 17th International Conference on Agents and Artificial Intelligence
506
