
Sweat Quantification During Electrodermal Analysis
Combining Paper-Based Microfluidics with Printable Electrodes:
Design and Materials
Batoul Hosseinzadeh
1a
, Sarah Tonello
1b
, Nicola Francesco Lopomo
2c
and Emilio Sardini
1d
1
Department of Information Engineering, University of Brescia, Via Branze, 38, Brescia, Italy
2
Department of Design, Politecnico di Milano, Via Giovanni Durando, 10, Milano, Italy
Keywords: Electrodermal Activity, Paper-Based Microfluidics, Printable Electrodes, Microfluidic Systems.
Abstract: Significant challenges in Electrodermal Activity (EDA) are represented by poor wearability of commercial
electrodes and imprecise differentiation between alterations in skin conductivity due to nervous system
activities or sweat secretion in response to other stimuli. In this light, we propose a device that combines
paper-based microfluidic with printable electrodes to monitor EDA and sweat rate/volume simultaneously.
This setup not only refines wearability by implementing flexible, skin-compatible materials but also improves
quantification accuracy by distinguishing between baseline EDA conductivity and actual sweat output
providing a higher perception of the physiological state by harmonized sweat and EDA data. The preliminary
analysis reported was performed in a laboratory environment aiming at two main objectives: i) optimize the
design of paper-microfluidics pattern ii) compare different printable inks to select the most suitable one to
minimize contact impedance and achieve a sensitivity comparable to standard EDA electrodes. Results
obtained suggested the use of thick teeth design of microfluidics geometry to reduce variability in
measurements and Poly(3,4-ethylenedioxythiophene) polystyrene sulfonate (PEDOT:PSS) as an optimal
coating material to provide superior sensitivity (3.07 μS/μl) and repeatability (average Relative Standard
Deviation (RSD) of 15%,) with a linearity range of 0-50 µl range while preserving low contact impedance
and trustworthy signals.
1 INTRODUCTION
Wearable technologies have increasingly become
popular, above all, in healthcare, since they allow to
empower individuals by tracking their lifestyle and
physiological conditions, timely (Iqbal, Mahgoub,
Du, Leavitt, & Asghar, 2021). While most devices
monitor physiological responses, such as pulse rate
oxygen level or body temperature, new investigations
concentrate on some valuable digital markers like
Electrodermal Activity (EDA) as it represents an
important tool in behavioral medicine, fulfilling as a
biosignal for individual emotional response (both
state and trait properties) (Chung et al., 2019; Kuo,
Wu, & Wang, 2022); in fact, it directly tracks stress-
related events on body activities and supports the
definition of possible strategies to recover
a
https://orcid.org/0000-0002-0002-8172
b
https://orcid.org/0000-0002-7325-7988
c
https://orcid.org/0000-0002-5795-2606
d
https://orcid.org/0000-0001-8629-7316
psychosomatic conditions through biofeedback.
Accurate EDA quantification is thus a crucial
characteristic in developing wearable technology
applicable in healthcare and occupational fields
In fact, EDA represents an effective solution in
acquiring emotional and stress-related conditions,
since its measurements is strictly related to complex
physiological processes. In particular, physiological
excitation is managed by a regulating interplay
between the sympathetic and parasympathetic sectors
of the autonomic nervous system (ANS); while the
parasympathetic system preserve energy, the
sympathetic part raises, metabolisms to tackle
external provocation, enhancing heart rate, arterial
pressure, and sweat secretion (Stanković, Adamec,
Kostić, & Habek, 2021). Sympathetic fibrils enclose
eccrine sweat secretors and their activation leads to
Hosseinzadeh, B., Tonello, S., Lopomo, N. F. and Sardini, E.
Sweat Quantification During Electrodermal Analysis Combining Paper-Based Microfluidics with Printable Electrodes: Design and Materials.
DOI: 10.5220/0013235900003911
Paper published under CC license (CC BY-NC-ND 4.0)
In Proceedings of the 18th International Joint Conference on Biomedical Engineering Systems and Technologies (BIOSTEC 2025) - Volume 1, pages 65-73
ISBN: 978-989-758-731-3; ISSN: 2184-4305
Proceedings Copyright © 2025 by SCITEPRESS – Science and Technology Publications, Lda.
65

sweat production; as sweat penetrates the ducts, it
generates low-resistance routes that amplify skin
conductivity, detectable as electrodermal activity.
EDA, therefore, represents sympathetic nervous
functions and performs as a sensitive signal for
alteration in excitement correlated to emotion,
cognition, and awareness.
Clinically, EDA is tracked with an EDA sensor
transcribes this conductivity alteration into analytical
data (W. Boucsein, 2012). Although EDA
measurement has proceeded during the past century,
most research has been restricted to short-term
observation in labs or distinct surroundings. There is an
increasing demand for wearable technologies to track
EDA over a long-term period, as they enable seamless
and non-invasive data collection during daily activities
(Kappeler-Setz, Gravenhorst, Schumm, Arnrich, &
Tröster, 2013). This extended observation can disclose
sympathetic nervous system patterns on a long-lived
scale rather than short-term measurement, revealing
states formerly unnoticeable. Additionally, monitoring
EDA in “natural” and ecological conditions provides a
more accurate and reliable understanding of
physiological status than measurements in artificial
settings (Posada-Quintero & Chon, 2020). However, a
main challenge for pleasant long-term EDA recording
is the limited accessibility of reliable and faithful
flexible sensors. In fact, EDA measurement needs two
electrodes, which must be placed on the user's skin;
anyhow, present commercial silver/silver chloride
(Ag/AgCl) electrodes are based on bulk materials and
thence inflexible, and depend on gels and powerful
adhesives, which can inhibit wearability, above all,
whenever specific conditions are under analysis (W.
Boucsein, 2012).
As wearable technology is growing, there are
rising demands for flexible electrodes, requesting
scalable manufacturing protocols (Zheng et al.,
2014). Flexible and stretchable EDA sensors can be
fabricated employing printed electrodes to present a
novel technique that improves both the efficiency and
convenience of wearable devices. Indeed, printed
electrodes can be fabricated on flexible, and light
substrates such as paper or polymers via scalable
approaches such as inkjet or screen printing, which
are economical and authorized for faithful patterning
(Pang, Lee, & Suh, 2013). With printed electrodes,
EDA sensors can be effectively integrated into
wearable tools, embedded into clothing, or attached
directly to the skin, providing continuous and
seamless tracking of emotional and stress-related
states in real-world conditions. Moreover, printed
electrodes promote higher sensitivity and versatility,
necessary for recording narrow alterations in skin
conductivity associated with stress and excitement.
This development not only expands the
implementation of EDA measurement in health and
behavioral research but also assists the development
of effective and user-friendly wearable technology.
Additionally, EDA sensors clinically encounter
some restrictions due to their inability to precisely
differentiate between alterations in skin conductivity
related either to true sweat secretion or other
environmental parameters. These variations result in
inherent variability in EDA monitoring, specifically
during long-term tests, where evaporation and weak
adherence influence signal trustworthiness (Cui &
Schlessinger, 2006). Incorporating a microfluidic
system overcomes these limitations by transferring
sweat continually to the electrodes, preserving
acceptable skin contact and minimizing dehydration-
related attenuation. On the other hand, microfluidic
channels, been fabricated for this purpose, could
allow to obtain also accurate sweat rate and volume
measurements, acquired in parallel to EDA data, thus
serving to distinguish between baseline conductance
alterations and real sweat events (Ullah et al., 2023).
While conventional microfluidic devices require
complicated lithographic operations, hydrophilic
porous channels like filter paper turned up as an easier
substitute; in fact, the paper-based apparatus utilizes
natural capillary movement to instantly take in and
transfer sweat, enabling them efficient for constant,
skin-compatible observation (Silva-Neto et al., 2023).
In this study, we propose a novel integrated
solution able to simultaneously track the electrodermal
activity and sweat rate employing a unified electrode
design. The sensor under development combines a
paper-based microfluidic system with printed
electrodes to monitor both EDA and sweat
rate/volume. This multi-functional action can provide
accurate measuring of skin conduction alteration while
steadily collecting and evaluating sweat along the
microfluidic layer. The paper-based absorptive layer
conducts sweat instantly from the skin to the
electrodes, enabling immediate measuring of sweat
secretion rate and volume. This setup not only refines
wearability through the implementation of flexible,
and skin-compatible materials but also improves
quantification accuracy by distinguishing between
baseline EDA conductivity and actual sweat output
providing a higher perception of the physiological state
by harmonized sweat and EDA data. In this picture, the
present contribute reports a preliminary analysis of the
design in term of paper-microfluidics geometry and of
printable materials to maximize flexibility and to
minimize contact impedance.
BIODEVICES 2025 - 18th International Conference on Biomedical Electronics and Devices
66
2 MATERIALS AND METHODS
The materials employed for preparing the paper-
based microfluidic sensor included: Whatman filter
paper (Grade 1), chosen for fast fluid transportation
of 150 sec/100 ml, Poly(3,4-ethylenedioxythiophene)
polystyrene sulfonate (PEDOT:PSS) and single-
walled Carbon nanotube (CNT); phosphate buffer
solution (PBS) (pH: 7.4); all these materials were
purchased from Sigma Aldrich company. The
disposable Ag/AgCl conductive hydrogel EDA
Electrodes were obtained from Cardinal Health
TM
.
Silver nanoparticles based aqueous ink (JS-A426)
was obtained from Novacentrix.
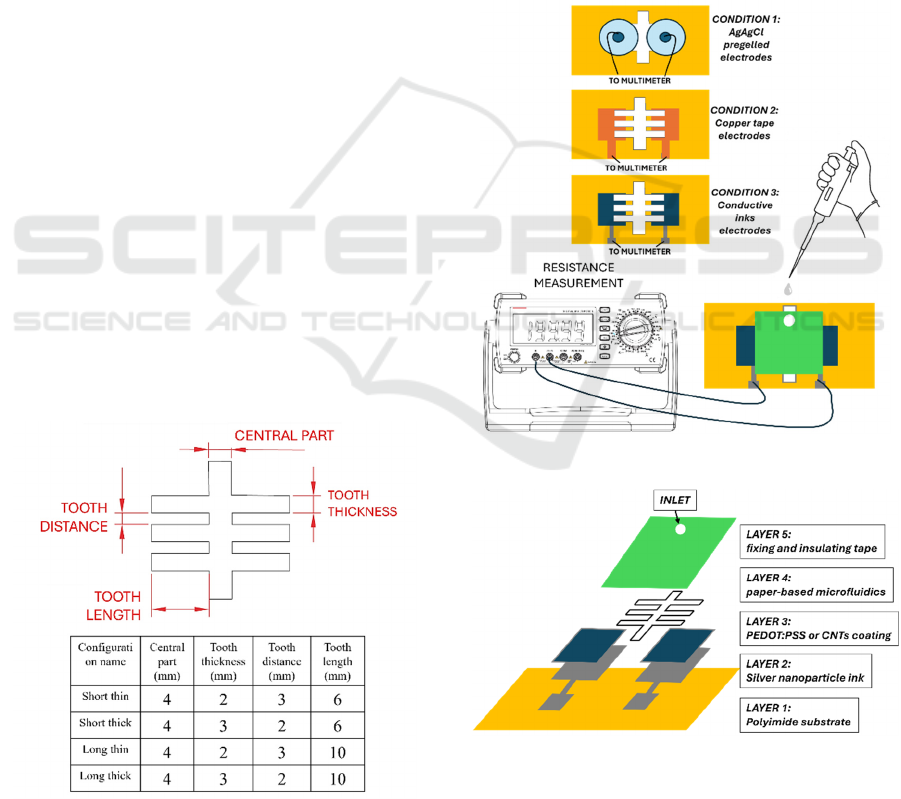
2.1 Layout Design
The geometry design of the microfluidic system is
important for effective sweat delivery and in line with
EDA signal recording. The patterns were designed
using a standard CAD software (Autocad) to
investigate the optimal route for fluid flow through
the Whatman paper by exploiting capillary action,
and to guarantee that liquid was delivered to the
electrodes without untimely dehydration. Each
structure concentrated on designing an adjusted,
small pathway to conduct liquid correctly from input
to the sensing electrodes. The branched pattern
structure was utilized to assess equal distribution,
which enhances the sensitivity and stability of the
signal. Thence, patterns in four different
configurations were designed, with dimensions of
central part, thickness tooth, distance, and length
tooth as detailed in figure 1.
Figure 1: Details of paper microfluidics patterns.
2.2 Laser-Cut Microfluidics Pattern
The preparation of the paper-based microfluidic
pattern was carried out by using a CO₂ laser cutting
system (FLUX Beambox instrument, 40 W laser and
1000 dpi resolution). Cutting parameters were
defined compatible with Whatman filter paper to
avoid extra heating buildup; specifically, the precise
defined designs were introduced into the cutter
software (Beam Studio) and critical parameters, such
as power, speed, and frequency, were attentively
calibrated to obtain clean, slight channels without
burning or damaging the paper edges. Eventually, a
medium power of 18 % of maximum output and a
mild cutting speed of 18 mm/s were set to keep the
paper’s structural unity and capillary features.
Figure 2: Experimental set up.
Figure 3: Detailed components of the devices combining
printed approach to realize EDA with microfluidics.
Sweat Quantification During Electrodermal Analysis Combining Paper-Based Microfluidics with Printable Electrodes: Design and Materials
67

2.3 Measurement Protocol
The protocol for characterizing electrodes exploited
the use of a controlled volume of a PBS solution to
induce measurable changes in the DC resistance,
from with changes in conductance can be then
calculated as the reciprocal of the values obtained.
The instrument employed to perform measurement
was a benchtop digital multimeter (6 1/2 digits,
Keysight) with a sampling rate of 2 Hz. This PBS
saline solution was selected to imitate sweat owing to
its comparable ionic constitution. The relation
between volume and resistance was obtained by
performing following standard addition of 10 µl
injected into the inlet part of the paper-based
microfluidic pattern. Three different types of
electrodes were compared. The traditional EDA
Ag/AgCl pre-gelled wet electrodes were examined
first to monitor their feedback to the conductive way
generated by the liquid (condition 1, fig. 2). Further,
two different configurations with dry electrodes were
tested: dry copper tape electrodes and dry electrodes
realized with different combinations of printable inks
(condition 2 and 3, fig. 2).
The copper electrodes, introduced as a first step to
simulate dry printed electrode configuration, were
obtained by cutting the conductive copper tape into
1.5 cm × 1.5 cm dimensions and located underneath
the paper-based microfluidic structure, setting up a
conductive medium for initial conduction measuring.
This copper-tape-based layout lets us evaluate a dry
electrode-based setup and improve the protocol.
A similar construction was assembled using the
printed electrode approach. A 1.5 cm × 1.5 cm area
was covered with a layer of silver ink to make a firm
and highly conductive foundation. To improve and
optimize signal sensitivity and reduce contact
impedance, a secondary conductive film was coated
on top of the silver base, made of either PEDOT:PSS
or CNT, materials well-known for their flexibility and
conductivity (figure 3). Every setup (copper tape,
Ag/PEDOT:PSS, and Ag/CNT was specifically
examined, by individually exploiting the same
procedure (figure 2). Variability and repeatability
ware evaluated by replicating the same measurements
in different conditions; repeatability, in particular,
was evaluated replicating each test for at least four
times for any electrode composition. Furthermore,
reproducibility was evaluated by preparing 3 identical
configurations for each material type and repeating
the test.
2.4 Data Analysis
Data obtained from each resistance measurement
against time were converted in conductivity values by
calculating the reciprocal of the DC resistance. After
that, data were filtered with a moving-average filter
(window of 20 samples), to remove high-frequency
noise before proceeding with the calculation of
metrological parameters. Further, median filters were
exploited to remove spikes due to external
interference during the following injections.
Conductivity values used to build the calibration
plot were sampled from the measured curve against
time exploiting a thresholding of the first derivative
of the signal. In detail, injection times were
recognized on the plot as the instants corresponding
to the values overcoming a defined threshold; the
threshold was adapted depending on the full-scale
range measured in each test. Once the injection times
were identified, sampling times were detected adding
30 s to each injection time, and the conductivity value
corresponding to that instant was sampled and
exploited to build the calibration curve. The 30 s
delay of the sampling time respect to the injection
time allow us to properly sample conductivity values
after that transient behavior occurring at every
injection. This transient instability observed for the
first seconds after each injection represents a well-
known challenge when coupling electrodes with
microfluidics (Arantes & Paixão, 2022; Lai, Lim,
Lee, & Huang, 2021) and it is due to the perturbation
of the complex interaction between paper-based
microfluidics surface and conductive electrodes
taking place when the newly injected liquid is filling
the porous microfluidics, thus they should not be
considered since in those instants the proportionality
between liquid volume and conductivity does not
appear well defined.
Sensitivity was calculated as the slope of the
calibration curve obtained by fitting the current
values corresponding to each concentration. Relative
Standard Deviation (RSD) was also calculated as the
ratio between the standard deviation and the average
value of repetitive measurements.
3 RESULTS
3.1 Geometries Comparison
Results obtained from experiments carried out using
wet electrodes to compare different geometries of the
laser-cut paper-based layouts showed no significant
differences in terms of sensitivities, as summarized in
BIODEVICES 2025 - 18th International Conference on Biomedical Electronics and Devices
68
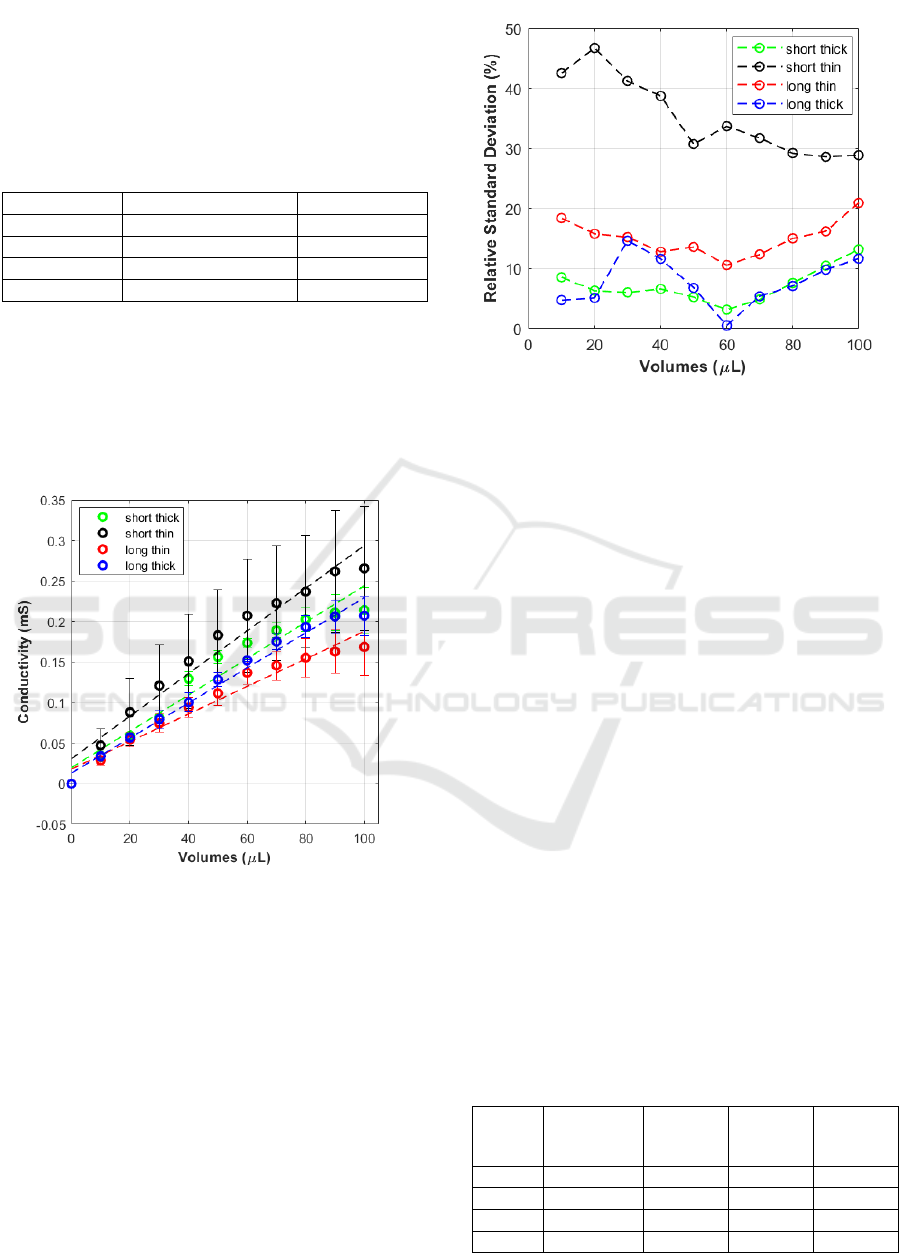
Table 1 and displayed graphically in figure 4. Thus,
despite the short-thin-teeth geometry showed the
highest average sensitivity, the high RSD associated
made this approach worst compared with other
geometries.
Table 1: Average sensitivities in μS/μL obtained for each
geometry, and corresponding RSD in %.
Geometr
y
Sensitivit
y
(
μ
S/
μ
l
)
Max RSD
(
%
)
Short Thin 2.629 46%
Long Thin 1.699 21%
Short Thic
k
2.241 13%
Lon
g
Thic
k
2.162 15%
Significant differences can be observed in terms
of variabilities. Thin-teeth geometries in particular
showed relative standard deviations higher than 30%
for short and 15% for long teeth. On the contrary,
thick teeth both long and short, showed comparable
variabilities, lower than 15% for all the volumes of
PBS tested (figure 5).
Figure 4: Comparison among calibration curves obtained
combining pre-gelled Ag-AgCl electrodes with different
paper-based laser cut designs.
This difference should probably be due to the most
stable contact area created between the pattern and
electrodes in the case of thicker than thinner teeth.
Further, the higher available surface provides an
increased absorption capacity during the different
steps. Considering these results, since lower RSD in
the studies indicates a higher reliable measurement
system, crucial for accurate process improvement,
thick teeth geometries were selected as the most
reliable for further tests.
Figure 5: Comparison among RSD obtained combining pre-
gelled AgAgCl electrodes with different paper-based laser
cut designs.
3.2 Wet and Dry Electrodes
Comparison
Significant differences can be observed comparing
the traditional pre-gelled wet electrodes in Ag/AgCl
with the dry copper electrodes, with no significant
differences between the geometry with long teeth and
the one with short teeth. The similarity observed
between long and short teeth represents an interesting
finding that provides the opportunity to adapt the
length of the teeth in future works targeting
simultaneous sweat volume and EDA measurements.
The teeth length can therefore be optimized
depending on the distance between the electrodes that
can ensure the most suitable EDA measurements.
Considering that, from literature, the most common
distances between EDA electrodes is between 10 and
20 mm, long teeth geometry appears as the most
promising and thus the experiments performed
employing printable inks were performed relying on
this geometry. Results obtained in terms of
sensitivities, linear ranges, and RSD are summarized
in Table 2 and graphically shown in figure 6.
Table 2: Average sensitivities in μS/μL obtained for the two
different electrode types (wet and dry), and corresponding
RSD in %.
Electrod
e type
Geometry Range
linearity
(
μ
l)
Sensitivity
(μS/μl)
Max RSD
(%)
WET Short Thic
k
0-100 2.403 21%
WET Lon
g
Thic
k
0-100 2.420 18%
DRY Short Thic
k
0-50 0.518 50%
DRY Long Thic
k
0-50 0.433 50%
Sweat Quantification During Electrodermal Analysis Combining Paper-Based Microfluidics with Printable Electrodes: Design and Materials
69
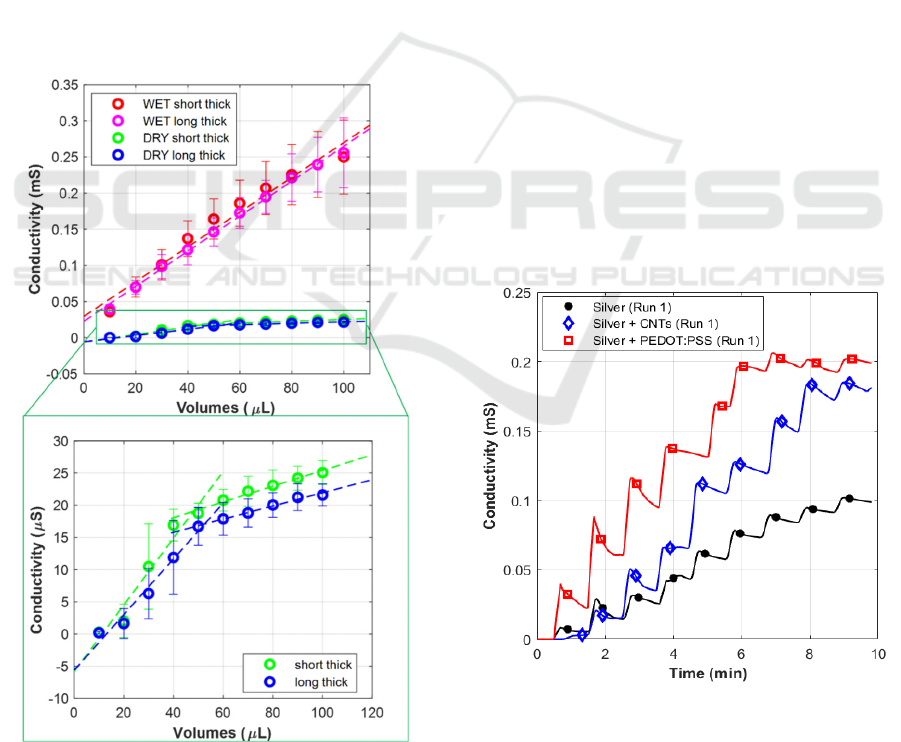
In particular, regarding the sensitivities, wet
electrodes showed an average sensitivity of
almost 5
fold respect to dry copper electrodes, in the range 0-
50 μl, and of almost 25-fold in the range 50-100 μl
where the dry electrodes showed a saturation
behaviour, with a sensitivity of 0.1 ± 0.01 μS/μl.
Regarding variability, the largest variability was
observed in the range 0-50 μl, where dry electrodes
showed RSD higher than 50%. This behaviour could
be related to a limited interface between the dry
electrode surface and the paper surface poorly soaked
in PBS. The RSD appears to decrease, reaching
values comparable with the wet-gelled electrodes for
volumes in the range 50-100 μl, where probably a
higher surface interaction is obtained due to the
increased soaking of the paper fluidics. Differently
from dry electrodes, wet electrodes showed similar
RSD (< 20 %) for all the volumes of PBS injected,
regardless of the range tested, confirming that the
gelled surfaces of the electrodes ensure a lower
contact impedance and a stable interface with the
Figure 6: Comparison among calibration curves obtained
employing wet and dry electrodes combined with thick-
teeth pattern geometries.
paper fluidics no matter the level of paper soaking.
The significant differences observed in this
comparison, in terms of both sensitivity and
variability, raise relevant discussion points regarding
the type of material that needs to be used to guarantee
low contact impedance and stable interface between
paper and electrode. Following several literature
evidence, the choice of the material was thus
addressed to nanomaterials and conductive polymers
(e.g. PEDOT:PSS) both well-known to improve
contact impedance issues traditionally emerging
when dealing with dry electrodes.
3.3 Ink Combinations Comparison
A significant increase in terms of sensitivity could be
obtained by relying on both CNT and PEDOT:PSS
coatings, with respect to bare silver electrodes, as it
can be observed from the comparison among the
measured curves reported in Figure 7. Examples of
measurements obtained during repeatability and
reproducibility tests are reported in Figures 8 and 9.
A summary of sensitivity and RSD in each single run
and the averaged values across different electrodes
(reproducibility test) and different repetitions of the
measurements on the same electrodes (repeatability
tests) can be summarized in Tables 3 and 4. Results
reported focus only on the range 0-50 μl to exclude
higher volume for which both CNTs and PEDOT:PSS
coated electrodes showed saturation.
Figure 7: Comparison among conductivity measurements
obtained combining long-thick-teeth pattern geometry with
three different combinations: silver, silver + CNTs, silver +
PEDOT:PSS.
BIODEVICES 2025 - 18th International Conference on Biomedical Electronics and Devices
70
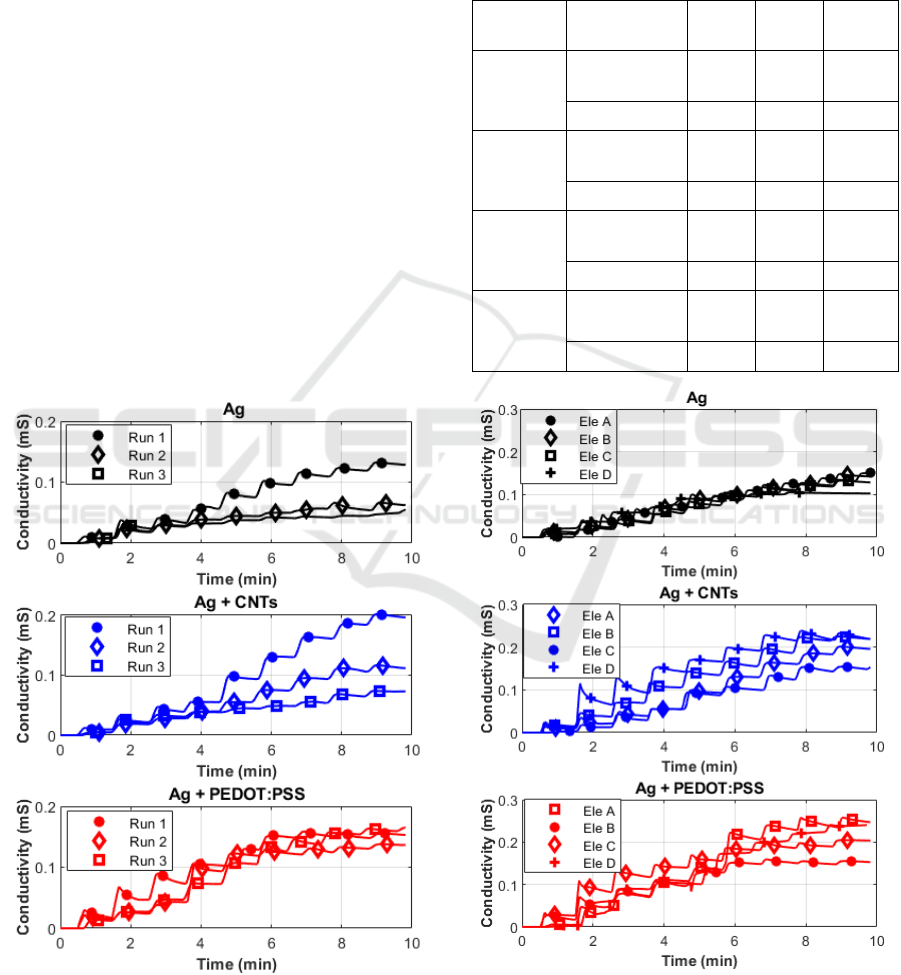
For all the conditions tested during the
repeatability test, measurements performed after the
first showed a decrease in sensitivity, consequent to
changes in the surface contact interface happening
after the first contact between PBS, paper, and
the conductive surface of the electrode. Electrodes
realized using silver coated with PEDOT:PSS
however showed a higher repeatability compared to
silver and silver coated with carbon nanotubes, with
an RSD ranging from 6 to 14 %. As a negative aspect,
as it can be observed from Figure 5, PEDOT:PSS
showed a smaller linearity range, with a saturation
after 50 μl. This result should be kept under
consideration especially if targeting applications with
high sweat rates; in this specific case, a solution might
be to employ a paper with a higher absorption
capacity to extend the linearity range of
measurements. Regarding the reproducibility test,
silver electrodes showed the best results, with RSD
lower than 10 %. The higher RSD obtained for coated
electrodes (<30% for CNTS and <22% for
PEDOT:PSS) can be explained by considering the
variability of the additional layer of ink deposited on
top of silver. Similarly to the measurements reported
for the repeatability test, even in Figure 6, it can be
Figure 8: Examples of repeatability tests on different ink
combinations: on each electrode couple the same
measurement was repeated three times.
appreciated that PEDOT:PSS performs better than the
other only in the range 0-50 μl, showing worse
reproducibility outside that range.
Table 3: Summary of the results from the repeatability test,
given as average sensitivities in μS/μl and RSD in %
obtained for each replicate of the electrodes (A, B, C, D) on
three repeated measurements on the same electrodes.
Electrodes
Metrological
characteristics
Ag
Ag +
CNTs
Ag +
PEDOT
ELE A
sensitivity
(μS/μl)
1.14 1.40 3.57
RSD % 56 41 6
ELE B
sensitivity
(μS/μl)
1.21 1.77 2.59
RSD % 53 67 9
ELE C
sensitivity
(μS/μl)
1.08 1.33 3.24
RSD % 54 58 5
ELE D
sensitivity
(μS/μl)
1.10 2.11 2.76
RSD % 53 74 14
Figure 9: Examples of reproducibility tests on different ink
combinations: the same measurement was performed on
four different replicates of electrode couples.
Sweat Quantification During Electrodermal Analysis Combining Paper-Based Microfluidics with Printable Electrodes: Design and Materials
71

Table 4: Summary of the results from the reproducibility
test, given as average sensitivities in μS/μl and RSD in %
obtained for each run on four different replicates of the
EDA conductive electrodes combined with microfluidic
path.
Run
Number
Metrological
characteristics
Ag
Ag +
CNTs
Ag +
PEDOT
RUN 1
sensitivity
(μS/μl)
1.82 2.80 3.07
RSD (%) 5 30 11
RUN 2
sensitivity
(μS/μl)
0.89 1.29 3.14
RSD (%) 8 25 16
RUN 3
sensitivity
(μS/μl)
0.68 0.87 2.91
RSD (%) 10 9 22
Overall, considering a trade-off among sensitivity,
repeatability, and reproducibility PEDOT:PSS appear
as the most suitable material to realize electrodes for
electrodermal activity combined with paper-based
microfluidics to monitor sweat volume. The
sensitivity obtained for PEDOT:PSS coated silver
electrodes, with an average of 3.07 μS/μl and an
average RSD of 15%, represents high promising
results if compared with the one obtained with
standard pre-gelled wet electrodes, with an average of
2.4 μS/μl and an average RSD of 20%.
4 CONCLUSIONS
This study focused on microfluidic pattern design and
electrode materials selection for EDA and sweat rate
monitoring and highlighted the need for performance
trade-offs. The thick-teeth geometry demonstrated
the most faithful structure for paper-based
microfluidics, certifying lower variability through
stable electrode contact. To reduce the gap between
wet and dry electrodes and surpass the limitations of
the dry electrode in terms of sensitivity and
consistency PEDOT:PSS electrodes provided better
results than the other studied materials since it
displayed superior sensitivity and repeatability within
the 0-50 µl range while preserving low-contact
impedance and trustworthy signals. Future works
may concentrate on the evaluation of different
printing techniques to realize the overall device and
on the enhancement of absorption volume to increase
linearity and establish powerful performance across a
wide range of various conditions (e.g. volume and
rate ranges).
ACKNOWLEDGEMENTS
This study was carried out within the MICS (Made in
Italy – Circular and Sustainable) Extended
Partnership and received funding from Next-
GenerationEU (Italian PNRR – M4 C2, Invest 1.3 –
D.D. 1551.11-10-2022, PE00000004 CUP
D73C22001250001).
REFERENCES
Arantes, I. V. S., & Paixão, T. R. L. C. (2022). Couple
batch-injection analysis and microfluidic paper-based
analytical device: A simple and disposable alternative
to conventional BIA apparatus. Talanta, 240, 123201.
doi:10.1016/j.talanta.2021.123201
Chung, H. U., Kim, B. H., Lee, J. Y., Lee, J., Xie, Z., Ibler,
E. M., … Rogers, J. A. (2019). Binodal, wireless
epidermal electronic systems with in-sensor analytics
for neonatal intensive care. Science, 363(6430).
doi:10.1126/science.aau0780
Cui, C.-Y., & Schlessinger, D. (2006). EDA Signaling and
Skin Appendage Development. Cell Cycle, 5(21),
2477–2483. doi:10.4161/cc.5.21.3403
Iqbal, S. M. A., Mahgoub, I., Du, E., Leavitt, M. A., &
Asghar, W. (2021). Advances in healthcare wearable
devices. Npj Flexible Electronics, 5(1), 9.
doi:10.1038/s41528-021-00107-x
Kappeler-Setz, C., Gravenhorst, F., Schumm, J., Arnrich,
B., & Tröster, G. (2013). Towards long term monitoring
of electrodermal activity in daily life. Personal and
Ubiquitous Computing, 17(2), 261–271.
doi:10.1007/s00779-011-0463-4
Kuo, W.-C., Wu, T.-C., & Wang, J.-S. (2022). Design and
Application of a Flexible Blood Oxygen Sensing Array
for Wearable Devices. Micromachines, 13(10), 1742.
doi:10.3390/mi13101742
Lai, Y.-H., Lim, J.-C., Lee, Y.-C., & Huang, J.-J. (2021).
Analysis of the Biochemical Reaction Status by Real-
Time Monitoring Molecular Diffusion Behaviors Using
a Transistor Biosensor Integrated with a Microfluidic
Channel. ACS Omega, 6(18), 11911–11917.
doi:10.1021/acsomega.1c00222
Pang, C., Lee, C., & Suh, K. (2013). Recent advances in
flexible sensors for wearable and implantable devices.
Journal of Applied Polymer Science, 130(3), 1429–
1441. doi:10.1002/app.39461
Posada-Quintero, H. F., & Chon, K. H. (2020). Innovations
in Electrodermal Activity Data Collection and Signal
Processing: A Systematic Review. Sensors, 20(2), 479.
doi:10.3390/s20020479
Silva-Neto, H. A., Arantes, I. V. S., Ferreira, A. L., do
Nascimento, G. H. M., Meloni, G. N., de Araujo, W. R.,
… Coltro, W. K. T. (2023). Recent advances on paper-
based microfluidic devices for bioanalysis. TrAC
Trends in Analytical Chemistry, 158, 116893.
doi:10.1016/j.trac.2022.116893
BIODEVICES 2025 - 18th International Conference on Biomedical Electronics and Devices
72

Stanković, I., Adamec, I., Kostić, V., & Habek, M. (2021).
Autonomic nervous system—Anatomy, physiology,
biochemistry (pp. 1–17). doi:10.1016/bs.irmvd.2021
.07.006
Ullah, H., Shoaib, F., Zahid, S. D., Mahmood, M. I., Ali,
M., Ali, M., … Jafry, A. T. (2023). Design and
Fabrication of Digital Microfluidics device for Lab-on-
a-Chip Applications. In ICAME 2023 (p. 7). Basel
Switzerland: MDPI. doi:10.3390/engproc2023045007
W. Boucsein. (2012). Electrodermal Activity.
USA:Springer,.
Zheng, Y.-L., Ding, X.-R., Poon, C. C. Y., Lo, B. P. L.,
Zhang, H., Zhou, X.-L., … Zhang, Y.-T. (2014).
Unobtrusive Sensing and Wearable Devices for Health
Informatics. IEEE Transactions on Biomedical
Engineering, 61(5), 1538–1554. doi:10.1109/TBME.20
14.2309951
Sweat Quantification During Electrodermal Analysis Combining Paper-Based Microfluidics with Printable Electrodes: Design and Materials
73
