
Optimized Scheduling for Electric Vehicle Charging: A Multi-Objective
Approach to Grid Stability and User Satisfaction
Aimen Khiar
1,2 a
, Mohamed-el-Amine Brahmia
1 b
, Ammar Oulamara
3 c
and Lhassane Idoumghar
2 d
1
CESI Lineact UR 7527, Strasbourg, France
2
IRIMAS UR 7499, University of Haute-Alsace, Mulhouse, France
3
LORIA UMR 7503, University of Lorraine, Nancy, France
Keywords:
Electric Vehicle, Charging Station Allocation, Multi-Objective Optimization, Scheduling, Metaheuristics,
NSGA-II, MOCS.
Abstract:
The transition to electric mobility offers substantial environmental benefits but also introduces significant chal-
lenges, particularly in managing the high demand for electric vehicle (EV) charging. This demand creates the
need for intelligent scheduling to optimize charging station resources and maintain grid stability. In order to
address this purpose, we propose a multi-objective scheduling model designed to both minimize peak energy
consumption and maximize user satisfaction by reducing waiting times at charging stations. Our model ac-
curately represents real-world scenarios, including sequential charger usage, vehicle-to-charger compatibility,
and limited availability of various charger types, each providing a constant power output. Given the complex-
ity of the problem, we adapt and evaluate two metaheuristic algorithms: the Non-Dominated Sorting Genetic
Algorithm-II (NSGA-II) and the Multi-Objective Cuckoo Search (MOCS), to approximate optimal solutions.
The results show that the proposed MOCS adaptation surpasses that of NSGA-II in terms of dominance and
achieving a well-distributed Pareto front approximation in a reasonable time frame. The proposed approach
thus provides a powerful framework for efficient EV charging management, balancing user needs with grid
stability and highlighting its strong potential for adoption in large-scale charging infrastructures.
1 INTRODUCTION
As global environmental concerns intensify due to
factors like air pollution and climate change, Electric
vehicles (EVs) have emerged as a promising alterna-
tive to combustion engine vehicles, as they signifi-
cantly reduce a major part of our environmental im-
pact (Electric Power Research Institute, 2023). This
shift has led to a substantial rise in the number of EVs
on the market. For instance, the International Energy
Agency (IEA) predicts that EV sales will reach ap-
proximately 17 million units by 2024 (International
Energy Agency (IEA), 2024).
However, while EVs show great promise, the main
obstacle to their widespread adoption is the long time
required to fully charge their battery. This delay re-
a
https://orcid.org/0009-0002-2724-223X
b
https://orcid.org/0000-0003-0114-210X
c
https://orcid.org/0000-0003-2357-0404
d
https://orcid.org/0000-0001-8853-3968
sults in several challenges, including electrical grid
overload, fluctuations in electricity prices, and re-
duced customer satisfaction. To address these chal-
lenges, smart charging systems, also known as coordi-
nated charging, have become critically important. Co-
ordinated charging refers to finding optimal plans for
charging vehicles in a way that maximizes resource
efficiency, where schedules are generated by a control
system, also known as an aggregator. In contrast, un-
coordinated charging occurs when clients use charg-
ers freely without controlled energy distribution. This
is known as the Electric Vehicle Charging Schedul-
ing Problem (EVCSP), which involves minimizing
(or maximizing) one or more objectives while respect-
ing imposed constraints.
The literature on this topic is considerably rich,
with numerous studies conducted on the problem. For
example, (Khiar et al., 2025) proposed a multiobjec-
tive optimization approach for grid stability, by mini-
mizing the grid overload and maximizing the deliv-
ered energy to clients and proposed a MOCS vari-
146
Khiar, A., Brahmia, M.-E.-A., Oulamara, A. and Idoumghar, L.
Optimized Scheduling for Electric Vehicle Charging: A Multi-Objective Approach to Grid Stability and User Satisfaction.
DOI: 10.5220/0013236400003893
In Proceedings of the 14th International Conference on Operations Research and Enterprise Systems (ICORES 2025), pages 146-155
ISBN: 978-989-758-732-0; ISSN: 2184-4372
Copyright © 2025 by Paper published under CC license (CC BY-NC-ND 4.0)

ant to approximate the optimal Pareto front. (Ren
et al., 2024) proposed an Adaptive Robust Optimiza-
tion model to address the uncertainty in EV charging
demands, focusing on minimizing grid overload. Inte-
ger programming techniques were employed by (Zhu
et al., 2014) and (An et al., 2023) to minimize the final
charging time of vehicles. (Zaidi et al., 2024) devel-
oped a Mixed-Integer Linear Programming model to
minimize electric grid capacity and used a hybrid it-
erative local search metaheuristic to approximate the
optimal schedule. Additionally, (Mishra et al., 2023)
introduced a multi-objective optimization framework
for EV charge scheduling, aiming to maximize profit
and customer satisfaction by utilizing a Satisfiabil-
ity Modulo Theory solver for optimal solutions and
the NSGA-II Algorithm to approximate the Pareto
front. (Liu et al., 2019) improved a multi-objective
self-adaptive differential evolution algorithm and ap-
plied it to optimize the fueling of hybrid EVs, aim-
ing to minimize fuel consumption and emission load.
(Chen et al., 2023) developed a multi-objective opti-
mization scheduling model aimed at minimizing dis-
tribution network operating costs, reducing net load
variance, and maximizing the photovoltaic consump-
tion rate. They proposed an extension of the NSGA-
II Algorithm called NSGA-II-NDAX to approximate
the Pareto front.
This paper proposes a multi-objective scheduling
model for EV charging where interruptions are not al-
lowed during the charging process, aiming to mini-
mize grid capacity usage and client service times un-
der realistic scheduling conditions. The structure of
this paper is as follows: In section 2, we describe
the problem under study, while section 3 develops the
mathematical formulation of our model. Section 4 de-
scribes the metaheuristic techniques employed to ap-
proximate the Pareto front. In section 5, we provide
numerical experiments to compare the performance
of the proposed methods, and finally, section 6 con-
cludes the paper.
2 PROBLEM DESCRIPTION
In smart charging systems for EVs, aggregators or
control systems play an important role in optimizing
charging within the broader energy grid. These sys-
tems act as intermediaries between resources and EV
owners, gathering data such as energy requirements
(in kilowatt-hours, kWh) and expected arrival times.
Aggregators use this information to design optimal
charging schedules for each vehicle and to commu-
nicate charging or discharging instructions to the con-
nected chargers.
In this study, we address the EVCSP using a bi-
criteria optimization approach. Our aim is to schedule
EV charging requests in a way that balances two key
objectives:
1. Minimizing service times enhances customer
satisfaction, fosters customer loyalty, and unlocks
new business opportunities.
2. Preventing grid overload through efficient re-
source utilization and energy distribution by min-
imizing instantaneous energy demand, commonly
referred to as grid capacity.
We consider a charging infrastructure consisting
of a limited number of chargers, each delivering a
constant power output and becoming available at pre-
defined times. Charging durations are assumed to be
linear and deterministic. The goal is to determine a
feasible assignment of vehicles to chargers, while ac-
counting for compatibility factors such as port com-
patibility, charging speed, and power delivery proto-
cols.
Recall that in multi-objective optimization, a so-
lution is said to dominate another if it performs bet-
ter in at least one objective while being no worse in
all others. A solution is considered Pareto optimal
if no objective can be improved without degrading
at least one other objective. In other words, a solu-
tion is Pareto optimal if it is not dominated by any
other solution. The set of all such solutions forms the
Pareto front, representing the best possible trade-offs
between competing objectives. It is important to note
that the objectives at hand are conflicting, that is, min-
imizing one tends to maximize the other. Therefore,
the optimization model seeks to find the Pareto front.
For illustration purposes, figure 1 shows a feasi-
ble schedule for charging 30 vehicles on 7 chargers.
The x-axis represents time, and the y-axis represents
chargers with the power they deliver. The blue lines
represent the chargers’ availability, and at the bottom
of the schedule, we indicate for each vehicle the ex-
pected arrival and the required energy expressed in
kWh.
Summarizing, each client provides the aggregator
with their expected arrival time and required energy.
Using this information, along with data on chargers,
the aggregator creates balanced charging schedules.
Each schedule specifies the charging start time for
each vehicle, and energy transmission continues unin-
terrupted until the required energy is fully delivered.
Once a vehicle completes its charging session, its
charger becomes available for another use. The next
section presents our proposed mathematical model.
Optimized Scheduling for Electric Vehicle Charging: A Multi-Objective Approach to Grid Stability and User Satisfaction
147

Figure 1: Example of a Schedule of 30 Vehicles on 7 Chargers.
3 MATHEMATICAL MODELING
The scheduling problem under study is defined on
a discrete time horizon, subdivided into equal time
units of length τ (in hours). We shall model this
latter using the set of strictly positive integers N
∗
=
{
1,2,3,....
}
.
It is important to note that small values of τ make
the scheduling operation more flexible since they of-
fer more options for the model in ordering the vehi-
cles, and as τ becomes small, we approach continuous
time scheduling.
An instance of the problem under study is charac-
terized by a set of n charging requests. The charging
operations of a vehicles are characterized by two main
parameters, namely the expected arrival time a
(v)
i
and
required energy amount e
i
, expressed in kWh. The
charging infrastructure comprises m chargers. The j
th
charger provides a constant power of w
j
and being
available at time a
(c)
i
. The assignability of a vehicle
i to charger j as described in the preceding section is
represented by binary constants δ
i, j
, where δ
i, j
= 1 if
the i
th
vehicle is assignable to the j
th
charger, and 0
otherwise. Without loss of generality, we suppose that
each vehicle is assignable to at least one charger, i.e
∀i ∈
{
1,2, ·· · ,n
}
:
m
∑
j=1
δ
i, j
≥ 1
Given the discrete scheduling horizon and under
the linear deterministic charging time assumption, if
vehicle i is assigned to charger j, it must deliver
power for at least
e
i
w
j
hours to meet the required en-
ergy. Consequently, the number of time units re-
quired to serve vehicle i by charger j is given by
p
i, j
=
l
e
i
τw
j
m
, where
⌈
..
⌉
denotes the ceiling function.
These energy units are delivered consecutively. Re-
ferring back to figure 1, red dots represent these en-
ergy units.
We define the decision variables t
(s)
i
for all
i ∈
{
1,2, ·· · ,n
}
representing the charging beginning
time of vehicle i. We also define the binary de-
cision variables y
i, j
for all (i, j) ∈
{
1,2, ·· · ,n
}
×
{
1,2, ·· · ,m
}
that takes 1 if and only if vehicle i is
assigned to charger j. Each vehicle must be plugged
into a compatible charger, giving the constraints
∀i ∈
{
1,2, ·· · ,n
}
:
m
∑
j=1
y
i, j
= 1 (1)
and
∀(i, j) ∈
{
1,2, ·· · ,n
}
×
{
1,2, ·· · ,m
}
: y
i, j
≤ δ
i, j
(2)
The final charging time of vehicle i denoted as t
(e)
i
is expressed by
t
(e)
i
= t
(s)
i
+
m
∑
j=1
p
i, j
y
i, j
− 1
Thus, the number of vehicles that use charger j at
time t is given by
∑
n
i=1
y
i, j
1
T
i
(t), where 1
A
represents
the indicator function of the set A. If two vehicles are
assigned to the same charger, then their usage periods
of the charger cannot overlap; this is explained by the
constraints
∀( j,t) ∈
{
1,2, ·· · ,m
}
× N
∗
:
n
∑
i=1
y
i, j
1
T
i
(t) ≤ 1 (3)
where T
i
=
n
t
(s)
i
,t
(s)
i
+ 1,··· ,t
(e)
i
o
denotes the
charging period of vehicle i.
Additionally, the charging of vehicle i must be-
gin after the vehicle’s arrival date, which means t
(s)
i
≥
a
(v)
i
. Moreover, it cannot begin charging before the
ICORES 2025 - 14th International Conference on Operations Research and Enterprise Systems
148

assigned charger becomes available, that is, t
(s)
i
≥
∑
m
j=1
a
(c)
j
y
i, j
. This gives us the constraints
∀i ∈
{
1,2, ·· · ,n
}
: t
(s)
i
≥ max
a
(v)
i
,
m
∑
j=1
a
(c)
j
y
i, j
!
(4)
Denote by w
G
the maximum instantaneous en-
ergy consumption during the entire schedule, which
is the grid capacity that we aim to minimize and rep-
resents the first objective function. The power con-
sumed at time slot t by all vehicles is expressed by
∑
m
j=1
∑
n
i=1
w
j
y
i, j
1
T
i
(t). Thus,
w
G
= max
t∈N
∗
m
∑
j=1
n
∑
i=1
w
j
y
i, j
1
T
i
(t)
!
(5)
The second objective is simply the sum of the
charging end times of the vehicles, which is given by
t
(e)
=
n
∑
i=1
t
(e)
i
(6)
The multi-objective optimization problem is to
minimize the objective functions (5) and (6) subject
to the constraints (1), (2), (3) and (4).
An important consideration is the time complex-
ity of the optimization process. By formulating a de-
cision version of the optimization problem, one can
show that identifying a feasible solution to this deci-
sion problem is strongly NP-Hard, even in the case of
identical chargers, via a reduction to the bin-packing
problem. Given this computational challenge, we are
motivated to explore approximation techniques, such
as nature-inspired metaheuristics, to approximate the
Pareto front within a reasonable time frame. The next
section will outline the specific adopted solving meth-
ods.
4 SOLVING METHODS
An adaptation of metaheuristics to combinatorial op-
timization problems, which are initially designed for
real-valued function optimization, involves defining
the algorithmic structure of a feasible solution and the
operators needed to explore the feasibility space ac-
cording to the chosen algorithm. This section presents
the solving methods considered for our optimization
problem.
Given that we are dealing with a bi-objective con-
strained optimization problem, the NSGA-II algo-
rithm, proposed in (Deb et al., 2002), appears to be
a suitable candidate approach. We also consider an
adaptation of the MOCS algorithm proposed in (Yang
and Deb, 2013) and compare both metaheuristics in
the next section.
4.1 Non-Dominated Sorting Genetic
Algorithm II
Genetic algorithms (GA) are metaheuristics inspired
by the process of natural selection and are part of
the larger class of evolutionary algorithms, first estab-
lished by Holland’s seminal work, (Holland, 1992).
These algorithms address optimization problems by
iteratively evolving a population of solutions using
three main operators: selection, crossover, and mu-
tation. The process starts with a random population
and iteratively:
1. Selects promising individuals
2. Creates offspring through crossover and mutation
3. Updates the population based on fitness
This cycle continues until meeting specified stop-
ping criteria.
In the realm of multi-objective optimization, (Deb
et al., 2002) introduced the NSGA-II algorithm, a sig-
nificant advancement in the field of evolutionary op-
timization algorithms. NSGA-II has gained popular-
ity as one of the most widely applied nature-inspired
metaheuristics for solving multi-objective problems.
The core mechanism of NSGA-II revolves around
the principle of Pareto dominance, which serves as a
fundamental comparison criterion between different
solutions. Non-dominated sorting is a key process in
this algorithm, where solutions are classified based on
their dominance relationships. The objective is to cat-
egorize solutions into distinct ”fronts” according to
their level of dominance. The first front is composed
of all non-dominated solutions, representing the opti-
mal trade-offs among the multiple objectives. Subse-
quent fronts are formed by identifying solutions that
are dominated only by those in the preceding fronts,
thus creating a hierarchy of solutions that reflects their
relative quality.
In addition to non-dominated sorting, NSGA-II
incorporates a mechanism known as crowding dis-
tance. This measure quantifies the proximity of an in-
dividual solution to its neighbors within the objective
space. Solutions with higher crowding distance val-
ues are considered superior because they contribute
to a diverse set of solutions, which is important for
exploring the solution space effectively. By promot-
ing diversity, NSGA-II encourages the search pro-
cess to identify a well-distributed approximation of
the Pareto front.
The algorithm begins with an initial parent pop-
ulation consisting of pop
size
solutions. In each itera-
tion, an offspring population of the same size is gener-
ated from the parent population through the use of se-
lection, crossover, and mutation operators. After the
Optimized Scheduling for Electric Vehicle Charging: A Multi-Objective Approach to Grid Stability and User Satisfaction
149
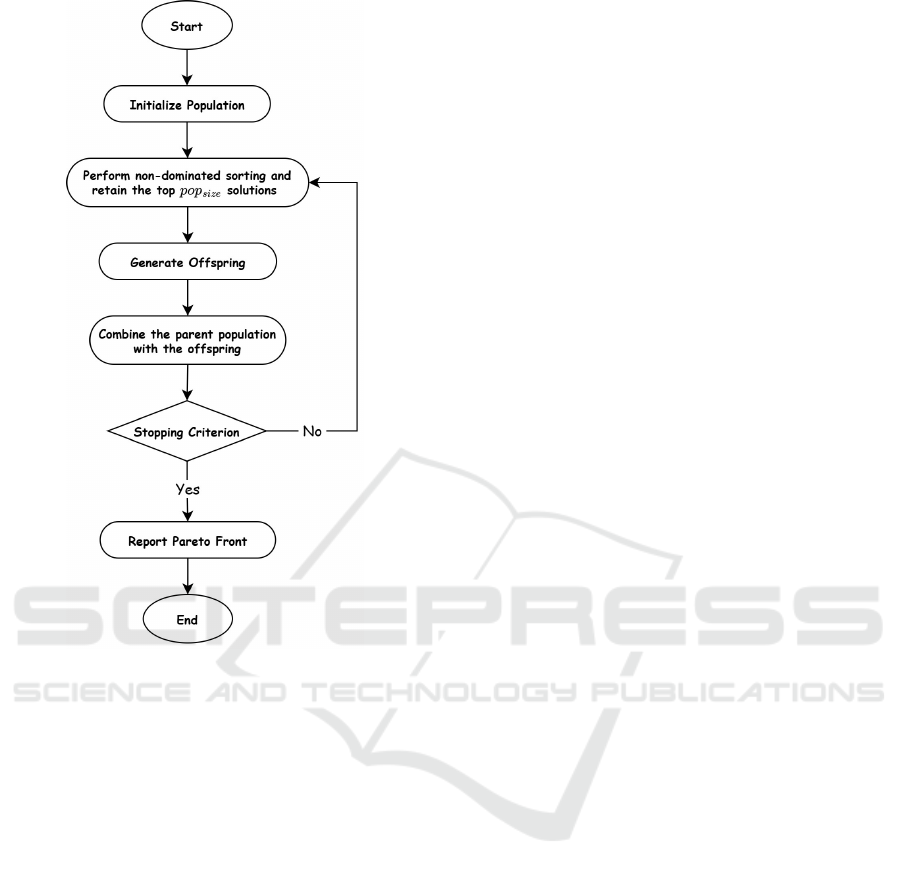
Figure 2: Flowchart of NSGA-II Algorithm.
crossover operation, mutation is applied to each off-
spring with a probability pm
1
∈ (0,1). Subsequently,
the parent and offspring populations are combined,
followed by the application of non-dominated sorting.
The top pop
size
solutions from this combined popula-
tion are then selected based on their dominance levels
to form the next parent population. The flowchart il-
lustrating the algorithm’s process is presented in fig-
ure 2.
For a more comprehensive overview of the algo-
rithm and the underlying concepts, we refer the reader
to (Deb et al., 2002).
4.2 Multi-Objective Cuckoo Search
Algorithm
The cuckoo search algorithm is a nature-inspired
metaheuristic, developed by (Yang and Deb, 2009)
for mono-objective optimization. It is inspired by the
breeding behavior of a type of bird called cuckoos,
which lay their eggs in the nests of other birds. These
cuckoos search for nests of host birds that have eggs
similar to cuckoo eggs, maximizing the chance that
their eggs are not discovered by the host bird. Each
egg in a nest represents a solution, and a cuckoo egg
represents a new solution. The aim is to use these
new and potentially better solutions (cuckoos) to re-
place suboptimal solutions in the nests, resulting in a
better population of eggs that can survive over more
generations. The main assumptions of the algorithm
are:
1. Each cuckoo lays one egg at a time and drops it in
a randomly chosen nest.
2. The best nests with high-quality eggs will carry
over to the next generations.
3. The number of available host nests is fixed.
4. The egg laid by a cuckoo is discovered by the host
bird with a probability p
a
∈ (0, 1). In this case, the
host bird can either throw the egg away or aban-
don the nest and build a completely new nest.
Later, they proposed a generalization of the algo-
rithm to tackle multi-objective optimization problems
in (Yang and Deb, 2013), where the first and last as-
sumptions are modified respectively as follows:
1. Each cuckoo lays K eggs at a time and drops its
eggs in randomly chosen nests.
2. Newly generated nests contain K eggs, represent-
ing the new solutions.
Here, K represents the number of objective func-
tions (in our case, K = 2). For simplicity, the last
assumption of the algorithm can be approximated by
replacing a fraction p
a
of the n nests with new nests
(i.e., new random solutions).
Additionally, various studies have shown that the
flight behavior of many animals and insects exhibits
characteristics of L
´
evy flights, which are random
walks governed by the L
´
evy distribution. Yang and
Deb incorporated these L
´
evy flights to generate new
solutions (cuckoo eggs) in their continuous optimiza-
tion algorithm. For a more comprehensive overview
of these algorithms and the underlying concepts, we
refer the reader to (Yang and Deb, 2009) and (Yang
and Deb, 2013).
Since L
´
evy flights are suitable only for continu-
ous domain optimization, we adapted the algorithm
for combinatorial optimization by defining a special-
ized operator to find new solutions. The algorithm’s
flowchart is illustrated in figure 3.
4.3 Generating a Random Feasible
Schedule
Each feasible schedule for our optimization model is
represented by a n × 3 matrix, where each row i con-
tains respectively: the assigned charger for vehicle i,
ICORES 2025 - 14th International Conference on Operations Research and Enterprise Systems
150
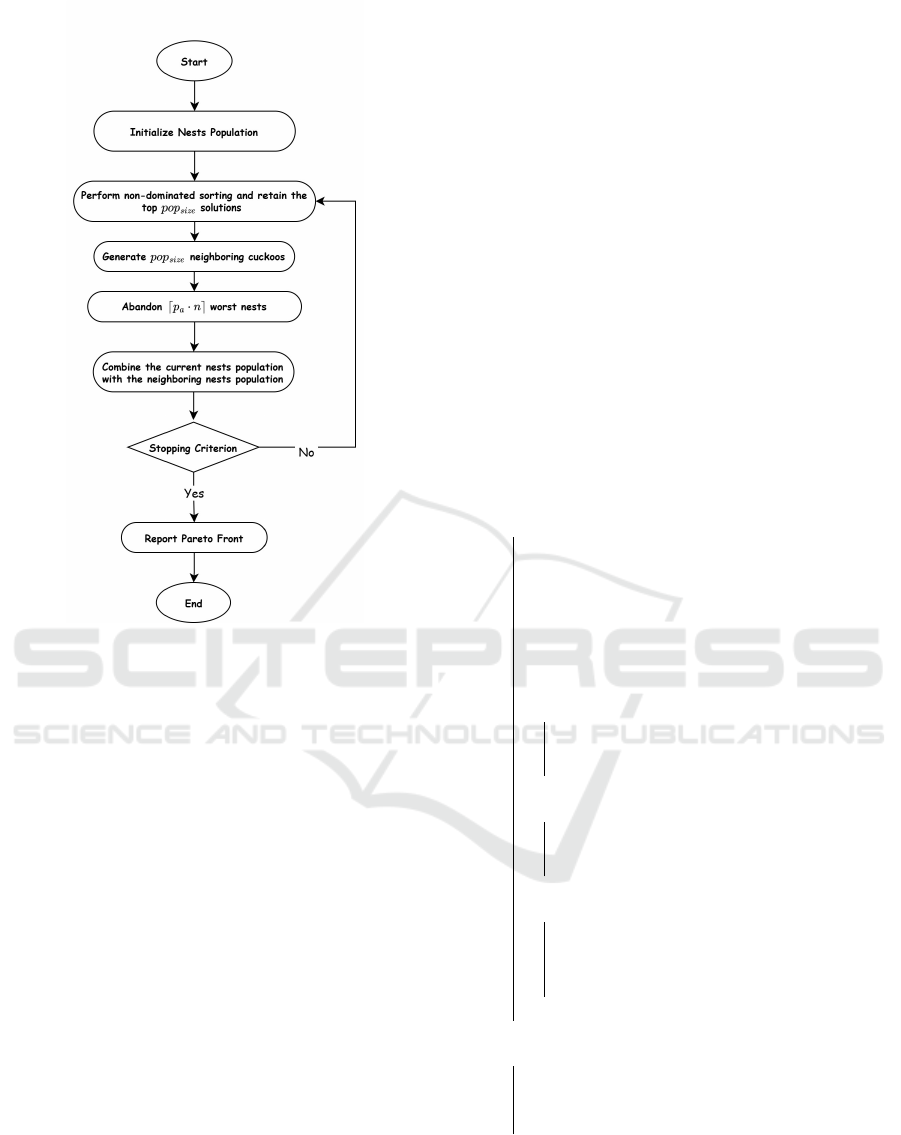
Figure 3: Flowchart of MOCS Algorithm.
the charging start time t
(s)
i
, and the charging end time
t
(e)
i
. Although t
(e)
i
can be derived from the first two
elements, it is included separately to optimize calcu-
lations.
Generating a random feasible schedule can be
achieved by repeatedly selecting a vehicle, a compat-
ible charger, and a possible charging period at ran-
dom until all vehicles are scheduled. Suppose that
we need to schedule vehicle i on charger j. Assume
that there is at least one vehicle already scheduled on
charger j, and let n
j
≥ 1 represent the number of ve-
hicles already scheduled to charge on that charger, or-
dered according to their charging order as i
1
,i
2
,...,i
n
j
.
Then, there are at most n
j
+ 1 possible charging ses-
sions denoted S
k
for k ∈
1,2, ·· · ,n
j
+ 1
, for vehi-
cle i on that charger. A ”charging session” refers to a
time frame during which the charger is being free, and
charging start time for vehicle i can be chosen which
determines its charging period. The possible charging
sessions can be one of the three cases
1. Session S
1
: between t
i
0
= max
a
(c)
j
,a
(v)
i
and the
charging start time of vehicle i
1
,i.e
S
1
:=
n
t
i
0
,t
i
0
+ 1,··· ,t
(s)
i
1
− 1
o
.
2. Session S
k
for k ∈
2,3, ·· · ,n
j
: between the
charging periods of vehicle i
k−1
and i
k
,i.e
S
k
:=
n
t
(e)
i
k−1
+ 1,t
(e)
i
k−1
+ 2,··· ,t
(s)
i
k
− 1
o
.
3. Session S
n
j
+1
: after the charging period of the last
vehicle, i.e
S
n
j
+1
:=
n
t
(e)
i
n
j
+ 1,t
(e)
i
n
j
+ 2,···
o
.
Now, if n
j
= 0 (i.e., no vehicle is scheduled to
charge on charger j), there is only one candidate
charging session, namely
{
t
i
0
,t
i
0
+ 1,···
}
. With this
in mind, the scheduling of vehicle i on charger j is
performed using algorithm 1.
Data: A schedule, a vehicle i ∈ {1,2, ... ,n}, a
compatible charger j ∈ {1, 2,.. .,m}, and
a positive number σ
Result: Start charging time t
(s)
i
of vehicle i on
charger j
1. Calculate n
j
;
if n
j
> 0 then
a. Set the list of candidate charging sessions
as:
H := {n
j
+ 1} ∪ {k ∈ {1,2,.. .,n
j
} |
|S
k
| ≥ p
i, j
};
b. Choose a random index k uniformly from
H;
if k = 1 then
Choose t
(s)
i
uniformly from the range
{t
i
0
,t
i
0
+ 1,. ..,t
(s)
i
1
− p
i, j
};
end
else if k ∈ {2, 3,.. .,n
j
} then
Choose t
(s)
i
uniformly from the range
{t
(e)
i
k−1
+ 1,t
(e)
i
k−1
+ 2,. ..,t
(s)
i
k
− p
i, j
};
end
else
a. Generate a random number λ from
the normal distribution N (0, σ
2
);
b. Set t
(s)
i
= t
(e)
i
n
j
+ ⌈|λ|⌉ + 1;
end
end
else
a. Generate a random number λ from the
normal distribution N (0, σ
2
);
b. Set t
(s)
i
= t
i
0
+ ⌈|λ|⌉;
end
return t
(s)
i
;
Algorithm 1: Schedule a Vehicle on a Charger.
Notice that if n
j
> 0 and the last session (i.e.,
S
n
j
+1
) is chosen, which contains an infinite number of
Optimized Scheduling for Electric Vehicle Charging: A Multi-Objective Approach to Grid Stability and User Satisfaction
151

choices for t
(s)
i
, then we set t
(s)
i
:= t
(e)
i
n
j
+
⌈|
λ
|⌉
+ 1. If
n
j
= 0, then the unique charging session is also theo-
retically infinite, and we set t
(s)
i
:= t
i
0
+
⌈|
λ
|⌉
, where λ
is drawn from N
0,σ
2
. Here, as the standard devia-
tion σ increases, the probability of t
(s)
i
being large also
increases, which encourages schedules that are less
favorable to the second objective function (6), thereby
improving the exploration of the search space.
4.4 Selection Operator
We define the selection operator which is the mecha-
nism that chooses individuals from the population for
reproduction phase based on their ranks and crowding
distances. Given a population where non-dominated
sorting algorithm is already applied, we calculate
crowding distances for each solution. We rank each
solution by the order of the front they belong to, so-
lutions with rank 1 are the non-dominated solutions,
hence the smaller the rank, the better the solution is.
Next, we select randomly without replacement
two schedules from 1 to N =
pop
size
4
with probabil-
ity p
k
=
2(N−k+1)
N(N+1)
for k ∈
{
1,2, ·· · ,N
}
, where pop
size
is the population size. We then retain the schedule
with smaller rank. If both individuals belong to the
same rank, the individual with the greater crowding
distance is preferred; if their crowding distances are
equal, one of the individuals is selected arbitrarily.
4.5 Crossover Operator
Given two selected parent solutions saying S
1
and S
2
,
the crossover operator is done as follows
1. Construct the set of vehicles in schedule S
1
where
their assigned charger is free for use in schedule
S
2
on the same charging period in S
1
, denote this
set as M .
2. Create a new schedule S
′
2
by choosing randomly
without replacement
M
/3 vehicles from the set
M and copy their charging plan from S
1
to S
2
.
3. Apply steps 1 and 2 where now you interchange
the order of S
1
and S
2
and derive a schedule S
′
1
Steps 1 and 2 ensure that when exchanging ve-
hicles between schedules S
1
and S
2
, we do not get
overlapping charging periods while combining the in-
formation contained in each schedules.
4.6 Mutation Operator
Notice that the crossover operator maintain the same
charger for a vehicle if it is exchanged between two
schedules, hence to be sure that any feasible sched-
ule could be found by the algorithm, given a sched-
ule, we defined the mutation operator to select ran-
domly
⌈
pm
2
∗ pop
size
⌉
vehicles and than change their
charger randomly using algorithm 1, where pm
2
∈
(0,1) .
4.7 Finding a Neighbor Solution
Operator (for MOCS)
For a feasible schedule, the neighbor solution oper-
ator used in the MOCS algorithm is defined by ran-
domly selecting
⌈
p
c
∗ n
⌉
vehicles and a compatible
charger for each vehicle (which can be the current
one), and scheduling the vehicle to charge on it us-
ing algorithm 1, where p
c
∈ (0, 1). Large values of p
c
tend to perturb more the schedule at hand, which we
also observed through experiments; thus, one needs
to carefully choose this latter to enhance the quality
of the exploitation of the search space.
5 EMPIRICAL EXPERIMENTS
In this section, we present numerical experiments to
compare the proposed approaches. The experiments
were carried out on a computer featuring an Intel®
Core™ i5-8350U CPU running at 1.70 GHz (with a
turbo boost of up to 1.90 GHz) and equipped with
8.00 GB of RAM.
We considered instances of varying sizes, specifi-
cally 50,100,150 and 200 charging requests. For each
instance size, five random instances were generated,
ordered from 1 to 20. The instances were created with
the following parameters:
• The time slots length τ was set to 10 minutes.
• Vehicle arrivals were selected randomly start-
ing from 00 : 00, and the required energy of
each vehicle was sampled randomly from the set
{
20,30, 40,...,300
}
.
• The number of available chargers was set to m =
n
4
, and the delivered energy was chosen ran-
domly from the set
{
10,20, 30,40, 50
}
. Availabil-
ity times were selected randomly starting from
00 : 00.
• For experimentation purposes, we assumed that
vehicles are assignable to all chargers, i.e: δ
i, j
=
1 for all (i, j) ∈
{
1,2, ·· · ,n
}
×
{
1,2, ·· · ,m
}
.
The parameters of NSGA-II and MOCS were cho-
sen based on preliminary experimentation. We com-
pared each algorithm with itself by running it several
times on different instances of varying sizes, and we
ICORES 2025 - 14th International Conference on Operations Research and Enterprise Systems
152

Figure 4: Mean Percentage of Dominance Comparison.
selected the parameters that seemed to yield the best
results in terms of balancing a highly dominant ap-
proximation of the Pareto front with a well-distributed
spread of the best solutions.
For both algorithms, we used 300 generations per
instance with a population size of 200 schedules,
which proved sufficient to achieve significant conver-
gence for the instance sizes considered. As previ-
ously mentioned, higher values of the parameter σ
tend to increase service times, a trend we observed
throughout our experiments. Setting σ to 1 yielded
satisfactory results for both algorithms, likely because
smaller steps improved exploitation quality. Thus,
we used σ = 1 in our experiments. For NSGA-II,
we set the mutation probability pm
1
= 0.2 and the
proportion pm
2
= 0.05 for vehicle charger changes,
as higher values for pm
2
tend to excessively pertur-
bate the schedule at hand, an effect also observed ex-
perimentally. For MOCS, we found a proportion of
abandoned nests p
a
= 0.25 to work well across dif-
ferent instance sizes, with the proportion p
c
= 0.05
for changes in vehicle charging sessions.
In order to compare between NSGA-II and
MOCS, we calculated the mean percentage of dom-
inance between both methods for each instance. The
dominance percentage of NSGA-II over MOCS, for
example, is defined as the number of solutions on
the approximated Pareto front found by MOCS that
are dominated by NSGA-II, divided by the total num-
ber of non-dominated solutions found by MOCS, and
then multiplied by 100.
If we focus on the solutions within the section
of the Pareto front approximation found by the first
method that lies close to the approximation from the
second method and vice versa the mean dominance
percentage can serve as an indicator of solution qual-
ity. Moreover, if we consider the opposite sense, an
important metric to consider is the percentage of non-
dominance. This percentage represents the portion
of solutions on the Pareto front found by the first
method that remain non-dominated by any solution
from the second method. This metric can be inter-
preted as a measure of how well the first method ex-
Figure 5: Mean Execution Time Comparison.
plores the true Pareto front: a higher non-dominated
percentage indicates better performance compared to
the second method, as it signifies that the first method
is finding unique trade-offs not matched by the sec-
ond method. The percentage of non-dominance of
Method 1 against Method 2 is calculated as 100 mi-
nus the percentage of dominance of Method 2 against
Method 1. A lower dominance percentage of Method
1 compared to Method 2 indicates better performance
of the first method relative to the second.
Another important metric for comparing opti-
mization algorithms is execution time. We present in
table 1 the mean dominance percentage and the mean
execution time, calculated over the 50 runs, with the
standard deviation in parentheses. The results are il-
lustrated in figure 4 and figure 5, respectively, with
the shaded area representing confidence intervals.
Table 1: Numerical Results for Mean Percentage of Domi-
nance and Execution Time.
Mean percentage of dominance Mean execution time
Instances NSGA-II |MOCS MOCS |NSGA-II NSGA-II MOCS
1 3.62 (5.85) 95.6 (6.62) 1.68 (0.08) 1.91 (0.11)
2 3.01 (4.96) 95.52 (6.68) 1.66 (0.08) 1.8 (0.01)
3 4.79 (6.34) 93.57 (9.13) 1.59 (0.06) 1.76 (0.02)
4 2.96 (5.31) 95.39 (7.03) 1.5 (0.05) 1.76 (0.04)
5 8.43 (11.41) 88.25 (16.48) 1.54 (0.07) 1.77 (0.01)
6 9.25 (7.52) 86.96 (10.51) 2.8 (0.14) 3.01 (0.03)
7 8.12 (7.22) 89.12 (10.53) 2.93 (0.12) 3.26 (0.04)
8 12.53 (7.93) 82.35 (11.32) 2.78 (0.12) 3.08 (0.02)
9 9.79 (7.96) 85.6 (12.01) 2.82 (0.12) 3.08 (0.03)
10 10.17 (7.05) 86.16 (9.4) 2.73 (0.14) 3.01 (0.04)
11 15.93 (9.82) 76.31 (14.37) 4.56 (0.25) 4.84 (0.03)
12 21.04 (10.79) 68.86 (16.47) 4.65 (0.24) 4.78 (0.06)
13 17.54 (8.49) 74.71 (12.45) 4.67 (0.21) 4.87 (0.03)
14 18.55 (10.36) 71.55 (16.45) 4.69 (0.21) 4.8 (0.03)
15 18.3 (9.89) 75.19 (12.46) 4.5 (0.2) 4.72 (0.03)
16 25.73 (10.42) 64.0 (16.8) 6.76 (0.32) 6.62 (0.04)
17 24.34 (13.53) 62.8 (21.68) 6.82 (0.32) 6.7 (0.06)
18 23.41 (8.87) 66.2 (12.49) 6.53 (0.3) 6.44 (0.09)
19 22.37 (7.73) 69.16 (12.43) 6.68 (0.27) 6.45 (0.03)
20 25.77 (9.77) 63.93 (12.95) 6.47 (0.29) 6.35 (0.06)
We also illustrated in figures 6,7,8 and 9 the Pareto
front found by both methods on instances 5, 10, 15,
and 20, which are respectively of size 50, 100, 150,
and 200 requests.
The findings indicate that MOCS outperforms
NSGA-II in dominance metrics. Specifically, the
mean dominance percentage of MOCS over NSGA-
II is markedly higher than that of NSGA-II over
Optimized Scheduling for Electric Vehicle Charging: A Multi-Objective Approach to Grid Stability and User Satisfaction
153
Figure 6: Comparison of Pareto Fronts Generated by Both
Methods for Instance 5.
Figure 7: Comparison of Pareto Fronts Generated by Both
Methods for Instance 10.
MOCS. This suggests that MOCS consistently finds
more solutions that dominate those produced by
NSGA-II, with many MOCS solutions remaining
non-dominated by NSGA-II. Across all instances, the
total mean dominance percentage of NSGA-II over
MOCS is 14.28%, compared to 79.56% for MOCS
over NSGA-II, with notably lower standard devia-
tions, reflecting consistency in performance.
Regarding execution time, NSGA-II exhibits
slightly faster performance than MOCS; however, this
difference is marginal, remaining under 0.33 seconds
across all instances, including larger cases. The stan-
dard deviation remains similarly low, indicating sta-
bility in computational efficiency.
Additionally, the figures 6,7,8 and 9 clearly illus-
trate that the Pareto front approximations generated
by MOCS are more extensive than those produced
by NSGA-II. This trend was consistently observed
across all executions and instances, suggesting that
MOCS provides greater diversity in trade-off solu-
Figure 8: Comparison of Pareto Fronts Generated by Both
Methods for Instance 15.
Figure 9: Comparison of Pareto Fronts Generated by Both
Methods for Instance 20.
tions along the Pareto fronts. Consequently, MOCS
provides a broader range of options for decision-
makers.
The results clearly indicate that the proposed
adaptation of MOCS is more effective than NSGA-
II in identifying satisfactory solutions within a rea-
sonable time frame for this specific problem. There
is potential to enhance both methods further by ex-
ploring alternative operator definitions, employing re-
fined versions of each algorithm, as suggested by var-
ious studies in the literature, or by considering ad-
ditional population-based metaheuristics within the
multi-objective optimization framework. These ap-
proaches may yield even more promising outcomes,
which could be a focus of future research. Nonethe-
less, the proposed MOCS demonstrates significant
promise and appears well-suited to the requirements
of the proposed model.
To support reproducibility and further research,
ICORES 2025 - 14th International Conference on Operations Research and Enterprise Systems
154

a GitHub repository
1
provides the Python imple-
mentations of both algorithms, optimized with the
Numba library. This repository includes instance sim-
ulations and test cases in Jupyter Notebook format.
Additionally, it offers Pareto front approximations
for both methods across all instances and executions,
alongside numerical data on dominance and execution
times.
6 CONCLUSION
In summary, this study presents an innovative
multi-objective optimization model for EV charging
scheduling, aiming to minimize peak energy con-
sumption and reduce charging times. By incorpo-
rating real-world factors such as sequential charger
usage, compatibility, and operational constraints, the
model provides a robust framework for optimiza-
tion. It allows decision makers to select from various
schedules on the Pareto Front, balancing grid stability
with client service times based on actual grid capabil-
ities.
We have adapted the NSGA-II and MOCS al-
gorithms to our model, with comparative analysis
demonstrating that MOCS is the more effective so-
lution in this context. MOCS achieves broader Pareto
front coverage within a reasonable time frame of less
than 7 seconds, with a dominance percentage averag-
ing 79.56% for MOCS over NSGA-II, compared to
only 14.28% for NSGA-II over MOCS.
The proposed model and MOCS adaptation have
significant implications for real-world EV infrastruc-
ture, providing a scalable and efficient solution to
meet the growing demands of electric mobility. Fu-
ture work may include exploring other metaheuristics
and solving methods, as well as investigating variable
charging powers and preemptive charging modes to
enhance scheduling flexibility.
REFERENCES
An, Y., Gao, Y., Wu, N., Zhu, J., Li, H., and Yang, J.
(2023). Optimal scheduling of electric vehicle charg-
ing operations considering real-time traffic condition
and travel distance. Expert Systems with Applications,
213:118941.
Chen, J., Mao, L., Liu, Y., Wang, J., and Sun, X. (2023).
Multi-objective optimization scheduling of active dis-
tribution network considering large-scale electric ve-
hicles based on nsgaii-ndax algorithm. IEEE Access,
11:97259–97273.
1
https://github.com/aikhiar/Minimizing-grid-capacity-
and-service-times
Deb, K., Pratap, A., Agarwal, S., and Meyarivan, T. (2002).
A fast and elitist multiobjective genetic algorithm:
Nsga-ii. IEEE Transactions on Evolutionary Compu-
tation, 6(2):182–197.
Electric Power Research Institute (2023). Environmen-
tal assessment of a full electric transportation port-
folio: Executive summary. Retrieved April 29,
2024, from https://www.epri.com/research/products/
3002006881.
Holland, J. H. (1992). Adaptation in Natural and Artificial
Systems: An Introductory Analysis with Applications
to Biology, Control, and Artificial Intelligence. The
MIT Press.
International Energy Agency (IEA) (2024). Global ev out-
look 2024. IEA, Paris. Retrieved from https://www.
iea.org/reports/global-ev-outlook-2024.
Khiar, A., Brahmia, M.-e.-A., Oulamara, A., and
Idoumghar, L. (2025). Multi-objective approach for
efficient grid resources allocation in electric vehi-
cle charging schedules. In Congr
`
es de la Soci
´
et
´
e
Franc¸aise de Recherche Op
´
erationelle et d’Aide
`
a la
D
´
ecision (ROADEF’25), Paris.
Liu, M., Wang, X., Sheng, Y., and Wang, L. (2019). Im-
provement of multi-objective differential evolutionary
algorithm and its application for hybrid electric vehi-
cles. In 2019 Chinese Control And Decision Confer-
ence (CCDC), pages 553–558.
Mishra, S., Mondal, A., and Mondal, S. (2023). A
multi-objective optimization framework for electric
vehicle charge scheduling with adaptable charging
ports. IEEE Transactions on Vehicular Technology,
72(5):5702–5714.
Ren, Y., Tan, M., Su, Y., Wang, R., and Wang, L. (2024).
Two-stage adaptive robust charging scheduling of
electric vehicle station based on hybrid demand re-
sponse. IEEE Transactions on Transportation Elec-
trification, pages 1–1.
Yang, X.-S. and Deb, S. (2009). Cuckoo search via l
´
evy
flights. In 2009 World Congress on Nature & Biolog-
ically Inspired Computing (NaBIC), pages 210–214.
Yang, X.-S. and Deb, S. (2013). Multiobjective cuckoo
search for design optimization. Computers & Op-
erations Research, 40(6):1616–1624. Emergent Na-
ture Inspired Algorithms for Multi-Objective Opti-
mization.
Zaidi, I., Oulamara, A., Idoumghar, L., and Basset, M.
(2024). Minimizing grid capacity in preemptive elec-
tric vehicle charging orchestration: Complexity, exact
and heuristic approaches. European Journal of Oper-
ational Research, 312(1):22–37.
Zhu, M., Liu, X.-Y., Kong, L., Shen, R., Shu, W., and
Wu, M.-Y. (2014). The charging-scheduling prob-
lem for electric vehicle networks. In 2014 IEEE
Wireless Communications and Networking Confer-
ence (WCNC), pages 3178–3183.
Optimized Scheduling for Electric Vehicle Charging: A Multi-Objective Approach to Grid Stability and User Satisfaction
155
