
3DSES: An Indoor Lidar Point Cloud Segmentation Dataset with Real
and Pseudo-Labels from a 3D Model
Maxime M
´
erizette
1,2,4 a
, Nicolas Audebert
3,4 b
, Pierre Kervella
1,2
and J
´
er
ˆ
ome Verdun
2 c
1
QUARTA, F-35136 Saint Jacques de la Lande, France
2
Conservatoire National des Arts et M
´
etiers, GeF, EA4630, F-72000 Le Mans, France
3
Universit
´
e Gustave Eiffel, ENSG, IGN, LASTIG, F-94160 Saint-Mand
´
e, France
4
Conservatoire National des Arts et M
´
etiers, CEDRIC, EA4629, F-75141 Paris, France
{maxime.merizette, jerome.verdun}@lecnam.net, nicolas.audebert@ign.fr, p.kervella@quarta.fr
Keywords:
Dataset, LIDAR, Point Cloud, Semantic Segmentation, 3D Model, Deep Learning.
Abstract:
Semantic segmentation of indoor point clouds has found various applications in the creation of digital twins
for robotics, navigation and building information modeling (BIM). However, most existing datasets of labeled
indoor point clouds have been acquired by photogrammetry. In contrast, Terrestrial Laser Scanning (TLS) can
acquire dense sub-centimeter point clouds and has become the standard for surveyors. We present 3DSES
(3D Segmentation of ESGT point clouds), a new dataset of indoor dense TLS colorized point clouds covering
427 m
2
of an engineering school. 3DSES has a unique double annotation format: semantic labels annotated at
the point level alongside a full 3D CAD model of the building. We introduce a model-to-cloud algorithm for
automated labeling of indoor point clouds using an existing 3D CAD model. 3DSES has 3 variants of various
semantic and geometrical complexities. We show that our model-to-cloud alignment can produce pseudo-
labels on our point clouds with a > 95% accuracy, allowing us to train deep models with significant time
savings compared to manual labeling. First baselines on 3DSES show the difficulties encountered by existing
models when segmenting objects relevant to BIM, such as light and safety utilities. We show that segmentation
accuracy can be improved by leveraging pseudo-labels and Lidar intensity, an information rarely considered
in current datasets. Code and data will be open sourced.
1 INTRODUCTION
Building Information Modeling (BIM) is a compre-
hensive tool for managing buildings throughout their
entire life cycle, from construction to demolition. It
consists in creating a digital representation of a build-
ing, called a “digital twin”. BIM helps reduce con-
struction and maintenance costs by facilitating plan-
ning and simulation on the virtual assets (Bradley
et al., 2016) and preserve heritage structures (Poco-
belli et al., 2018). BIM allows for monitoring build-
ings over time and managing equipment by record-
ing details such as installation date and maintenance
schedules. The creation of digital twins often involves
in situ acquisitions to reconstruct the building’s 3D
structure, often using point clouds (Wang et al., 2015;
Jung et al., 2018; Angelini et al., 2017). In recent
a
https://orcid.org/0009-0006-5889-1637
b
https://orcid.org/0000-0001-6486-3102
c
https://orcid.org/0000-0002-8887-9122
years, 3D data acquisition technologies have not only
significantly improved in accuracy, but also diversi-
fied their sensing apparatus. In most cases, sensors
create point clouds based either on photogramme-
try, e.g. using stereo photography or structure-from-
motion, or on laser-based Lidar systems. Acquisition
has been made increasingly intuitive and easy with
the improvements of 3D scanners, including real-time
positioning and very high acquisition speed. Terres-
trial Laser Scanning (TLS) has become the standard
for surveyors to create large point clouds of building
interiors in a few hours.
Meanwhile, the enrichment of point clouds has
not met the same progresses. 3D CAD modeling of
buildings based on point clouds remains a manual and
time-consuming task. Creation of 3D CAD models is
minimally automated and still requires the interven-
tion of qualified experts. Semantic segmentation of
point clouds is a promising avenue to automatically
label point clouds, and could accelerate the model-
ing by helping surveyors to identify structural primi-
Mérizette, M., Audebert, N., Kervella, P. and Verdun, J.
3DSES: An Indoor Lidar Point Cloud Segmentation Dataset with Real and Pseudo-Labels from a 3D Model.
DOI: 10.5220/0013237300003912
Paper published under CC license (CC BY-NC-ND 4.0)
In Proceedings of the 20th International Joint Conference on Computer Vision, Imaging and Computer Graphics Theory and Applications (VISIGRAPP 2025) - Volume 2: VISAPP, pages
707-716
ISBN: 978-989-758-728-3; ISSN: 2184-4321
Proceedings Copyright © 2025 by SCITEPRESS – Science and Technology Publications, Lda.
707
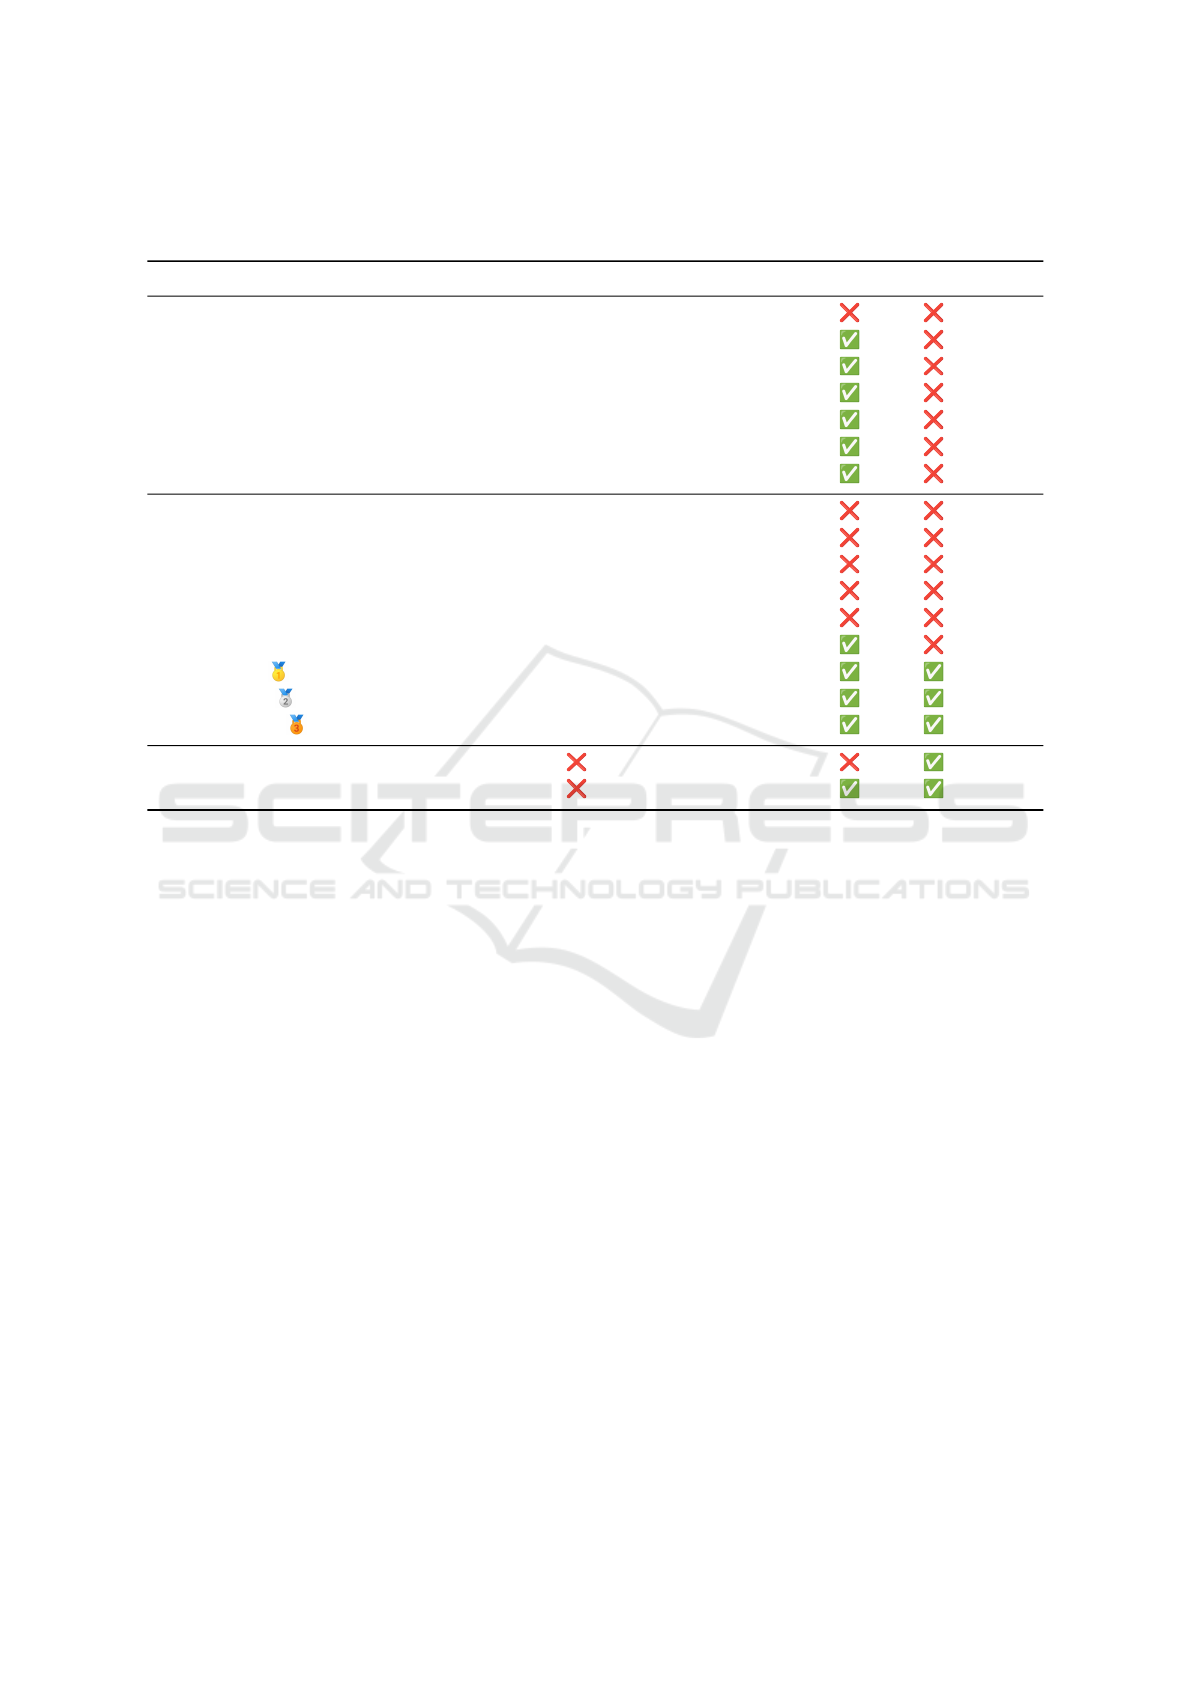
Table 1: Comparison of the characteristics of various point cloud datasets from the literature. Note that 3DSES is the only
indoor TLS dataset that includes intensity, point level annotations and a 3D CAD model. Despite its size, it also has more
points than most existing datasets, demonstrating a very high point density.
Name Environment Classes Extent
1
Points (M) Intensity 3D model Source
Oakland (Munoz et al., 2009) Outdoor 44 - 1.6 MLS
Paris-rue-Madame (Serna et al., 2014) Outdoor 17 160 m 20 MLS
IQmulus (Vallet et al., 2015) Outdoor 8 10 000 m 12 MLS
Semantic 3D (Hackel et al., 2017) Outdoor 8 - 4000 TLS
Paris-Lille-3D (Roynard et al., 2018) Outdoor 9 1940 m 143.1 MLS
SemanticKITTI (Behley et al., 2021) Outdoor 25 39 200 m 4500
MLS
Toronto-3D (Tan et al., 2020) Outdoor 8 1000 m 78.3 TLS
Matterport3D (Chang et al., 2017) Indoor 20 219 399 m
2
- Camera
ScanNet (Dai et al., 2017) Indoor 20 78 595 m
2
242 Camera
S3DIS (Armeni et al., 2016) Indoor 13 6020 m
2
215 Camera
ScanNet++ (Yeshwanth et al., 2023) Indoor - 15 000 m
2
20 TLS
ScanNet200 (Rozenberszki et al., 2022) Indoor 200 78 595 m
2
242 Camera
LiDAR-Net (Guo et al., 2024) Indoor 24 30 000 m
2
3600 MLS
3DSES Gold Indoor 18 101 m
2
65 TLS
3DSES Silver Indoor 12 304 m
2
216 TLS
3DSES Bronze Indoor 12 427 m
2
413 TLS
Indoor Modelling (Khoshelham et al., 2017) Indoor 2824 m
2
127 5 sensor
Craslab (Abreu et al., 2023) Indoor 417 m
2
584 TLS
1
Surface for indoor datasets, linear extent for outdoor datasets.
tives (walls, ground, doors) and even furniture types
(chairs, tables, etc.). However, few datasets exist for
semantic segmentation of indoor TLS point clouds.
Moreover, surveying companies have access to large
databases of existing 3D CAD models and associ-
ated point clouds, but the latter are mostly unlabeled.
For these reasons, we introduce 3DSES (Fig. 1), a
dataset of indoor TLS acquisitions with manually an-
notated point clouds and a BIM-like 3D CAD model.
In addition to the overall structure and furniture, we
label several types of common BIM elements, such
as extinguishers, alarms and lights, that are challeng-
ing to detect in point clouds. To evaluate the feasi-
bility of automatically annotating point clouds based
on existing BIM models, we introduce a 3D model-
to-cloud alignment algorithm to label points clouds.
We show that these pseudo-labels are nearly as ef-
fective as manual point cloud annotation for most
classes. However, we show that small objects remain
extremely challenging for existing point cloud seg-
mentation models. 3DSES is a unique dataset that
contains all the steps required for automated scan-to-
BIM: dense point clouds, semantic segmentation la-
bels and a full 3D CAD model. We hope that 3DSES
will enable the creation and testing of deep models for
multiple tasks, from point cloud segmentation to BIM
generation through mesh to point cloud alignment.
2 PREVIOUS WORK
Numerous datasets exist for semantic segmentation of
point clouds with various sizes of scenes, different
types of objects of interest and acquired using vari-
ous sensors, each with their own characteristics. We
review in Table 1 some of the more popular ones.
Outdoor Datasets. The first popular datasets for
semantic segmentation of point clouds focused on
outdoors. Mobile laser scanning is popular for out-
door scenes as moving platforms cover more ground.
Since the laser is moving, the point clouds tend to
be sparse, e.g. the seminal Oakland dataset (Munoz
et al., 2009) has less than 2M points. Later datasets
such as IQmulus (Vallet et al., 2015) or Paris-rue
Madame (Serna et al., 2014) are also relatively small,
with less than 20M points. Bigger datasets have been
consolidated by covering larger scenes, such as Paris-
Lille-3D (Roynard et al., 2018) and SemanticKITTI
(Behley et al., 2021). While MLS makes sense for
VISAPP 2025 - 20th International Conference on Computer Vision Theory and Applications
708
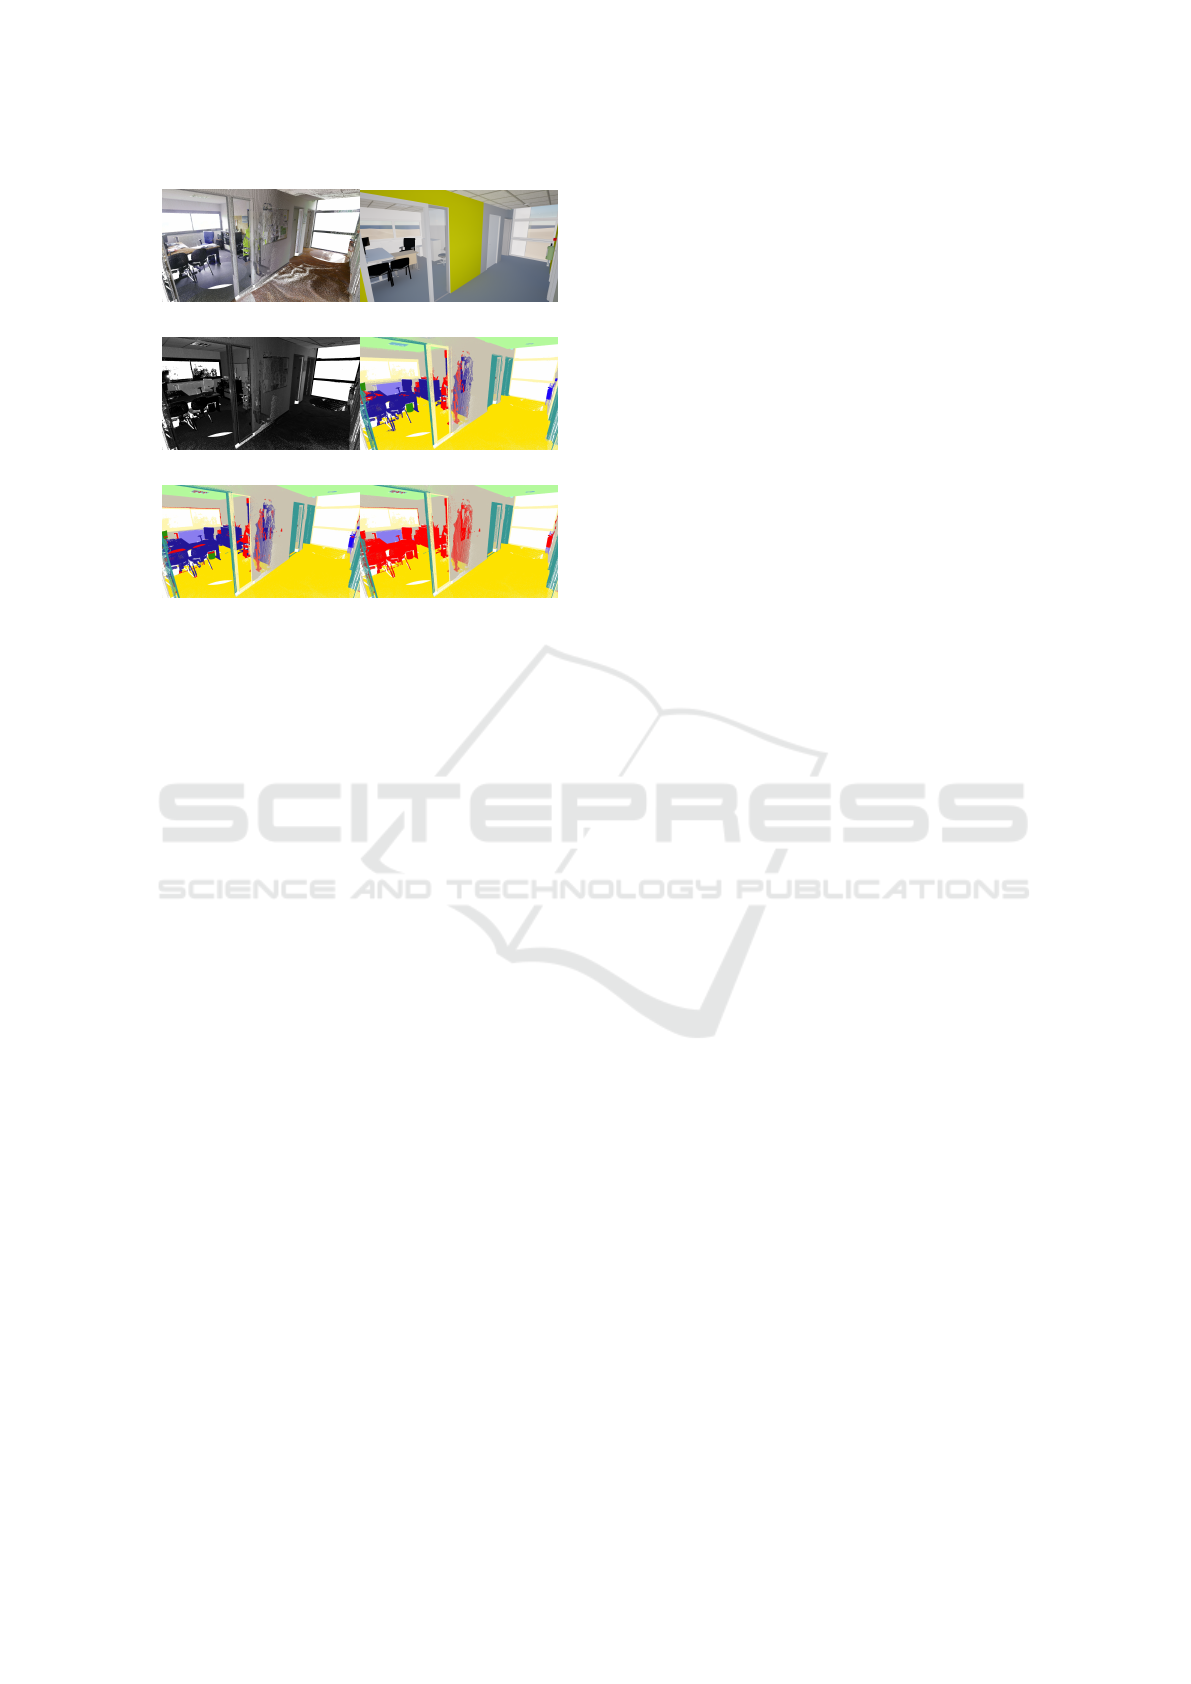
(a) RGB (b) 3D model
(c) Intensity (d) Gold - Real labels
(e) Gold - Pseudo labels (f) Silver - Pseudo labels
Figure 1: Modalities and annotation variants of 3DSES.
Gold real labels are manual annotations across 18 classes,
including small objects such as light switches and electri-
cal outlets. Pseudo-labels are obtained by automatically
aligning the 3D model on the point cloud, introducing some
noise in the annotation (see e.g. the top of the chairs). Silver
labels use a simplified classification of only 12 categories
(e.g. the wastebin is now simply “clutter”). Legend: Col-
umn in dark purple, components in dark green, coverings in
light green, doors in green, emergency signs in light blue,
fire terminals in dark blue, heaters in light purple, lamps in
blue, ground in yellow, walls in grey, windows in light yel-
low, clutter in red.
autonomous driving, segmentation performance on
these point clouds is not representative of indoor
scenes which are much denser with lots of small ob-
jects. Concurrently, point clouds acquired by aerial
Lidar have been used to create datasets on very large
scenes, such as the ISPRS 3D Vaihingen (Rotten-
steiner et al., 2012), DublinCity (Zolanvari et al.,
2019), LASDU (Ye et al., 2020), DALES (Varney
et al., 2020), Campus3D (Li et al., 2020), Hessigheim
(K
¨
olle et al., 2021), SensatUrban (Hu et al., 2021) and
FRACTAL (Gaydon et al., 2024). These datasets use
Aerial Laser Scanning (ALS), with a top-down view
that makes them effective for digital surface models
but unsuitable for BIM.
However, some outdoor datasets have a density
and geometry close to those found in BIM. For exam-
ple, Semantic 3D (Hackel et al., 2017) and Toronto-
3D (Tan et al., 2020) both use TLS with high point
density. These outdoor scenes do not contain many
small objects, though, as they rarely consider classes
smaller than outdoor furniture, e.g. benches or trash-
bins.
Indoor Datasets. Few new indoors datasets have
been published in the last five years. The two most
widely used datasets – S3DIS (Armeni et al., 2016)
and ScanNet (Dai et al., 2017) – were published in
2017. The lesser known Matterport3D (Chang et al.,
2017) was published in the same year with simi-
lar characteristics. ScanNet was updated with more
classes in ScanNet200 (Rozenberszki et al., 2022),
yet using the same point clouds. All these datasets
are acquired by RGB-D cameras. The resulting point
clouds are sparser and more sensitive to occlusions
than TLS data. For example, S3DIS contains 215
million points, which corresponds to approximately
ten stations in a medium-resolution TLS system. Yet,
these datasets are the most common benchmarks to
evaluate deep point cloud segmentation, meaning that
new approaches are tested on partially obsolete tech-
nology. While indoor TLS datasets exist, e.g. In-
door Modeling (Khoshelham et al., 2017) and Craslab
(Abreu et al., 2023), they do not contain seman-
tic labels and only release a simplified CAD model.
LiDAR-Net (Guo et al., 2024) uses a mobile laser
scanner (MLS) to create an indoor dataset more suit-
able for autonomous navigation, resulting in a point
cloud that contains scan holes, scan lines and var-
ious anomalies that are not shared with TLS scans
for building surveys. To the best of our knowl-
edge, the only dataset using labeled TLS point clouds
is ScanNet++ (Yeshwanth et al., 2023). However,
ScanNet++ used a complex three devices acquisition
setup. DSLR images were acquired separately from
the scans, and then backprojected to colorize point
clouds. This setup is not representative of usual sur-
veys practices. For 3DSES, we use a simpler acquisi-
tion workflow, as the RGB information comes directly
from the TLS.
Points Clouds with Intensity. Lidar intensity
measures the strength of the laser impulse returned by
a scanned point. It is a feature commonly used in out-
door point cloud datasets, especially because infrared
is helpful to identify vegetation. However, intensity
is notably absent from indoor datasets, with the ex-
ception of LiDAR-Net (Guo et al., 2024). In theory,
different materials reflect light differently and these
variations impact the measured intensity of the laser
echo. This information might help deep models to
discriminate between objects that have similar geom-
etry, but different natures. For this reason, we include
the intensity information in our 3DSES dataset.
Uniqueness of 3DSES. While covering a smaller
surface than other datasets, 3DSES is extremely
dense, with a sub-centimeter resolution. It is also
the only TLS dataset with Lidar intensity, an infor-
mation often removed in publicly available datasets,
3DSES: An Indoor Lidar Point Cloud Segmentation Dataset with Real and Pseudo-Labels from a 3D Model
709
despite theoretically being a discriminative property
of materials. 3DSES is also a labeled dataset, suit-
able to train or evaluate semantic segmentation algo-
rithms. Finally, 3DSES comes with a 3D CAD model
designed for BIM. This combination is unique across
existing datasets, and makes 3DSES suitable to inves-
tigate 3D point clouds for indoor building surveys and
modeling.
3 3DSES
We present in this section the data acquisition and la-
beling process, the 3D modeling and an automated
pseudo-labeling alignment algorithm.
3.1 Data Collection
Point Clouds Acquisition. Data acquisition was car-
ried out at ESGT using two Terrestrial Laser Scanners
(TLS): a Leica RTC360 and a Trimble X7. High-
resolution pictures were taken for each scan (15MP
for RTC360 and 10MP for Trimble X7). Scans were
preregistered during the survey. We performed and
bundled multiple scans inside every room to capture
as many objects as possible. Scans were then merged
for registration, and any missing link was manually
corrected. Point clouds are georeferenced using coor-
dinates from total stations and GNSS. We release both
colorized (Fig. 1a) and intensity (Fig. 1c) clouds.
Manual Labeling. We manually annotated the
point clouds to create a ground truth denoted as the
real labels, shown in Fig. 1d. Since this is time-
consuming, we annotated only 10 points clouds in
18 fine-grained classes: “Column”, “Component”,
“Covering”, “Damper”, “Door”, “Exit sign”, “Fire
terminal”, “Furniture”, “Heater”, “Lamp”, “Outlet”,
“Railing”, “Slab”, “Stair”, “Switch”, “Wall”, “Win-
dow” and a “Clutter” class that encompasses all points
not belonging to another class. Labels were annotated
in two passes: 1) labeling by a single annotator (30 to
40 minutes per scan, depending on the complexity of
the point cloud, the number of points and the diver-
sity of represented objects); 2) verification pass by an
experienced annotator (20 to 30 minutes per scan).
We then annotated 20 additional point clouds with
a simpler taxonomy of only 12 classes, shown in
Fig. 1f. These labels were annotated in a single pass,
as the target objects are less ambiguous with simpler
geometries. During this process, the points clouds
were partially cleaned of outliers and far away points.
3D CAD Model. Each type of object is tagged as
a member of the corresponding IFC (Industry Foun-
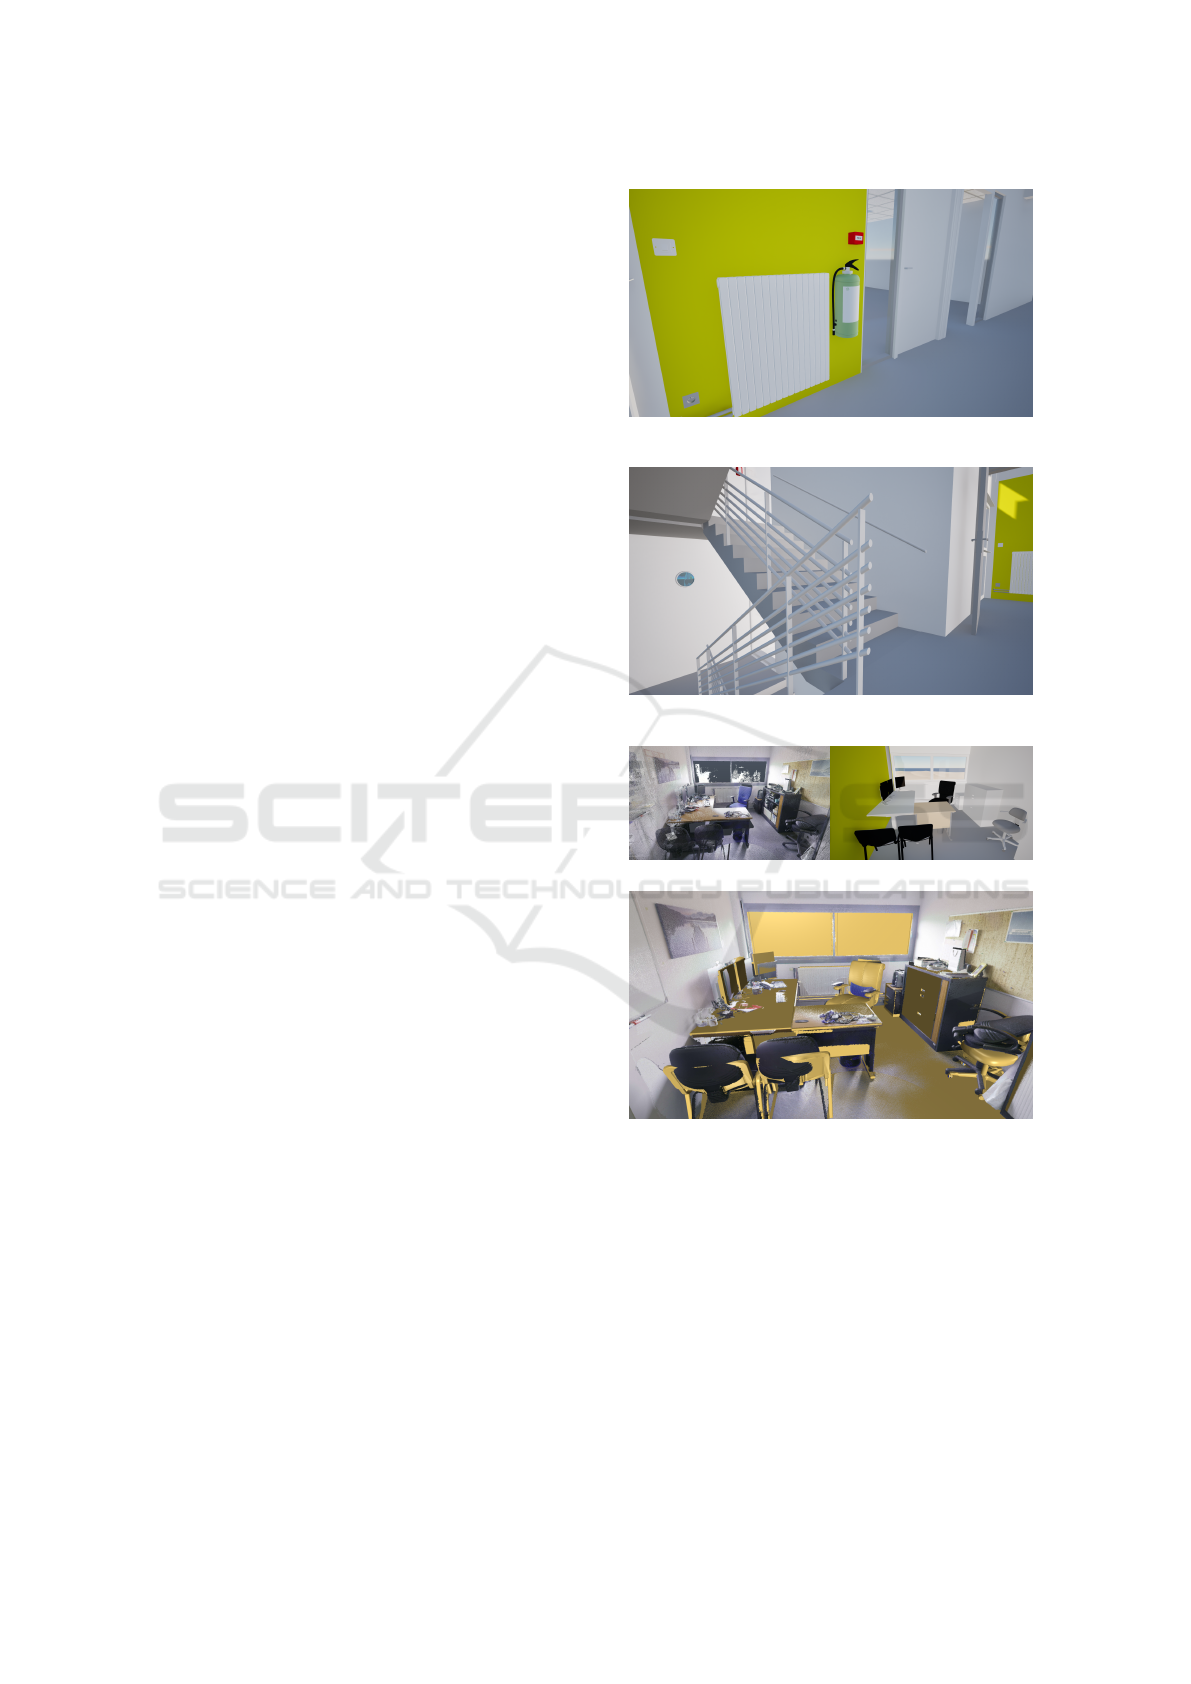
(a) Example of modeled 3D systems: fire alarm, fire ex-
tinguisher, heater, outlet, light switch.
(b) Structural objects: stairs, railings, doors, walls,
floors.
(c) 3D point cloud of a room (d) 3D model of a room
(e) Overlay of clouds and objects
Figure 2: View of a test area room. The generic 3D models
are close, but not perfect matches for the actual scans.
dation Classes) family. The geometry of structural
elements (walls, floors, roofs, etc.) is accurately
modeled, i.e. shapes and dimensions are modeled
as precisely as possible. Furniture, such as tables
and chairs, and utilities, such as fire extinguishers
and emergency exit signs, use standard models, e.g.
all chairs use the same mesh (cf. Fig. 2d). This is
a common practice in BIM, as defining a separate
“chair” family for each instance would be too time-
consuming. Fig. 2e illustrates how these generic 3D
VISAPP 2025 - 20th International Conference on Computer Vision Theory and Applications
710

CAD models create slight geometrical discrepancies
between the point cloud and the model. Finally, a spe-
cial care is given to doors, that can appear either open
or closed in scans. We model each door in its correct
state depending on its true position in the point cloud.
Complete modeling took slightly less than 30 hours.
3.2 Dataset Variants
Based on the TLS scans and the manual annotations,
we built three versions of the 3DSES dataset (cf. Ta-
ble 2). The Gold version is composed of the 10 scans
annotated in 18 classes. We consider it to be the “gold
standard”, using fine-grained high quality real labels.
We then extended it into a Silver version that contains
all the Gold data and an additional 20 scans. Silver la-
bels use a simplified taxonomy of only 12 classes, that
are less time consuming to produce. Both Gold and
Silver variants of 3DSES are high quality, using a real
ground truth and cleaned up point clouds. Finally, we
deliver a Bronze version that includes 12 more scans.
Bronze contains the raw point clouds and not the pro-
cessed and cleaned clouds. These full point clouds
are denser and noisier, but also more representative of
actual field scans. Since the additional point clouds
have not been manually labeled, the Bronze dataset
uses the automatically generated pseudo-labels based
on the 3D model using the procedure detailed in Sec-
tion 3.3.
Note that all variants suffer from class imbalance,
as shown in Figs. 3a and 3b. Structural elements
are over represented compared to other classes, es-
pecially furniture and utilities, that are comprised of
smaller objects. This is a well-known issue in indoor
datasets, such as S3DIS (Armeni et al., 2016), which
has 10× more wall points than window points, and
ScanNet200 (Rozenberszki et al., 2022), which con-
tains 51 million wall points and only 50 000 fire ex-
tinguisher points.
Train/Test Split. We define a set Train/Val/Test
split with a common test area to all variants, based on
3 scans located in the Gold section (scans S170, S171
and S180). It contains ≈ 20.7 million points with real
ground truth. This allows us to evaluate models on
real labels only, whether they have been trained on
real or pseudo-labels. Ground truth labels on the test
set are kept hidden for later use in a Codabench chal-
lenge.
3.3 Pseudo-Labeling from the 3D Model
One of our goals is to evaluate the feasibility of us-
ing existing 3D CAD models to label automatically
point clouds for semantic segmentation. Pseudo-
labels could help leverage existing databases of sur-
veyed buildings that have been scanned and modeled,
but not annotated at the point level. To this end, we
design an alignment algorithm to map the 3D model
on a point cloud.
First, we divide our 3D CAD model into objects.
This allows us to separate individual instances of
walls, heaters, light switches and so on. For each ob-
ject, we produce the corresponding 3D mesh. Since
the 3D CAD model and the point cloud are georefer-
enced, we can compute a mesh-to-cloud distance for
every point in the point cloud. For each object, we
first compute its georeferenced bounding box. Then,
we compute the distance for each point inside the
bounding box to the mesh of the object using the
Metro algorithm (Cignoni et al., 1998), implemented
in CloudCompare (Girardeau-Montaut, 2006). All
points that are inside the mesh are labeled the same
class as the IFC family of the object the mesh is de-
rived from. To alleviate for geometrical discrepancies
between the mesh and the point cloud, points outside
the mesh are assigned to their closest mesh as long
as the distance is lower than a predefined threshold.
We then repeat this process for all objects. Remain-
ing points that have not been labeled are classified
as “clutter”. This covers objects that are present in
the scan, but have not been modeled, e.g. jackets on
chairs, books and papers on tables, etc.. The algo-
rithms runs in around 9 hours on CPU to align the
full dataset (Bronze). This means the pseudo-labeling
process (3D model + alignment) takes ≈ 40 hours.
In comparison, manual point cloud annotation takes
1 hour per scan on average, i.e. would have taken
42 hours for 3DSES Bronze, including quality check.
While these times are comparable, point clouds are in-
termediate products in indoor surveys, the end goal of
which is almost always the production of a 3D CAD
model. This is why we assess whether pointwise la-
bels can be obtained as a “free” byproduct, without
any additional time dedicated to point annotation.
Evaluation of the Pseudo-Labels. Since 3DSES
also includes real labels, we can evaluate how well
the pseudo-labels match the ground truth. To do so,
we computed some standard segmentation metrics,
i.e. Intersection over Union (IoU), mean Accuracy
(mAcc) and Overall Accuracy (OA). We used dif-
ferent confidence thresholds depending on the object
class:
• Gold: 4 cm for all classes, except for “Door”,
“Furniture”, “Window”, for which we used 10 cm,
due to larger uncertainties when modeling;
• Silver and Bronze: 4 cm for all classes, except for
“Door” (10 cm) and “Window” (15 cm).
3DSES: An Indoor Lidar Point Cloud Segmentation Dataset with Real and Pseudo-Labels from a 3D Model
711
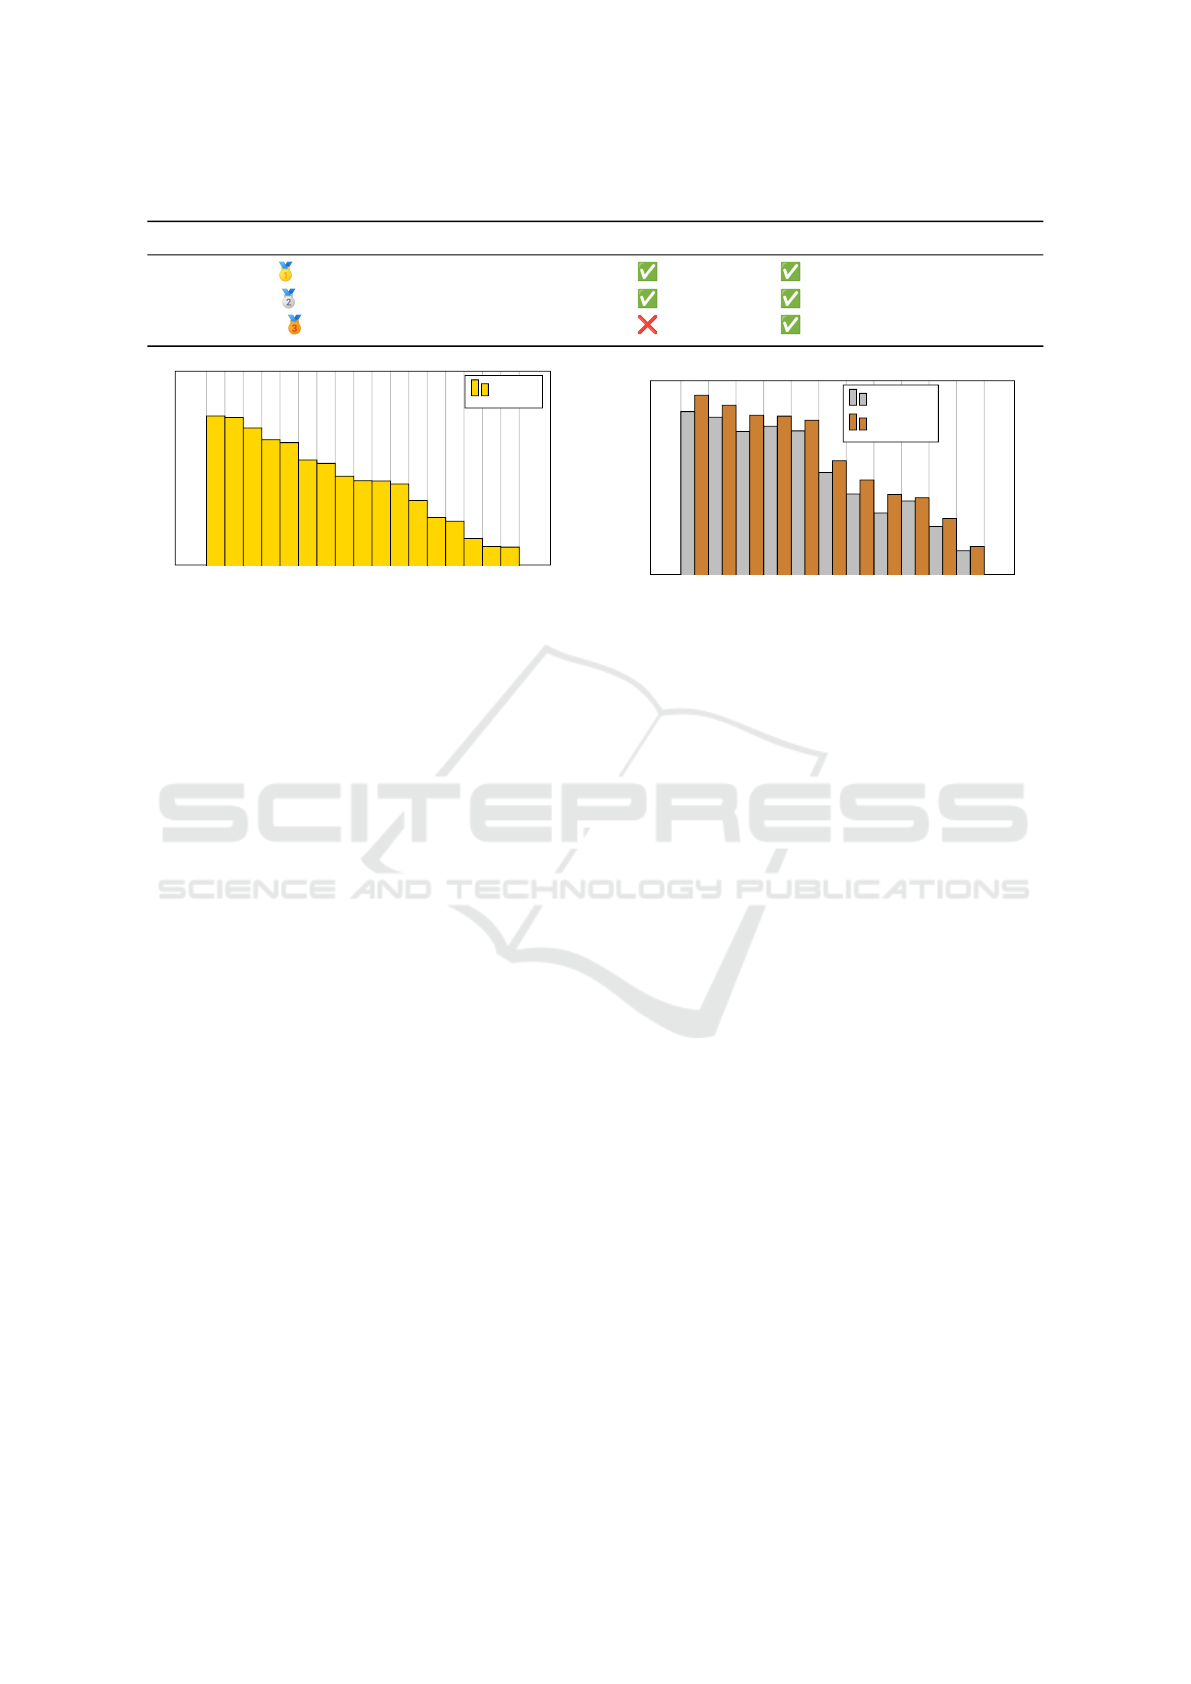
Table 2: Characteristics of the three variants of the 3DSES dataset.
Variant Scans Points Ground Truth Pseudo-labels Features Classes
Gold 10 65 214 193 RGB & I 18
Silver 30 216 181 580 RGB & I 12
Bronze 42 413 486 927 RGB & I 12
Wall
Covering
Slab
Door
Furniture
Window
Clutter
Stair
Components
Lamp
Heater
Railing
FireTerminal
Exit sign
Column
Damper
Outlet
10
4
10
6
10
8
Number of points
Gold
(a) Real labels distribution (Gold).
Covering
Wall
Door
Slab
Clutter
Window
Lamp
Heater
Stair
Column
Railing
10
6
10
8
Silver
Bronze
(b) Pseudo-labels (Silver/Bronze).
Figure 3: Distribution of the real and pseudo labels in the variants of the 3DSES dataset.
Metrics are computed between pseudo-labels and
the manual ground truth over the full dataset. We re-
port the alignment metrics in Table 3. We obtain high-
quality pseudo-labels on Gold version with ≈ 70%
mIoU and 95% accuracy. Structural classes (“Cov-
ering”, “Slab”, “Wall”) are very well annotated, with
a >90 % score. This is expected as these entities have
regular shapes with a fine alignment between the 3D
model and the point cloud. The lowest scores are on
the “Outlet” and “Switch” classes, below 50 %.
Alignment on the Silver variant is also satisfactory
with ≈ 75% mIoU and > 96% accuracy. Metrics are
higher on Silver since it focuses on structural classes
that are generally easier to align. The IoU for “Col-
umn” is also the lowest due to the use of a slightly
too small column diameter in the CAD model. The
second worst score is for “Window’ with 69 %, as
Silver contains more window types, including frames
that deviate from the CAD model. Finally, metrics on
“Railing” and “Stair” are identical on Gold and Silver,
since stairs cover the same area in both datasets.
4 EXPERIMENTS
To assess the difficulty of 3DSES, we evaluate ini-
tial baselines for the three variants: Gold, Silver and
Bronze. We opt for PointNeXt (Qian et al., 2022) and
Swin3D (Yang et al., 2023), since they are some of
the highest performing models for semantic segmen-
tation on S3DIS (Armeni et al., 2016), and their code
is available. We compare PointNeXt-S (800 000 pa-
rameters) to Swin3D-L (68M parameters).
Note that these models both perform voxelization
and therefore do not benefit from the extremely high
point density of 3DSES. In particular, PointNeXt is
not designed to process dense point clouds in opti-
mum time (≈ 4 hours per scan). To reduce inference
times, we subsample our test point clouds to 1 cm. We
expect that future models evaluated on 3DSES will
better take into account the fine resolution of indoor
TLS scans.
Hyperparameters. We train Swin3D-L with
AdamW, a cosine learning rate for 100 epochs, a
batch size of 6, and an inverse class frequency
weighted cross-entropy to deal with class imbalance.
PointNext-S is trained with the original S3DIS hyper-
parameters: epochs = 100, batch size = 32, AdamW
optimizer, a CosineScheduler and a non-reweighted
CrossEntropyLoss. We only tune the learning rate to
l
r
= 0.05 (instead of 0.01 in original setup). Follow-
ing standard practices (Wang et al., 2017; Wu et al.,
2022; Yang et al., 2023), we use test-time augmen-
tation and aggregate segmentation predictions with a
majority vote over 12 rotations. Models are trained on
an NVIDIA RTX A6000
Results on 3DSES Gold. We train both Swin3D-
L and PointNeXt-S models on 3DSES Gold: one on
the real labels and the other on the pseudo-labels. All
models are evaluated on the ground truth over the test
area. Results are reported in Table 4. We observe that
3DSES is a challenging dataset: mean IoU is heavily
penalized by performance on small objects. Classes
comprised of small objects with few points (< 10
5
VISAPP 2025 - 20th International Conference on Computer Vision Theory and Applications
712
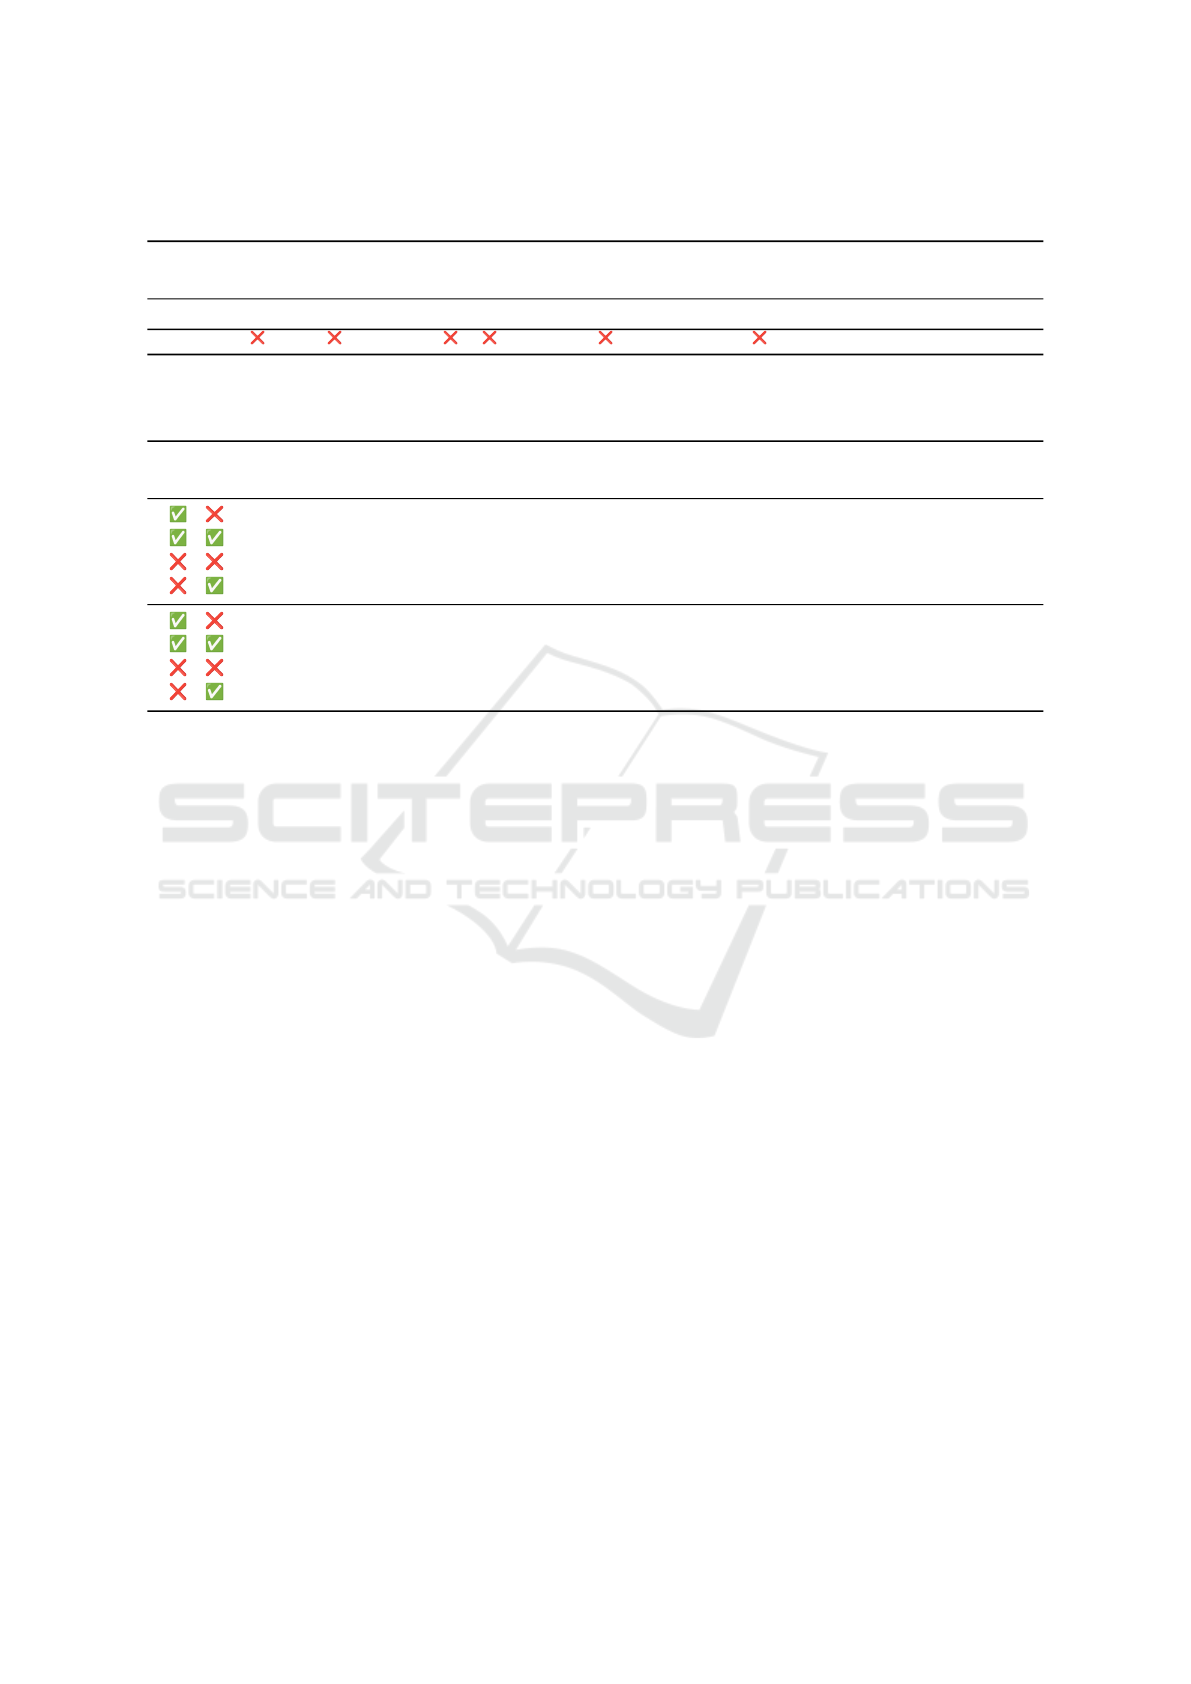
Table 3: Evaluation of the accuracy of the pseudo-labels obtained using our alignement algorithm on 3DSES. Intersection
over Union (IoU) per class, mean IoU (mIoU), overall accuracy (OA) and average accuracy (AA).
Variant
Column
Components
Covering
Damper
Door
Exit sign
Fire terminal
Furniture
Heater
Lamp
Outlet
Railing
Slab
Stair
Switch
Wall
Window
Clutter
OA AA mIoU
Gold 21.00 80.96 95.95 77.29 91.95 73.16 86.57 79.48 91.08 66.71 37.59 58.52 95.05 59.07 45.66 93.64 64.55 36.44 94.66 83.09 69.70
Silver 25.02 97.99 93.97 72.27 82.22 73.88 58.52 96.20 59.07 91.52 56.67 88.88 96.37 83.40 74.68
Table 4: Segmentation metrics on the test set for 3DSES Gold, either with real or pseudo labels (and intensity features or not).
Intersection over union (IoU) per class, mean IoU (mIoU), overall accuracy (OA), average accuracy (AA).
Real labels
Intensity
Column
Components
Covering
Damper
Door
Exit sign
Fire terminal
Furniture
Heater
Lamp
Outlet
Railing
Slab
Stair
Switch
Wall
Window
Clutter
OA AA IoU
Swin3D
0.00 31.16 90.12 14.63 75.95 12.19 56.67 71.57 76.18 26.76 9.53 71.75 87.63 70.59 0.00 88.40 47.26 52.03 89.74 78.30 49.02
0.00 49.76 94.62 18.23 81.87 27.37 67.10 73.13 83.61 47.73 0.00 57.31 85.29 56.67 0.00 89.68 53.54 50.46 91.64 74.45 52.02
17.52 34.81 88.90 31.71 75.84 16.31 48.28 68.87 71.04 24.50 12.85 45.53 86.84 58.64 0.93 87.09 50.59 40.31 88.54 76.80 47.81
30.06 51.07 93.29 63.98 54.16 0.00 21.36 51.32 66.14 41.09 6.33 50.31 79.04 40.46 0.00 83.92 48.96 31.98 86.48 74.10 45.19
PointNeXt-S
0.00 0.00 96.27 0.00 35.43 0.00 0.00 32.84 0.00 69.12 0.00 0.00 90.87 60.40 0.00 74.58 38.05 24.80 82.58 35.04 29.02
0.00 56.16 96.73 0.00 65.80 0.00 0.00 52.57 26.59 72.78 0.00 60.75 94.28 85.93 0.00 86.76 59.78 39.47 91.19 49.25 44.31
0.00 0.01 96.01 0.00 37.57 0.00 0.00 45.11 0.00 39.76 0.00 0.00 89.73 60.33 0.00 77.57 1.18 20.33 84.19 30.48 25.98
0.00 50.10 96.68 0.00 67.86 0.00 0.00 49.83 43.32 65.51 0.00 7.51 93.79 81.23 0.00 86.27 55.81 21.35 90.08 44.86 39.96
points) are difficult to learn and the model either
never predicts them, or makes significant errors. Note
that despite its high intraclass variance, “Clutter” is
mostly well segmented with a > 50% IoU, showing
that the model is able to automatically identify most
irrelevant objects from the point clouds. Interestingly,
the results also show that Swin3D only slightly un-
derperforms when trained on the pseudo-labels, with
a 1.2% decrease in mIoU (47.8% vs. 49.0%) com-
pared to the model trained on the real labels. Seg-
mentation errors when using pseudo-labels are con-
centrated on classes for which the alignment proce-
dure showed weaknesses, such as “Stair” and “Rail-
ing”. This demonstrates the potential of using CAD
models to automatically label point clouds, as way of
circumventing the lack of annotated datasets for spe-
cialized settings (i.e. factories, schools or administra-
tive buildings. . . ). PointNext struggles with 3DSES
and achieves low mIoU scores. However, the same
trends hold with better segmentation of structural ele-
ments and underperformance on minority classes.
Results on Silver/Bronze. We report in Table 5
the segmentation metrics on the 3DSES test set when
training Swin3D and PointNext on Silver, both with
pseudo and real labels, and on Bronze with pseudo la-
bels. We observe that metrics are consistently higher
for all 12 classes on Silver with real label compared
to training the Gold subset. This is expected, since
the Silver classification is simpler and removes small
objects that were heavily penalized. Yet, the larger
training set (Silver is 3× as large as Gold) benefits
the segmentation, with higher scores on the “Lamp”,
“Window” and “Clutter” classes that exhibit strong
diversity. Training with pseudo-labels on Silver re-
sults in a significant performance drop, correlated
with the lower class alignment scores discussed in
Section 3.3. Yet results on 3DSES Bronze show that
the noise in the pseudo-labels can be alleviated by a
larger dataset. Despite using raw point clouds and
error-prone pseudo-labels, models trained on Bronze
achieves similar (PointNeXt) or even better (Swin3D)
segmentation accuracy than when trained on the clean
Silver dataset. We assume that diversity partially
compensates for label noise, allowing models to learn
better invariances despite small errors in the labels.
In addition, the raw point clouds are denser that the
clean versions used in Silver and Bronze and might
provide more geometrical information that is more
costly to process, but also more discriminative. These
observations show the tradeoffs of the three variants
of 3DSES, from training on small high-quality data,
to larger but noisier point clouds.
Impact of Lidar Intensity. As described in Sec-
tion 2, 3DSES is the only indoor TLS dataset that
provides Lidar intensity. We included intensity as an
additional feature in our models to evaluate its im-
pact on semantic segmentation. As shown in Table 4
for Swin3D, we observe a 3.0% increase in mIoU
when using intensity in addition to color on real la-
bels. Nonetheless, we observe a decrease for Swin3D
3DSES: An Indoor Lidar Point Cloud Segmentation Dataset with Real and Pseudo-Labels from a 3D Model
713

Table 5: Segmentation metrics on the test set for 3DSES Silver and Bronze, either with real or pseudo labels (and intensity
features or not). Intersection over union (IoU) per class, mean IoU (mIoU), overall accuracy (OA), average accuracy (AA).
Labels Intensity Column Covering Door Exit sign Heater Lamp Railing Slab Stair Wall Window Clutter OA AA IoU
Swin3D
Silver
0.00 89.07 76.40 9.93 74.69 32.24 46.22 86.40 67.75 89.24 54.62 90.42 91.69 84.84 59.75
5.40 94.35 83.06 9.30 75.27 44.04 37.63 84.08 38.69 85.34 54.99 72.83 90.47 83.39 57.08
25.47 88.50 61.62 12.96 59.24 30.79 35.94 77.55 36.22 87.61 48.76 71.15 87.49 88.44 52.98
52.31 95.82 89.01 11.79 65.29 55.28 64.17 82.06 34.32 92.44 54.00 91.92 93.46 89.44 65.70
Bronze
51.76 95.90 89.37 12.45 65.80 52.25 82.14 86.80 43.15 93.33 60.53 93.59 94.59 93.67 68.92
59.68 95.97 88.10 41.80 71.59 55.59 77.20 85.81 41.40 93.00 60.89 94.52 94.51 94.37 72.13
PointNeXt-S
Silver
0.00 96.77 67.11 0.00 16.45 69.95 61.75 94.88 83.87 89.26 62.54 80.25 93.30 66.27 60.24
0.00 97.07 76.66 0.00 38.73 78.11 65.26 94.85 86.97 90.84 67.08 84.35 94.63 70.59 64.99
0.00 96.53 73.07 0.00 20.33 66.71 2.79 93.50 76.90 90.32 40.60 71.12 92.68 57.60 52.66
58.44 96.55 69.81 0.00 33.96 67.00 38.90 93.86 83.48 88.12 51.25 73.60 92.58 71.19 62.91
Bronze
11.21 95.68 85.16 0.00 69.18 66.19 15.97 93.53 80.09 92.62 49.09 82.86 94.57 66.47 61.79
56.45 96.44 81.39 0.00 79.71 77.40 42.25 93.35 78.33 91.57 56.47 80.94 94.47 77.06 69.53
on pseudo-labels (2.6%). However, the drop is not
consistent on all classes, e.g. few classes obtain bet-
ter IoU. On the other hand, including the intensity
for PointNeXt improves mIoU by 15%. This shows
that intensity helps generalization of smaller models.
In Table 5, intensity helps Swin3D and PointNeXt in
most cases. In comparison, Swin3D trained on Silver
variant with pseudo-labels and intensity obtains better
scores (+12.7% IoU) than without intensity. Overall,
the preliminary results could indicate that Lidar in-
tensity can indeed be discriminative for some classes,
especially for larger datasets. Further experiments are
required to validate these observations.
5 CONCLUSION
We introduced 3DSES, a new dataset for seman-
tic segmentation of dense indoor Lidar point cloud.
3DSES fills the need for indoor TLS datasets de-
signed for building survey and modeling. It contains a
unique combination of point cloud labels for semantic
segmentation, a georeferenced 3D CAD model with
BIM oriented objects and Lidar intensity, a radio-
metric feature not provided in existing datasets. We
demonstrate that using 3D CAD models to automati-
cally annotate point clouds is a time-efficient strategy
that produces pseudo-labels with 95% accuracy com-
pared to a manual ground truth. Moreover, we show
that training on pseudo-labels achieves similar perfor-
mance to training on real ones on 3DSES. We show
that segmentation accuracy can benefit from Lidar in-
tensity in indoor settings, despite radiometry being of-
ten ignored in previous works. Segmentation results
demonstrate that 3DSES is a challenging new dataset,
especially for BIM-oriented classes, e.g. small build-
ing components such as electrical terminals and safety
systems. We hope this new dataset will stimulate re-
search on indoor point clouds processing and motivate
the community to investigate auto-modeling tasks in
scan-to-BIM.
ACKNOWLEDGEMENTS
We would like to express our sincere appreciation to
all individuals and organizations who contributed to
our paper. Special thanks to Leica Geosystems for
loaning the RTC360 used in the acquisitions. We ac-
knowledge the support ESGT by loaning the Trimble
X7 and their permissions to carry out and publish the
3D scans. We also extend our thanks to Lilian Ri-
bet for 3D acquisitions and to L
´
ea Corduri, Judica
¨
elle
Djeudji Tchaptchet, Damien Richard and their super-
visor
´
Elisabeth Simonetto for 3D manual annotations.
REFERENCES
Abreu, N., Souza, R., Pinto, A., Matos, A., and Pires, M.
(2023). Labelled Indoor Point Cloud Dataset for BIM
Related Applications. Data, 8(6):101.
Angelini, M. G., Baiocchi, V., Costantino, D., and Garzia,
F. (2017). Scan to BIM for 3D reconstruction of the
papal basilica of Saint Francis in Assissi in Italy. The
International Archives of the Photogrammetry, Re-
mote Sensing and Spatial Information Sciences, XLII-
5/W1.
Armeni, I., Sener, O., Zamir, A. R., Jiang, H., Brilakis,
I., Fischer, M., and Savarese, S. (2016). 3d seman-
tic parsing of large-scale indoor spaces. In IEEE/CVF
VISAPP 2025 - 20th International Conference on Computer Vision Theory and Applications
714

Conference on Computer Vision and Pattern Recogni-
tion (CVPR).
Behley, J., Garbade, M., Milioto, A., Quenzel, J., Behnke,
S., Gall, J., and Stachniss, C. (2021). Towards
3D LiDAR-based semantic scene understanding of
3D point cloud sequences. International Journal of
Robotics Research.
Bradley, A., Li, H., Lark, R., and Dunn, S. (2016). BIM for
infrastructure: An overall review and constructor per-
spective. Automation in Construction, 71:139–152.
Chang, A., Dai, A., Funkhouser, T., Halber, M., Niebner,
M., Savva, M., Song, S., Zeng, A., and Zhang, Y.
(2017). Matterport3D: Learning from RGB-D Data
in Indoor Environments. In International Conference
on 3D Vision (3DV).
Cignoni, P., Rocchini, C., and Scopigno, R. (1998). Metro:
Measuring Error on Simplified Surfaces. Computer
Graphics Forum, 17(2):167–174.
Dai, A., Chang, A. X., Savva, M., Halber, M., Funkhouser,
T., and Niessner, M. (2017). Scannet: Richly-
annotated 3d reconstructions of indoor scenes. In
IEEE/CVF Conference on Computer Vision and Pat-
tern Recognition.
Gaydon, C., Daab, M., and Roche, F. (2024). FRACTAL:
An Ultra-Large-Scale Aerial Lidar Dataset for 3D Se-
mantic Segmentation of Diverse Landscapes.
Girardeau-Montaut, D. (2006). D
´
etection de change-
ment sur des donn
´
ees g
´
eom
´
etriques tridimension-
nelles. PhD thesis, T
´
el
´
ecom Paris.
Guo, Y., Li, Y., Ren, D., Zhang, X., Li, J., Pu, L., Ma, C.,
Zhan, X., Guo, J., Wei, M., Zhang, Y., Yu, P., Yang,
S., Ji, D., Ye, H., Sun, H., Liu, Y., Chen, Y., Zhu, J.,
and Liu, H. (2024). LiDAR-Net: A Real-scanned 3D
Point Cloud Dataset for Indoor Scenes.
Hackel, T., Savinov, N., Ladicky, L., Wegner, J. D.,
Schindler, K., and Pollefeys, M. (2017). SE-
MANTIC3D.NET: A NEW LARGE-SCALE POINT
CLOUD CLASSIFICATION BENCHMARK. ISPRS
Annals of the Photogrammetry, Remote Sensing and
Spatial Information Sciences, IV-1/W1:91–98.
Hu, Q., Yang, B., Khalid, S., Xiao, W., Trigoni, N., and
Markham, A. (2021). Towards Semantic Segmen-
tation of Urban-Scale 3D Point Clouds: A Dataset,
Benchmarks and Challenges. In IEEE/CVF Confer-
ence on Computer Vision and Pattern Recognition
(CVPR).
Jung, J., Stachniss, C., Ju, S., and Heo, J. (2018). Auto-
mated 3d volumetric reconstruction of multiple-room
building interiors for as-built BIM. Advanced Engi-
neering Informatics, 38:811–825.
Khoshelham, K., D
´
ıaz Vilari
˜
no, L., Peter, M., Kang, Z., and
Acharya, D. (2017). THE ISPRS BENCHMARK ON
INDOOR MODELLING. The International Archives
of the Photogrammetry, Remote Sensing and Spatial
Information Sciences, XLII-2/W7:367–372.
K
¨
olle, M., Laupheimer, D., Schmohl, S., Haala, N., Rot-
tensteiner, F., Wegner, J. D., and Ledoux, H. (2021).
The Hessigheim 3D (H3D) benchmark on semantic
segmentation of high-resolution 3D point clouds and
textured meshes from UAV LiDAR and Multi-View-
Stereo. ISPRS Open Journal of Photogrammetry and
Remote Sensing, 1:100001.
Li, X., Li, C., Tong, Z., Lim, A., Yuan, J., Wu, Y., Tang, J.,
and Huang, R. (2020). Campus3d: A photogrammetry
point cloud benchmark for hierarchical understanding
of outdoor scene. In Proceedings of the 28th ACM
International Conference on Multimedia.
Munoz, D., Bagnell, J. A., Vandapel, N., and Hebert,
M. (2009). Contextual classification with functional
Max-Margin Markov Networks. In IEEE Conference
on Computer Vision and Pattern Recognition.
Pocobelli, D. P., Boehm, J., Bryan, P., Still, J., and Grau-
Bov
´
e, J. (2018). BIM for heritage science: a review.
Heritage Science, 6(1):1–15.
Qian, G., Li, Y., Peng, H., Mai, J., Hammoud, H., Elho-
seiny, M., and Ghanem, B. (2022). Pointnext: Revis-
iting pointnet++ with improved training and scaling
strategies. In Advances in Neural Information Pro-
cessing Systems, volume 35, pages 23192–23204.
Rottensteiner, F., Sohn, G., Jung, J., Gerke, M., Baillard,
C., B
´
enitez, S., and Breitkopf, U. (2012). The IS-
PRS benchmark on urban object classification and 3D
building reconstruction. ISPRS Annals of Photogram-
metry, Remote Sensing and Spatial Information Sci-
ences, I-3.
Roynard, X., Deschaud, J.-E., and Goulette, F. (2018).
Paris-Lille-3D: A large and high-quality ground-truth
urban point cloud dataset for automatic segmentation
and classification. International Journal of Robotics
Research.
Rozenberszki, D., Litany, O., and Dai, A. (2022).
Language-grounded indoor 3d semantic segmentation
in the wild. In Computer Vision – ECCV 2022, pages
125–141.
Serna, A., Marcotegui, B., Goulette, F., and Deschaud, J.-E.
(2014). Paris-rue-Madame Database - A 3D Mobile
Laser Scanner Dataset for Benchmarking Urban De-
tection, Segmentation and Classification Methods:. In
3rd International Conference on Pattern Recognition
Applications and Methods.
Tan, W., Qin, N., Ma, L., Li, Y., Du, J., Cai, G., Yang, K.,
and Li, J. (2020). Toronto-3D: A Large-scale Mobile
LiDAR Dataset for Semantic Segmentation of Urban
Roadways. In IEEE/CVF Conference on Computer
Vision and Pattern Recognition Workshops (CVPRW).
Vallet, B., Br
´
edif, M., Serna, A., Marcotegui, B., and Papar-
oditis, N. (2015). TerraMobilita/iQmulus urban point
cloud analysis benchmark. Computers & Graphics.
Varney, N., Asari, V. K., and Graehling, Q. (2020). DALES:
A Large-scale Aerial LiDAR Data Set for Semantic
Segmentation. In IEEE/CVF Conference on Computer
Vision and Pattern Recognition Workshops (CVPRW).
Wang, J., Sun, W., Shou, W., Wang, X., Wu, C., Chong, H.-
Y., Liu, Y., and Sun, C. (2015). Integrating BIM and
lidar for real-time construction quality control. Jour-
nal of Intelligent & Robotic Systems, 79:417–432.
Wang, P.-S., Liu, Y., Guo, Y.-X., Sun, C.-Y., and Tong, X.
(2017). O-CNN: octree-based convolutional neural
3DSES: An Indoor Lidar Point Cloud Segmentation Dataset with Real and Pseudo-Labels from a 3D Model
715

networks for 3D shape analysis. ACM Transactions
on Graphics, 36(4):72:1–72:11.
Wu, X., Lao, Y., Jiang, L., Liu, X., and Zhao, H. (2022).
Point Transformer V2: Grouped Vector Attention and
Partition-based Pooling. Advances in Neural Informa-
tion Processing Systems, 35:33330–33342.
Yang, Y.-Q., Guo, Y.-X., Xiong, J.-Y., Liu, Y., Pan, H.,
Wang, P.-S., Tong, X., and Guo, B. (2023). Swin3D:
A Pretrained Transformer Backbone for 3D Indoor
Scene Understanding.
Ye, Z., Xu, Y., Huang, R., Tong, X., Li, X., Liu, X., Luan,
K., Hoegner, L., and Stilla, U. (2020). LASDU: A
Large-Scale Aerial LiDAR Dataset for Semantic La-
beling in Dense Urban Areas. ISPRS International
Journal of Geo-Information, 9(7):450.
Yeshwanth, C., Liu, Y.-C., Nießner, M., and Dai, A.
(2023). Scannet++: A high-fidelity dataset of 3d in-
door scenes. In International Conference on Com-
puter Vision (ICCV).
Zolanvari, I., Ruano, S., Rana, A., Cummins, A., Smolic,
A., Da Silva, R., and Rahbar, M. (2019). DublinCity:
Annotated LiDAR Point Cloud and its Applications.
In 30th British Machine Vision Conference.
VISAPP 2025 - 20th International Conference on Computer Vision Theory and Applications
716
