
Navigating Points of Interest: The Dog-Walker Pathfinding Algorithm
Natsuki Tsutsui
a
and Shohei Yokoyama
b
Graduate School of System Design, Tokyo Metropolitan University, Hino, Tokyo, Japan
Keywords:
Geographic Information System, Pathfinding Algorithm, Flickr.
Abstract:
Navigating complex environments that encompass both road networks and points of interest (POIs) demands
innovative pathfinding solutions. Traditional algorithms, such as Dijkstra’s, primarily focus on finding the
shortest path between nodes on a graph and are not designed to handle the additional complexity of scattered
POIs. This paper introduces the dog-walker pathfinding algorithm, a novel approach that integrates the discov-
ery of waypoints and greedy routing into a single process. By simulating the dynamics between two agents—a
dog motivated by POIs and a walker navigating a graph—the algorithm dynamically identifies routes that con-
nect key locations and pass through areas rich in POIs. This method leverages road networks and POIs to
provide routes from the start point to the end point tailored to user preferences. Owing to the minimal data
requirements for POIs, this method can be easily integrated with various data sources, including X( formerly
Twitter), Google Maps, and Instagram. In this study, we develop an agent-based online algorithm inspired by
the dogwalker. We verified the algorithm using POI data obtained from Flickr and Google Maps, demonstrat-
ing its application in real-world scenarios such as recommending tourist routes. Demonstrations show that
our algorithm effectively generates routes that align with user preferences, as evidenced by qualitative and
quantitative assessments. Additionally, we demonstrated that our method operates more rapidly than methods
utilizing Dijkstra’s algorithm.
1 INTRODUCTION
Pathfinding algorithms are essential for numerous ap-
plications related to real-world mobility. They are
widely used for finding the shortest route between
two points in large graph data, such as road maps.
Additionally, these algorithms help manage complex
queries such as route optimization, automated driv-
ing, and tourist route recommendations.
In this paper, we introduce the dog-walker algo-
rithm, a novel method designed to find routes that
cater to user interests within large graph data spaces
with numerous point of interest(POIs).
The proposed method utilizes data from Open
Street Map
1
and Flickr
2
. Figure 1 illustrates the tar-
geted spatial area. By integrating geographical infor-
mation and social media content, this approach en-
riches the analysis and enhances the precision of the
methodological application. In our graph, road net-
work edges are depicted by blue lines, while POIs are
a
https://orcid.org/0009-0000-2390-5572
b
https://orcid.org/0000-0002-0550-617X
1
https://www.openstreetmap.org/copyright/en
2
https://www.flickr.com
represented by red dots. The algorithm identifies ef-
ficient routes in such spaces, favoring regions with a
high density of POIs.
Traditionally, algorithms such as Dijkstra’s are
used to find optimal routes on graphs. However, these
methods are not equipped to handle spaces where
both graphs and POIs coexist, as targeted in this study.
In typical road networks, nodes are placed at inter-
sections, but our usual start and end points, such as
buildings or parking lots, are not directly on the road.
Similarly, most landmarks do not reside directly on
the road.
This concept is particularly suited for applications
using geosocial big data. For instance, consider the
graph as a road network and the POIs as geotagged
photos shared on social media sites. A geotag rep-
resents the latitude and longitude coordinates where
the photo was taken, provided by the GPS of a smart-
phone or other device. Locations with a high den-
sity of geotags are noteworthy. Geotags often exist
independently from the road network and may have a
fuzzy density distribution due to GPS errors.
The objective of the proposed method is to dis-
cover routes on the road network that pass through
Tsutsui, N. and Yokoyama, S.
Navigating Points of Interest: The Dog-Walker Pathfinding Algorithm.
DOI: 10.5220/0013238800003935
In Proceedings of the 11th International Conference on Geographical Information Systems Theory, Applications and Management (GISTAM 2025), pages 27-38
ISBN: 978-989-758-741-2; ISSN: 2184-500X
Copyright © 2025 by Paper published under CC license (CC BY-NC-ND 4.0)
27
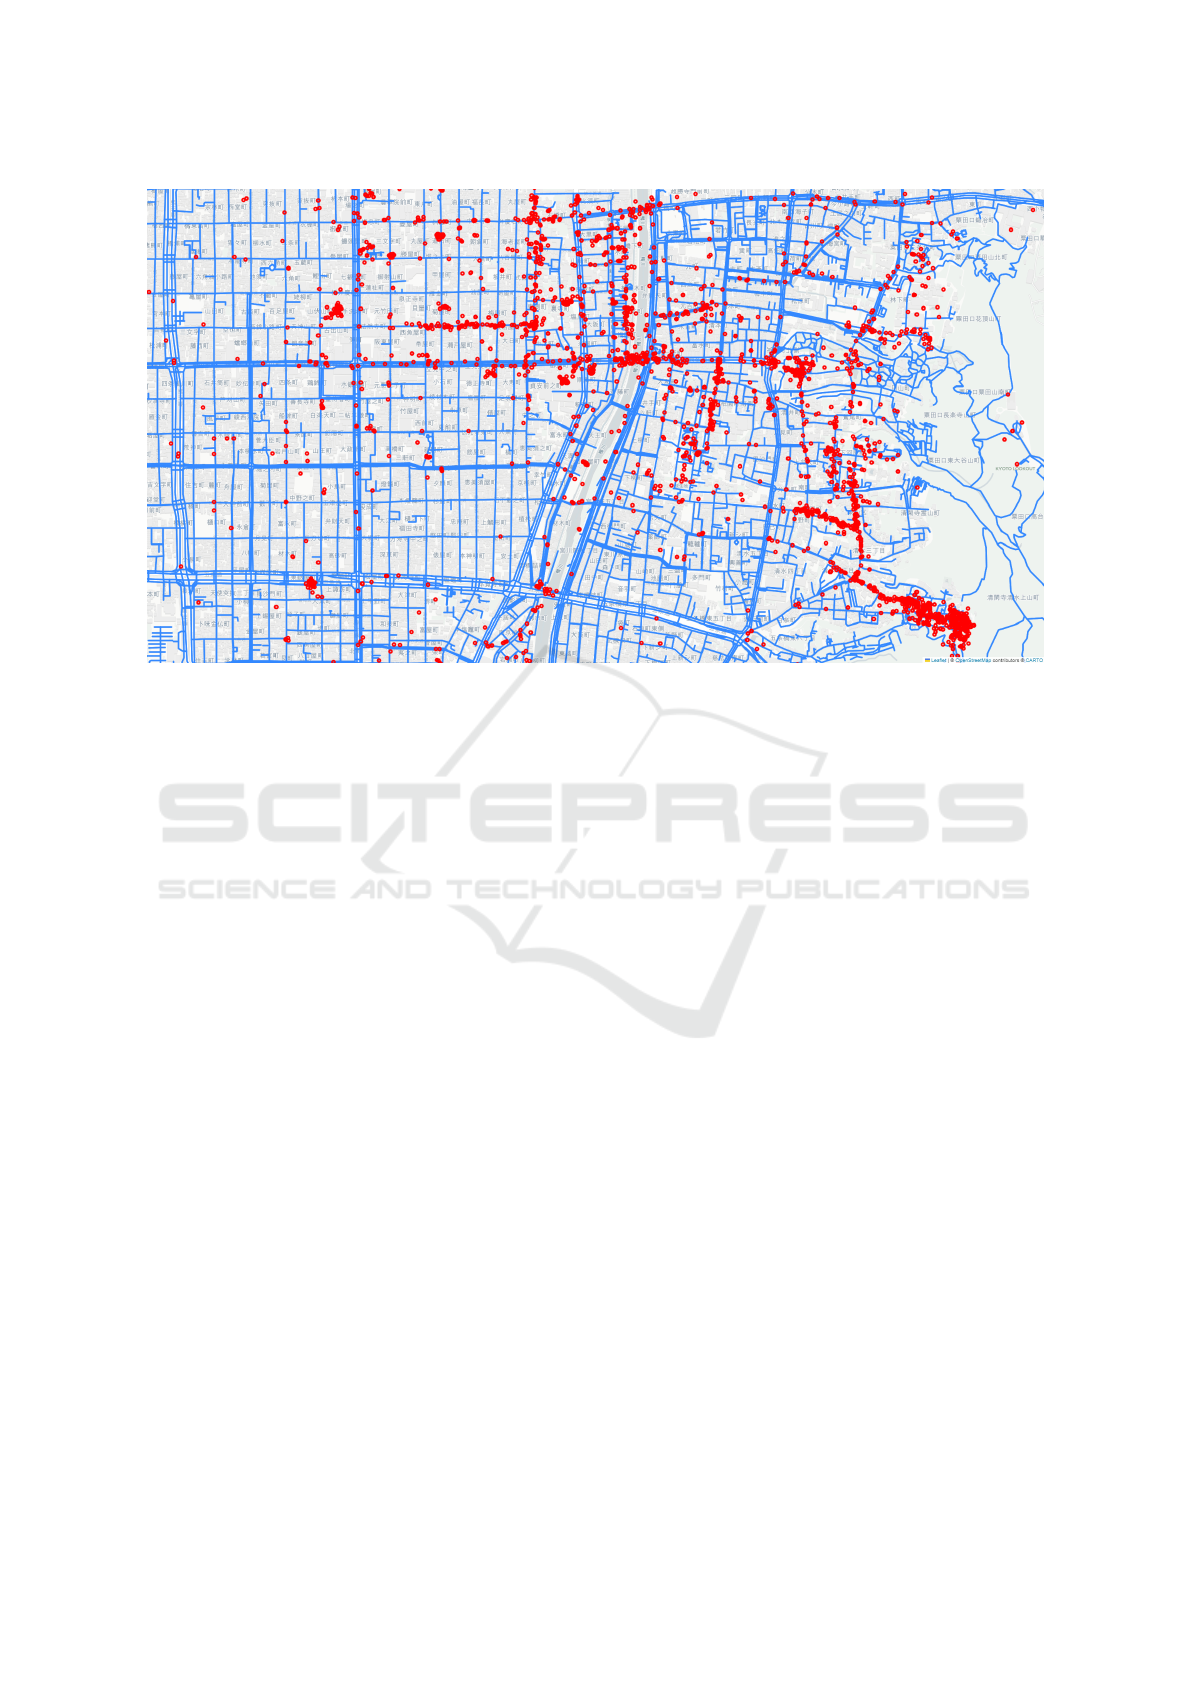
Figure 1: OpenStreetMap data in Kyoto Prefecture, Japan. Blue lines represent road network edges and red dots represent
POIs.
locations with a high density of POIs that are not di-
rectly on the road network but exist in the same space.
This algorithm can be applied to recommend
sightseeing routes based on geosocial data. Con-
ventionally, recommending tourist routes required
two steps: recommending waypoints and discover-
ing routes connecting them. For example, POIs are
density-clustered by DBSCAN, and routes are dis-
covered using nodes in the cluster as waypoints. In
contrast, the proposed method is an online algorithm
that simultaneously discovers waypoints and optimal
routes.
The dog-walker pathfinding algorithm works on
the principle of two agents: a dog and a walker. The
walker navigates the graph, while the dog moves in-
dependently within a two-dimensional space, moti-
vated by POIs. The dog and walker are linked by a
lead, with the walker propelled in the direction the
dog wishes to go. The dog, motivated by POIs acting
as food, moves toward areas where POIs are abun-
dant. Once the dog has consumed enough POIs, it
gravitates toward its goal. The path that the walker
takes, led by the dog, is the output of this algorithm,
anticipated to pass through areas with a high density
of POIs.
The contributions of this study are as follows.
1. Identifying waypoints based on POIs.
2. Discovering efficient routes around waypoints.
3. Developing an algorithm that combines the above
two steps.
4. Creating agent-based online algorithms inspired
by the dog-walker concept.
5. Demonstrating a strong relevance to real-world
applications.
In this study, we qualitatively and quantitatively
evaluated the recommended routes assuming user
preferences using geosocial data, and the results in-
dicated that route recommendations were effectively
made.Additionally, we demonstrated that our method
operates more rapidly than methods utilizing Dijk-
stra’s algorithm.
The remainder of this paper is structured as fol-
lows: Section 2 covers related work, Section 3 details
our proposed method, Section 4 presents the experi-
ments, and Section 5 concludes the paper and outlines
future work.
2 RELATED WORK
Research utilizing geotagged social data has explored
not only route recommendations based on user pref-
erences but also methods that consider various fac-
tors such as time, distance, route safety, weather, and
crowding as costs in the calculation. Additionally,
studies have focused on identifying popular tourist
spots using geotagged social data.
Yang et al. (Yang et al., 2011) proposed a ver-
satile and highly accurate method for identifying
tourist spots using geotagged social data collected
GISTAM 2025 - 11th International Conference on Geographical Information Systems Theory, Applications and Management
28

from Flickr in Paris, Hong Kong, and New York.
This method employs self-tuning spectral lustering,
which does not require parameter settings, allowing
for consistent clustering applicable to cities and loca-
tions with different POI characteristics.
Chen et al. (Chen et al., 2011) proposed a per-
sonal trajectory prediction system based on GPS data,
using a new algorithm called Continuous Route Pat-
tern Mining to extract route patterns. This system pre-
dicts future routes by utilizing route patterns extracted
from an individual’s past trajectory data. Popescu
et al. (Popescu and Grefenstette, 2009) developed a
method to estimate visit times and daily tourist routes
using geotagged social data from Flickr in London,
New York, Paris, and San Francisco. The proposed
method automatically estimates visit times to tourist
locations by utilizing the timestamps and location in-
formation of photos posted by users. Kurashima et
al. (Kurashima et al., 2010) proposed a system that
models the history of places visited by tourists us-
ing geotagged social data from Flickr in New York
and San Francisco. This system recommends travel
routes based on the user’s current location and in-
dividual interests, leveraging data from large-scale
photo-sharing sites for route recommendations, un-
like previous studies that utilized GPS data. Ishizaki
et al. (Ishizaki et al., 2021) introduced an algorithm
called P-UCT that recommends routes best match-
ing user preferences. The method includes gener-
ating evaluators using Support Vector Machine and
route generation using Monte-Carlo Tree Search. Jie
et al. (Bao et al., 2012) developed a system that auto-
matically learns user preferences from location his-
tories and extracts local expert opinions to provide
recommendations. This system utilizes data collected
from Foursquare in New York and Los Angeles. All
of these route recommendation and estimation meth-
ods require user movement records and specific data
sources, leading to challenges in data acquisition and
the insufficiency of necessary data in certain regions.
De et al. (De Choudhury et al., 2010) proposed
a method for generating tourist routes using geo-
tagged social data from Flickr. This method uses
geographic and temporal information to create timed
paths based on each user’s visited locations, stay du-
rations, and travel times. By applying an orienteering
problem algorithm (Tsiligirides, 1984), the system
recommends optimal travel routes. Furthermore, Ma-
jid et al. (Majid et al., 2015) introduced a method for
recommending suitable tourist destinations and travel
routes using geotagged social data from Flickr, tourist
data from Google Places, and historical weather data.
These studies differ from our research in that they re-
quire pre-existing information about tourist spots for
route recommendations. Jain et al. (Jain et al., 2010)
proposed a system called Antourage to recommend
tourist routes using geotagged social data from Flickr.
In this method, users specify a starting point and a
maximum travel distance, and the system suggests
routes that visit popular tourist destinations within
those constraints. The route exploration algorithm
employs the Max-Min Ant System, a metaheuristic
algorithm developed based on the behavior of real
ants, as proposed by Dorigo et al. (Dorigo et al.,
1996) (Dorigo and Gambardella, 1997) (Dorigo and
Di Caro, 1999). It is primarily applied to combina-
torial optimization problems and is particularly effec-
tive for the Traveling Salesman Problem (TSP). This
algorithm consists of pheromone trails, pheromone
updates, probabilistic path exploration, and an itera-
tive process. Antourage recommends tours that visit
popular tourist destinations; however, its optimization
algorithm is time-consuming, making it unsuitable for
online processing.
Kim et al. (Kim et al., 2014) proposed a nav-
igation system called SocRoutes, which uses crime
history data from Chicago and geotagged social data
from X to suggest routes based on the regional con-
text, particularly emotions. Unlike traditional naviga-
tion systems that suggest routes based on the shortest
distance or fastest time, SocRoutes considers emo-
tional context when suggesting routes. Fu et al.
(Fu et al., 2014) introduced TREADS, a travel route
recommendation system that leverages social media
data, specifically X and Yelp reviews, to recom-
mend safe and interesting travel routes in real time.
TREADS takes into account the user’s interests and
safety, employing text summarization techniques to
provide summaries of X data and Yelp reviews related
to the locations on the recommended route. Quercia
et al. (Quercia et al., 2014) developed a system that
recommends not only the shortest route in urban areas
but also emotionally pleasant routes. They retrieved
the top k-shortest paths and evaluated these routes us-
ing geotagged data based on criteria such as “beau-
tiful,” “quiet,” and “happy.” These route exploration
methods are designed for specific purposes, unlike
our research, which aims to integrate multiple user
preferences and interests.
Yamashita et al. (Yamashita and Yokoyama, 2022)
proposed a method for recommending routes based
on user preferences by dividing a map into a grid and
assigning weights to the edges of the graph based
on nighttime light data and geotagged tweets from
X. They applied Dijkstra’s algorithm to find opti-
mal routes. While this method shares similarities
with our research in terms of integrating various data
sources and recommending routes based on user pref-
Navigating Points of Interest: The Dog-Walker Pathfinding Algorithm
29

erences, it relies on Dijkstra’s algorithm (Dijkstra,
1958), which tends to avoid recommending routes
that significantly deviate from the shortest path. In
contrast, our study allows for adjusting the extent to
which POIs are collected based on parameters, thus
recommending more interesting detours.
3 PROPOSED METHOD
This section details the proposed method. Figure 2
provides an overview of our methodology, which is
divided into three phases: dataset, preprocessing, and
main processing.
The dataset phase consists of POI data (Section
3.1) and road network data (Section 3.2). During pre-
processing, we extract specific POIs from the POI
data (Section 3.3) and remove dead-end nodes from
the road network (Section 3.4), overlaying them onto
the same plane. We then assign POIs to each node
(Section 3.5) and precompute the interest vectors
(Section 3.6). In the main processing phase, we set
start and end points on the preprocessed data, ap-
ply Dijkstra’s algorithm (Section 3.7) to construct
the shortest path tree, and execute the dog-walker
pathfinding algorithm (Section 3.8).
Additionally, “POIs-on-map” refers to the situa-
tion where POIs overlap on the road network, while
“Weighted POIs-on-map” indicates a state where data
has been preprocessed, with POIs assigned to each
node.
3.1 Data on POIs
We use geotagged POI data for route searching. The
POI data requires only coordinate information on a
two-dimensional plane (latitude and longitude), mak-
ing it applicable to various data sources.
We utilize geotagged data shared on social net-
working services as POI data. Geotags represent the
coordinates where the data were posted, suggesting
that areas with high geotag density may contain points
of interest. Therefore, our method suggests a route
that includes waypoints densely populated with geo-
tags en route to the destination. We have employed
data from sources such as Flickr and Google Maps
3
;
however, our methodology is adaptable to various
sources, including Instagram
4
and X
5
, allowing for
the integration of different data sources.
3
https://www.google.com/maps
4
https://www.instagram.com
5
https://www.x.com
3.2 Road Network
We define the road network as a simple undirected
graph with non-negative weights, excluding one-way
streets. The graph is denoted as G = (V, E), where V
represents the set of nodes, and E represents the edges
of the road network. Each edge is represented as an
unordered pair of vertices, u, v ∈ V , where (u, v) ∈ E
and u ̸= v.
The cost between nodes is represented as w(u, v),
where w(u, v) = w(v, u) and w(u, v) > 0. Each node
has associated two-dimensional coordinate informa-
tion; if the coordinates of nodes u and v are x
u
and x
v
,
respectively, then x
x
x
u
u
u
̸= x
x
x
v
v
v
when u ̸= v.
Furthermore, we denote the straight-line distance
between coordinates x
x
x
u
u
u
and x
x
x
v
v
v
as l(x
x
x
u
u
u
,
,
, x
x
x
v
v
v
). However,
l(x
x
x
u
u
u
,
,
, x
x
x
v
v
v
) does not necessarily equal w(u, v) because
real-world roads are not composed of straight lines.
3.3 Extraction POIs
The extracted POIs contain various metadata depend-
ing on the dataset. For instance, Flickr provides meta-
data such as latitude and longitude, images, creation
time, text, and tags. Google Maps might include re-
views and store names. These metadata are used to
extract subsets according to user preferences. For in-
stance, data extracted from Flickr using the text “tem-
ple,” can be used by tourists interested in visiting tem-
ples.
In this study, we focus on the dog-walker pathfind-
ing algorithm and do not discuss the method of ex-
tracting data based on user preferences. However, our
method assumes that the POIs, based on user prefer-
ences, only require latitude and longitude, making it
compatible with various datasets.
3.4 Removal of Dead-End Nodes
The proposed method relies on the dog agent moving
toward POIs, which makes it vulnerable at dead-end
nodes. This occurs because the dog agent is drawn
to the POIs regardless of dead ends, leading to a loop
when a waypoint exists beyond the dead-end node.
To ensure efficient navigation, a preprocessing step is
necessary to remove these nodes. Therefore, we re-
moved the dead-end nodes using the existing method
by Jiyoung et al (Pung et al., 2022).
We remove edges connected to nodes of degree
one, ensuring that each node v in the graph G satisfies
deg(v) ≥ 2.
Additionally, road networks often represent the
same street with two edges separated by lanes, such
as in multilane roads. Thus, merely deleting nodes
GISTAM 2025 - 11th International Conference on Geographical Information Systems Theory, Applications and Management
30
Figure 2: Overview of proposed method.
of degree one does not completely remove dead-end
nodes. However, this issue is peripheral to our core
problem and will not be further discussed here.
The preprocessed road network graph and the ex-
tracted POIs are combined on the same plane as POIs-
on-map, which is then passed on to the subsequent
processing.
3.5 Assigning POIs
For each node, we record a set of POIs within a dis-
tance L[m] (in m). To calculate the distance between a
node and a POI, we use the Haversine formula, which
treats the Earth as a perfect sphere using spherical
trigonometry. If the longitude and latitude of point
A are (φ
a
, ψ
a
) and those of point B are (φ
b
, ψ
b
), the
distance between points A and B is given by the fol-
lowing formula:
L = R cos
−1
(sinψ
a
sinψ
b
+ cos ψ
a
cosψ
b
cos∆φ)
(1)
As shown in Figure 3, when an agent reaches a
node, the POIs recorded at that node are considered
to be collected by the dog agent. The nodes that have
been collected in this manner no longer influence sub-
sequent route searching. This process is detailed fur-
ther in Section 3.8, “Execution of the Dog-Walker
Pathfinding Algorithm.”
3.6 Calculation of Interest Vectors
For each node, the sum of the dog’s interest vectors
for all POIs is calculated using the following formula:
d(
(
(x
x
x
i
i
i
,
,
, x
x
x
p
p
p
)
)
) =
1
|x
x
x
p
p
p
− x
x
x
i
i
i
|
n
(x
x
x
p
p
p
− x
x
x
i
i
i
) (2)
I
I
I
D
D
D
i
i
i
=
∑
p∈P
d(
(
(x
x
x
i
i
i
,
,
, x
x
x
p
p
p
)
)
) (3)
Figure 3: Collection method of POI by the dog agent in the
proposed route recommendation system. The walker agent
(depicted as a human silhouette) remains at the reached
node, while the dog agent (depicted as a dog silhouette) col-
lects POI (red circles) within a defined radius (black circle)
around the node.
Description 1. Blue lines represent road network
edges and red points represent POI.
Here, P represents the set of POIs, x
x
x
p
p
p
is the posi-
tion vector of a POI, x
x
x
i
i
i
is the position vector of a node,
and n is a parameter that determines the weight given
to distance. A larger value of n indicates a greater in-
terest in nearby POIs. The dog agent determines its
next node based on this interest vector I
I
I
D
D
D
i
i
i
.
3.7 Application of Dijkstra’s Algorithm
When a user specifies the start and end points in lat-
itude and longitude, the nearest nodes are identified
and assigned as the respective start and end points.
Subsequently, Dijkstra’s algorithm is applied starting
from the end node to construct the shortest path tree,
recording the parent of each node in the process. This
Navigating Points of Interest: The Dog-Walker Pathfinding Algorithm
31

information enables the walker agent to navigate to-
ward the end node.
This process is initiated after the user provides the
start and end points, thus constituting a part of the on-
line processing phase. As such, Dijkstra’s algorithm
incurs a computational cost of O(N logM), where N
represents the number of nodes and M the number of
edges.
3.8 Execution of the Dog-Walker
Pathfinding Algorithm
This section describes the dog-walker pathfinding al-
gorithm. In the proposed method, the agent begins at
the start node and follows these steps until it reaches
the end node: (1) retrieve POIs, (2) recalculate the
interest vector, and (3) determine the next node.
3.8.1 Retrieval of POIs
The dog agent collects POIs within a radius of L[m]
from the reached node and stores them in a set. Once
collected, these POIs no longer influence any node.
The targeted POIs are assigned to nodes during pre-
processing, and except when L is excessively large,
the overall computational complexity remains within
approximately O(|P|). (|P| is the number of POIs)
As the collected POIs no longer have any influ-
ence, it is necessary to recalculate the interest level
when deciding the next node. The method for recal-
culating this interest level is detailed in the following
section.
3.8.2 Recalculate the Interest Vector
When the agent decides the next node, it calculates
the interest vector I
i
following the formula:
I
I
I
i
i
i
= CI
I
I
D
D
D
i
i
i
+ I
I
I
W
W
W
i
i
i
(4)
Here, I
I
I
D
D
D
i
i
i
represents the dog’s interest vector for
POIs at the current node that have not yet been col-
lected, while I
I
I
W
W
W
i
i
i
represents the walker’s interest vec-
tor. Therefore, the interest vector I
I
I
i
i
i
for the agent is
determined by the sum of the interest vectors of both
the dog and the walker. Additionally, C is a parameter
that dictates whether the dog or walker has a greater
influence on decision-making.
As the movement of the node is determined by the
direction of the vector I
I
I
i
i
i
, scalar values are essentially
meaningless in this context. Therefore, the parameter
is set for only one of the terms.
I
I
I
D
D
D
i
i
i
=
∑
p∈P
d(
(
(x
x
x
i
i
i
,
,
, x
x
x
p
p
p
)
)
) −
∑
q∈Q
d(
(
(x
x
x
i
i
i
,
,
, x
x
x
q
q
q
)
)
)
∑
p∈P\Q
d(
(
(x
x
x
i
i
i
,
,
, x
x
x
p
p
p
)
)
)
(5)
Here, Q is the set of collected POIs. If the set of
collected POIs is less than half of the total POIs, the
calculation is done by subtracting from the prepro-
cessed interest vectors. If more than half, the interest
vectors of the uncollected POIs are added to find the
dog’s interest vector. This yields the same result with
either formula, regardless of the number of collected
POIs. However, for a large number of POIs, or when
few POIs are collected, this can significantly reduce
execution time.
Additionally, I
I
I
W
W
W
i
i
i
is calculated according to the fol-
lowing formula:
I
I
I
W
W
W
i
i
i
=
L
now
L
min
d(
(
(x
x
x
i
i
i
,
,
, x
x
x
j
j
j
)
)
) (6)
Here, j denotes the parent node of i, and x
x
x
j
j
j
and
x
x
x
i
i
i
represent the coordinates of these nodes, respec-
tively. L
min
is the shortest path length from the origin
to the destination calculated a priori using Dijkstra’s
algorithm, while L
now
denotes the cumulative distance
traveled by the agent from the start node to its current
node. Consequently, as the path length increases, the
walker agent experiences a stronger compulsion to-
ward the end node.
3.8.3 Determining the Next Node
The next node is determined by selecting the node that
has the highest cosine similarity between the direction
vector from the current node to an adjacent node and
the interest vector.
k = argmax
j
I
I
I
i
i
i
· v
v
vi, j
|I
I
I
i
i
i
||v
v
v
i, j
|
(i, j ∈ E) (7)
Here, v
v
v
i, j
represents the direction vector from
node i to node j. If the next node is not the end node,
the agent repeats this process starting from the POI
collection phase.
Our method requires calculating the influence
from each POI as the agent moves between nodes,
which can be time-consuming for route search. The
worst-case computational complexity of the route
search is the product of the number of nodes tra-
versed and the total number of POIs used. There-
fore, the computational complexity increases propor-
tionally with the number of POIs. However, as the
POIs collected by the agent do not affect subsequent
route searches, the number of POIs that influence the
search decreases as the search progresses. Moreover,
if the influence of all POIs and the set of nearby POIs
is precomputed for each node during preprocessing,
the actual execution time becomes significantly faster
than the theoretical computational complexity.
GISTAM 2025 - 11th International Conference on Geographical Information Systems Theory, Applications and Management
32

4 EXPERIMENTS
In this section, we describe the datasets used, and
present the results and analyses of the experiments.
4.1 Datasets
4.1.1 Flickr
Flickr is a photo-sharing platform that allows users
to upload, share, and tag photographs and videos. It
features an extensive database of billions of images,
many of which are geotagged. This geotagged data
have been utilized in a wide range of fields, including
geographic information system (GIS) research, com-
puter vision, and social sciences for analysis and vi-
sualization purposes.
However, our proposed method does not rely on
user movement histories or images, which enhances
its compatibility with data sources other than Flickr.
In this study, Flickr was chosen because of the ease of
data acquisition and the large scale of its data sources.
4.1.2 Google Maps
Google Maps is a Web-based mapping service that
provides satellite imagery, street maps, panoramic
street views (street views), real-time traffic condi-
tions (Google Traffic), and route planning for walk-
ing, driving, cycling, and public transit. As a rich
source of geographic data, Google Maps been exten-
sively used in various fields, including urban plan-
ning, transportation, and tourism. Detailed and fre-
quently updated data aid precise planning and analy-
sis of spatial patterns.
In our research, Google Maps was selected as the
second source of POIs data because of the ease of data
acquisition and availability of additional information
such as reviews.
4.1.3 Open Street Map
Open Street Map is a free user-generated database of
map data that offers a comprehensive array of geo-
graphic information, including roads, buildings, and
terrain, from around the world. This platform is an
open-source project that allows map data to be freely
used for both commercial and non-commercial pur-
poses.
Open Street Map data are utilized in a variety of
applications such as location-based services, naviga-
tion tools, urban planning, and transportation system
research.
4.2 Experimental Setting
For our experiments, we used Flickr data spanning
three years, from January 1, 2021 to January 1, 2024.
Data for specific segments in Times Square, Manhat-
tan, New York, USA, and Kyoto City, Kyoto Prefec-
ture, Japan were gathered from Flickr, Google Maps,
and OpenStreetMap. These datasets includes POIs
and road network data.
From Flickr, we extracted posts within the tar-
geted segments that included relevant keywords in
their descriptions or tags. Data extraction from
Google Maps was conducted manually, selecting ap-
propriate content within the targeted segments. The
acquired road network data consisted of walker path-
ways within the designated segments.
In each experiment, we collected POIs and road
network data within specified geographical bound-
aries. For Times Square, the collection was within
the latitude range of 40.745149 to 40.767065 and
longitude range of -73.996706 to -73.970711. Sim-
ilarly, in Kyoto, the data were gathered within lati-
tude 34.99054 to 34.99940 and longitude 135.76802
to 135.78408.
The acquired road network data consisted of
walker pathways within the designated segments.
4.3 Experimental Result and Analysis
4.3.1 Experiments with Flickr Data
We conducted experiments using data from Flickr on
Times Square, Manhattan, New York to validate our
proposed method. Figure 4 (a) illustrates the results
of a route search from latitude 40.74510, longitude -
73.99670 to latitude 40.76710, longitude -73.97080,
restricted to posts containing the text ‘cityscape.’ The
blue route represents the shortest path, while the or-
ange route depicts the path determined by our pro-
posed method. Figure 4 (b) illustrates the results of
a route search restricted to posts containing the text
“art” in the same section.
Figure 5 shows the waypoints traversed by the
route determined by our proposed method, as il-
lustrated in Figure 4. The first waypoint is along
the 7th Avenue, a well-known and bustling area in
Times Square. The next waypoint spans horizon-
tally at the Top of the Rock observation deck, where
most posts focus on the night view. Furthermore,
for routes tagged with ’art’, after navigating several
smaller waypoints, the route notably passes through a
significant waypoint at The Museum of Modern Art
(MoMA).
These figures demonstrate that the route generated
by our proposed method effectively passes through
Navigating Points of Interest: The Dog-Walker Pathfinding Algorithm
33
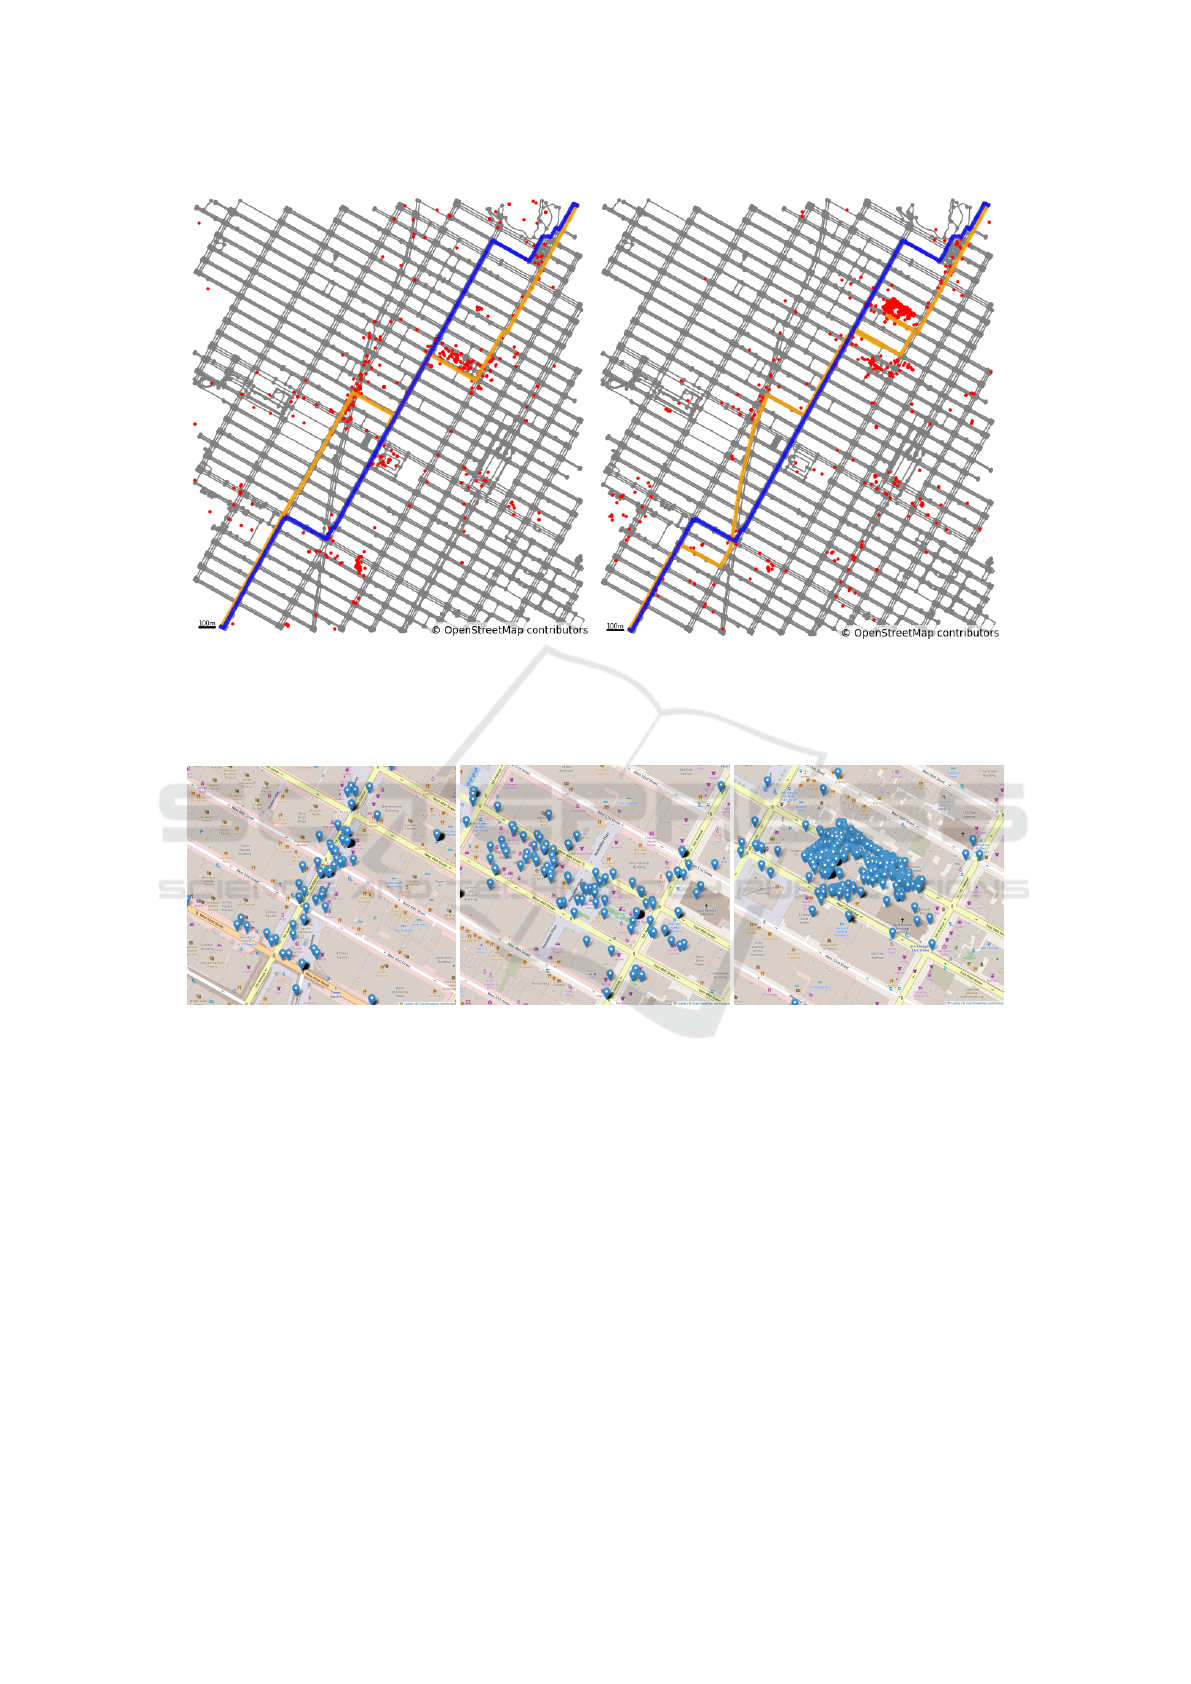
(a) cityscape (b) art
Figure 4: Results of the experiment that used the proposed method with Flickr data in parts of Manhattan, New York, USA.
The gray, blue, and orange lines represent the road network, shortest route, and recommended route derived using the proposed
method. Red dots represent POIs.
(a) 7th Avenue (b) Top of the Rock (c) MoMa
Figure 5: Details of waypoints passed by the proposed method in Times Square.
waypoints associated with the text ‘cityscape’ and
‘art’ within the area.
4.3.2 Experiments with Google Maps and Flickr
Data
In Kyoto City, Kyoto Prefecture, we conducted ex-
periments using data from Google Maps and Flickr
to validate our proposed method. Figure 6 visu-
alizes POIs related to ‘temple’ buildings along the
popular tourist route from Kiyomizu-Gojo Station to
Kiyomizu-dera Temple. In the experiments using
Google Maps data, temples within the segment were
designated as POIs, which are listed in Table 1.
Posts containing the keyword ‘temple’ within the
studied segment were extracted from the Flickr data.
In each figure, the blue and orange routes depict the
shortest and recommended paths, respectively.
Figure 7 details the waypoints passed by the route
recommended by our proposed method shown in Fig-
ure 6. The first encountered waypoint is the Yasaka
Pagoda at Hokan-ji Temple, a renowned photographic
landmark. The next waypoint is Kiyomizu-zaka, a
major street leading to the Kiyomizu-dera Temple.
These figures demonstrate that the route generated by
our proposed method effectively passes through loca-
tions with POIs while heading toward the end node.
4.3.3 Experiments on Execution Time
We compared the execution times of the proposed
method with those of a baseline method, utilizing the
GISTAM 2025 - 11th International Conference on Geographical Information Systems Theory, Applications and Management
34
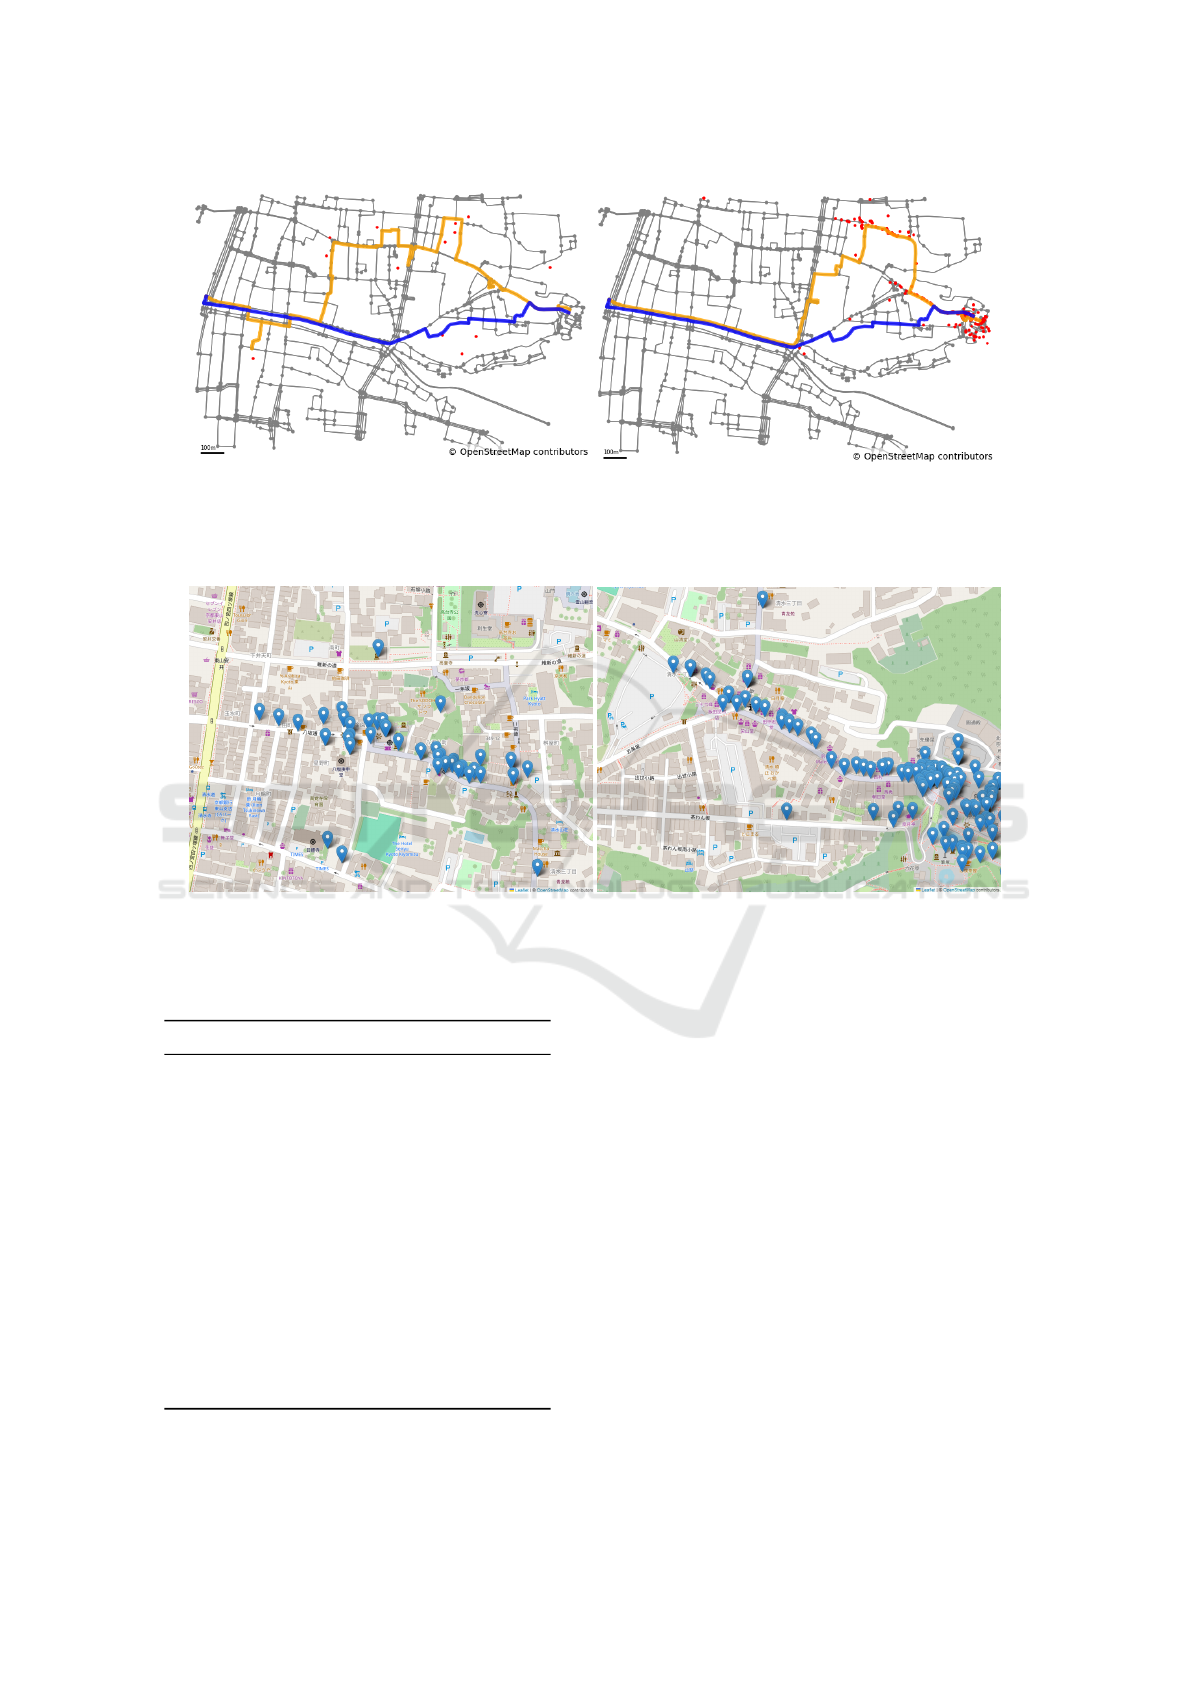
(a) using Google Maps data (b) using Flickr data
Figure 6: Results of the experiment conducted using the proposed method with Google Maps and Flickr data in Kyoto City,
Kyoto Prefecture, Japan. The gray, blue, and orange lines show the road network, shortest route, and recommended route
derived using the proposed method. Red dots represent POIs related to ‘temple.’.
(a) Hokan-ji Temple (b) kiyomizu-zaka
Figure 7: Details of waypoints passed by the proposed method in Kyoto.
Table 1: Coordinates of temples located in the target sec-
tion.
temple name latitude longitude
Rokuharamitsu-ji 34.99722 135.77336
Rokudouchinnou-ji 34.99839 135.77537
Shoumyou-ji 34.99422 135.77081
Kiun-ji 34.99153 135.78051
Jippo-ji 34.99445 135.77829
Honju-ji 34.99464 135.77910
Saifuku-ji 34.99931 135.77395
Nittai-ji 35.02649 135.79178
Daizen-ji 34.99803 135.77891
Hofuku-ji 34.99634 135.77643
Hokan-ji 34.99872 135.77926
Kongo-ji 34.99851 135.77869
Tsumyoji 34.99405 135.77898
Kosho-ji 34.99698 135.78269
Juen-ji 34.99839 135.77116
road network of Times Square and artificially gener-
ated POIs. The baseline method employed two ap-
proaches: a simple execution of Dijkstra’s algorithm
between the start and end points, and an integrated
approach combining DBSCAN clustering with Dijk-
stra’s algorithm For this comparison, we measured
only the execution time of the main processing after
the user’s start and end points had been provided.
In the proposed method, we generated a shortest
path tree using Dijkstra’s algorithm and subsequently
executed the dog-walker pathfinding algorithm, mea-
suring the duration required. For this analysis, we
configured the proposed method with parameters that
ensured all waypoints were visited, meeting the con-
ditions of the baseline method. In Baseline Method
1, we calculated the execution time of Dijkstra’s al-
gorithm from the start point to the endpoint. In the
baseline method 2, the route from the start to the end
node was calculated multiple times using Dijkstra’s
algorithm to ensure all given waypoints were visited,
Navigating Points of Interest: The Dog-Walker Pathfinding Algorithm
35
(a) Number of waypoints is 3
(|POIs| = 30)
(b) Number of waypoints is 4
(|POIs| = 60)
(c) Number of waypoints is 5
(|POIs| = 90)
(d) Number of waypoints is 6
(|POIs| = 120)
(e) Number of waypoints is 7
(|POIs| = 150)
(f) Number of waypoints is 8
(|POIs| = 180)
Figure 8: POIs-on-map using artificial data.
(a) Manhattan (b) Kyoto
Figure 9: Distribution of the shortest distance between each POI and route.
and we compared the execution times. Here, the pro-
cessing time for DBSCAN in the baseline method was
not included in the computation time because it can
be performed during preprocessing. Thus, the execu-
tion time for the baseline method is proportional to
the time spent on Dijkstra’s algorithm. Additionally,
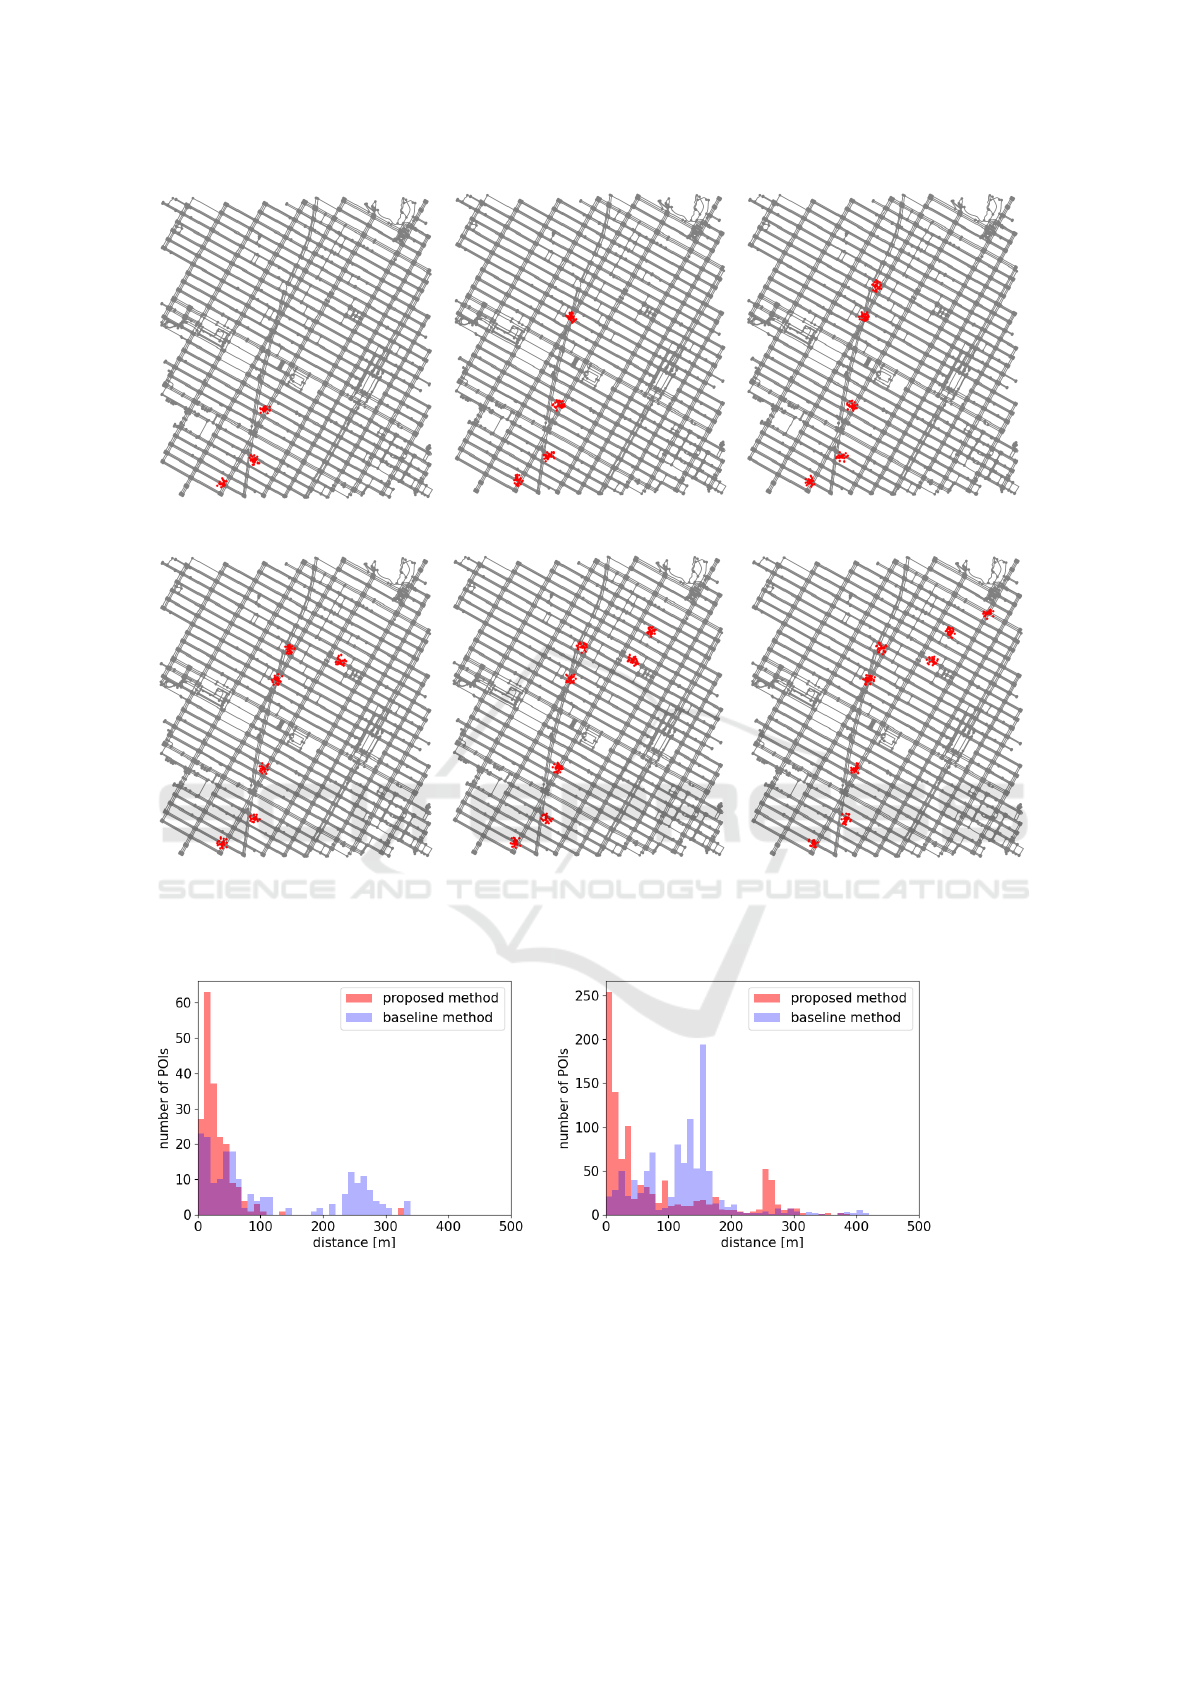
The waypoints generated for the experiment has 30
POIs each, randomly generated within a 50m radius
from the center point to account for GPS errors.
Figure 8 illustrates the POIs-on-map when the
GISTAM 2025 - 11th International Conference on Geographical Information Systems Theory, Applications and Management
36

Figure 10: Execution time comparison among proposed and
baseline method.
number of waypoints was varied from 3 to 8.
Figure 10 compares the execution times of the
proposed method and the baseline methods. The ex-
perimental results indicate that, while the execution
time of the proposed method is less efficient than the
simple Dijkstra’s algorithm, it outperforms when ap-
plied to routes involving waypoints.
In scenarios similar to those in Google Maps,
where the number of POIs associated with each way-
point is low, the proposed method’s execution time is
notably shorter. Conversely, as the number of POIs
belonging to each waypoint increases, the difference
in execution time is expected to decrease.
In the baseline method 2, after deciding which size
of waypoints to pass through using parameters, the or-
der of movement must be manually configured. On
the other hand, the proposed method excels as it in-
tegrates the discovery of waypoints and the determi-
nation of which waypoints to pass through within a
single algorithm, allowing for automatic execution.
4.3.4 Experiments on Route Evaluation
We compared the distances between the proposed
route and each point of interest (POI) with those gen-
erated by the baseline method. Figure 9 (a) presents
a histogram of the distances between the route shown
in Figure 4 (a) and each POI, while Figure 9 (b) cor-
responds to Figure 6 (b). These figures reveal that the
POIs are more densely clustered around a 50-meter
range in the routes generated by the proposed method
compared to the baseline approach.
5 CONCLUSION & FUTURE
WORK
In this study, we proposed a route recommendation
method designed to effectively navigate through way-
points, conceptualized around the idea of dogwalker.
The algorithm, named dog-walker pathfinding algo-
rithm, operates based on the principles of two agents:
a dog and a walker. The walker, serving as a navigat-
ing agent within the graph, moves independently in a
two-dimensional space, separate from the dog. How-
ever, connected by a leash, the walker is propelled to-
ward the direction the dog wishes to explore. Moti-
vated by POIs acting as incentives, the dog tends to
move toward areas abundant in POIs. Once the POIs
are sufficiently consumed, the dog moves toward the
goal, pulling the walker along a path that is expected
to pass through high-density POI areas. This path is
the output of our algorithm.
Experiments were conducted in two distinct areas:
Kyoto City in Kyoto Prefecture, Japan, and Manhat-
tan, New York, USA. As a result, it has been demon-
strated that our method can recommend routes that
effectively pass through POIs and operates faster than
the baseline method using Dijkstra’s algorithm. Fu-
ture work will focus on further evaluation and re-
finement of this method. Generally, evaluating algo-
rithms that use social big data is challenging. In this
paper, we conducted a qualitative evaluation using
Flickr and Google Maps as test datasets. For quanti-
tative evaluation, there are several ideas, such as scor-
ing based on the number of POIs passed or assigning
scores based on reviews from Google Maps for spe-
cific buildings such as temples. However, these eval-
uations may vary depending on the context and could
be influenced by parameters, potentially making them
less reliable.
Various possibilities are available for refining our
method, including optimizing parameter settings and
the decision-making processes of the agents. Our
method focuses on proposing an algorithm that effec-
tively passes through waypoints in cases where POIs
and the graph exist on the same plane but do not over-
lap; however, evaluation and algorithmic improve-
ment are important, and hence will be prioritized in
future work. Additionally, there is room for improve-
ment in peripheral issues such as preprocessing the
road network used and refining the data extraction
methods.
REFERENCES
Bao, J., Zheng, Y., and Mokbel, M. (2012). Location-based
and preference-aware recommendation using sparse
geo-social networking data. pages 199–208.
Chen, L., Lv, M., Ye, Q., Chen, G., and Woodward, J.
(2011). A personal route prediction system based
on trajectory data mining. Information Sciences,
181(7):1264–1284.
De Choudhury, M., Feldman, M., Amer-Yahia, S., Gol-
Navigating Points of Interest: The Dog-Walker Pathfinding Algorithm
37

bandi, N., Lempel, R., and Yu, C. (2010). Automatic
construction of travel itineraries using social bread-
crumbs. In Proceedings of the 21st ACM Conference
on Hypertext and Hypermedia, pages 35–44.
Dijkstra, E. (1958). A note on two problems in connexion
with graphs. Numb. Math., 1.
Dorigo, M. and Di Caro, G. (1999). Ant colony optimiza-
tion: a new meta-heuristic. In Proceedings of the 1999
congress on evolutionary computation-CEC99 (Cat.
No. 99TH8406), volume 2, pages 1470–1477. IEEE.
Dorigo, M. and Gambardella, L. M. (1997). Ant colony sys-
tem: a cooperative learning approach to the traveling
salesman problem. IEEE Transactions on evolution-
ary computation, 1(1):53–66.
Dorigo, M., Maniezzo, V., and Colorni, A. (1996). Ant sys-
tem: optimization by a colony of cooperating agents.
IEEE transactions on systems, man, and cybernetics,
part b (cybernetics), 26(1):29–41.
Fu, K., Lu, Y.-C., and Lu, C.-T. (2014). Treads: A safe
route recommender using social media mining and
text summarization. In Proceedings of the 22nd ACM
SIGSPATIAL International Conference on Advances
in Geographic Information Systems, pages 557–560.
Ishizaki, Y., Koyama, Y., Takayama, T., and Togawa, N.
(2021). A route recommendation method consider-
ing individual user’s preferences by monte-carlo tree
search and its evaluations. Journal of information pro-
cessing, 29:81–92.
Jain, S., Seufert, S., and Bedathur, S. (2010). Antourage:
mining distance-constrained trips from flickr. In
Proceedings of the 19th international conference on
World wide web, pages 1121–1122.
Kim, J., Cha, M., and Sandholm, T. (2014). Socroutes:
safe routes based on tweet sentiments. In Proceedings
of the 23rd International Conference on World Wide
Web, pages 179–182.
Kurashima, T., Iwata, T., Irie, G., and Fujimura, K. (2010).
Travel route recommendation using geotags in photo
sharing sites. In Proceedings of the 19th ACM interna-
tional conference on Information and knowledge man-
agement, pages 579–588.
Majid, A., Chen, L., Mirza, H. T., Hussain, I., and Chen,
G. (2015). A system for mining interesting tourist lo-
cations and travel sequences from public geo-tagged
photos. Data & Knowledge Engineering, 95:66–86.
Popescu, A. and Grefenstette, G. (2009). Deducing trip
related information from flickr. In Proceedings of
the 18th international conference on World Wide Web,
pages 1183–1184.
Pung, J., D’Souza, R. M., Ghosal, D., and Zhang, M.
(2022). A road network simplification algorithm that
preserves topological properties. Applied Network
Science, 7(79).
Quercia, D., Schifanella, R., and Aiello, L. M. (2014). The
shortest path to happiness: Recommending beautiful,
quiet, and happy routes in the city. In Proceedings
of the 25th ACM conference on Hypertext and social
media, pages 116–125.
Tsiligirides, T. (1984). Heuristic methods applied to orien-
teering. Journal of the Operational Research Society,
35:797–809.
Yamashita, O. and Yokoyama, S. (2022). Preference aware
route recommendation using one billion geotagged
tweets. In Proceedings of the 6th ACM SIGSPA-
TIAL International Workshop on Location-based Rec-
ommendations, Geosocial Networks and Geoadvertis-
ing, pages 1–10.
Yang, Y., Gong, Z., and U, L. H. (2011). Identifying points
of interest by self-tuning clustering. In Proceedings
of the 34th international ACM SIGIR conference on
Research and development in Information Retrieval,
pages 883–892.
GISTAM 2025 - 11th International Conference on Geographical Information Systems Theory, Applications and Management
38
