
Penta: Towards Visualizing Compound Graphs as Set-Typed Data
Henry Ehlers
a
, Mario Kerndler
b
and Renata G. Raidou
c
Visualization Group, TU Wien, Favoritenstr. 9-11 / E193-02, Vienna, Austria
Keywords:
Compound Graph, Network Visualization, Set Visualization, Ego Network.
Abstract:
Compound graphs are graphs whose nodes, in addition to topological connections, share group-level relation-
ships. The need to incorporate both topological and group-level relationships makes them inherently chal-
lenging to visualize, especially for large data. We present Penta, a prototypical dashboard that, by combining
elements of compound graph and set visualization, provides a complete view of both types of relationships.
To this end, we employ five linked views that provide insight into a compound graph’s i) global and set-
local topology using both hypernode and traditional node-link diagrams, respectively, ii) set and entity-level
relationship and identity using similarity matrices linked by a bipartite node-link diagram, as well as iii)
node-centric topology across sets visualized as a layered node-link diagram. We demonstrate the workflow
and advantages of Penta in three small-scale case studies, using character co-occurrence networks as well as
biochemical pathway data. While still a prototype, the proposed dashboard shows promise in facilitating a
complete visual exploration of the topology and group-level relationships present in compound graphs, simul-
taneously.
1 INTRODUCTION
A clustered or compound graph is a graph whose
nodes, in addition to topological connections, share
group-level relationships (Vehlow et al., 2015b). In
the context of social networks, for example, nodes
may represent individual people, edges (different
types of) relationships between them, and groups cir-
cles of friends. Given their general utility and ap-
plicability, compound graphs, their visualization, and
their analysis are common across many different do-
mains: from social sciences (Humayoun et al., 2016),
through biochemistry (Paduano and Forbes, 2015)
and neurology (Al-Awami et al., 2014), to transporta-
tion logistics (Ducruet, 2017). Subsequently, various
visualization approaches and systems have been put
forth to tackle the visualization of compound graphs
differently: some of these forgo interactivity in the
interest of scalability (Xia et al., 2015), others com-
bine the two using summarization techniques (Pad-
uano and Forbes, 2015) or linked views (Al-Awami
et al., 2014), while others yet build upon domain-
specific visual conventions to better serve a particular
user group (Humayoun et al., 2016). Ultimately, all
a
https://orcid.org/0000-0002-5994-1492
b
https://orcid.org/0009-0001-4748-8512
c
https://orcid.org/0000-0003-2468-0664
these approaches address the challenge of simultane-
ously visualizing graph topology and group structure.
A compound graph’s group structure can be con-
ceptualized as a collection of sets; their elements
formed by the graph’s nodes, and their intersections
by nodes present in two or more groups (Pezzotti
et al., 2018). When visualizing or analyzing sets, we
are interested in understanding their relations, such
as containment, exclusions, or intersections, to better
understand the role or importance of their elements
(Alsallakh et al., 2016). However, even when the
underlying data is not a graph, such set-typed data
can become challenging to visualize. Depending on
the complexity and size of the data, such visualiza-
tions often require the use of abstraction (Rodgers
et al., 2015) or summarization (Lamy and Tsopra,
2020) to remain legible. Domain-specific applica-
tions may additionally require the interactive visual-
ization of meta-data attached to sets’ and their ele-
ments (Lex and Gehlenborg, 2014). Many different
families of techniques and tools have been developed
to tackle these challenges, both for generic set-typed
and application-area-specific data (Alsallakh et al.,
2016). However, few—if any—of these techniques
can be applied to compound graphs, and fewer still
scale to large datasets, common in modern biochemi-
cal and social network analysis.
Ehlers, H., Kerndler, M. and Raidou, R. G.
Penta: Towards Visualizing Compound Graphs as Set-Typed Data.
DOI: 10.5220/0013242300003912
Paper published under CC license (CC BY-NC-ND 4.0)
In Proceedings of the 20th International Joint Conference on Computer Vision, Imaging and Computer Graphics Theory and Applications (VISIGRAPP 2025) - Volume 1: GRAPP, HUCAPP
and IVAPP, pages 913-921
ISBN: 978-989-758-728-3; ISSN: 2184-4321
Proceedings Copyright © 2025 by SCITEPRESS – Science and Technology Publications, Lda.
913

In this paper, we present Penta, a prototype dash-
board for the visualization of non-hierarchical, non-
disjoint compound graphs as set-typed data. With this
prototypical implementation, we aim to address sev-
eral outstanding gaps in the fields of both set visual-
ization (Alsallakh et al., 2016) and compound graph
visualization (Vehlow et al., 2015b; Ehlers et al.,
2024a), by combing multiple linked views, (similar-
ity) matrix visualizations, and ego network represen-
tations. More specifically, the contribution of Penta’s
linked views is that they provide insight into i) the
group’s global and local topology using both hypern-
ode and traditional node-link diagrams, respectively,
ii) set and vertex-centric relationship and identity us-
ing similarity matrices linked by a bipartite node-link
diagram, as well as iii) node-centric topology across
sets visualized as a layered node-link diagram.
2 RELATED WORK
As Penta’s five linked views draw from conventions
of compound graph visualizations, matrix-based set-
visualization, as well as ego-network visualization,
we here discuss the state-of-the-art of each.
Compound Graph Visualization. Compound
graphs have been visualized in a multitude of ways
(Ehlers et al., 2024a; Vehlow et al., 2015b), us-
ing node attributes, overlays, bipartite node-link
diagrams, multiples, trees, matrices, abstractions,
and hybrid techniques. The most common way of
visualizing group-level memberships in compound
graphs, node attributes take the form of, for example,
colors (Vehlow et al., 2015a) or glyphs (Wang et al.,
2016). Overlay techniques add group-level associa-
tions atop a graph’s embedding, using, for example,
regions (Partl et al., 2013), lines (Alper et al., 2011),
or combinations of the two (Meulemans et al.,
2013). Less common than either overlays or node
attributes, bipartite node-link diagrams represent
both nodes and groups as (different types) of vertices
with topological and group-level-association edges
connecting them (Bigelow et al., 2019). Multiples opt
to visualize each group’s subgraph separately, as seen
in Bach et al.’s Small Multiples (Bach et al., 2015) or
Graph Diaries (Bach et al., 2014). Trees, commonly
visualized alongside a compound graph’s topology,
visualize elements, i.e. vertices, as the leaves of the
tree and their (hierarchical) set-element relationships
as edges (Abello et al., 2006). (Biadjacency) ma-
trices, also visualized separately from a compound
graph’s topology, depict vertex-group memberships
tabularly where each row corresponds to a vertex
and each group to a column (Chuang et al., 2012).
Abstractions do not visualize all sets, elements, and
their relationships but provide a view into one by
abstracting away the others. This broad category
can unsurprisingly include many different types of
approaches (Rodgers et al., 2015; Yoghourdjian et al.,
2018) Finally, hybrid techniques combine any of
these aforementioned techniques to visualize group
membership and topology simultaneously (Angori
et al., 2019; Henry et al., 2007).
Matrices for Set-Typed Data. While several ex-
amples of set visualization and their elements as bi-
adjacency-based matrices can be found in the liter-
ature (Sadana et al., 2014; Lex et al., 2014), simi-
larity-based matrix representations are less common.
We could only identify two examples for the ex-
plicit purpose of similarity-matrix-based set visual-
ization. First, Liu et. al’s Similarity Lattice (Xu
Liu et al., 2005) represents sets’ pairwise Complete-
ness and Intensity similarity as a non-symmetric sim-
ilarity matrix. Second, Intervene (Khan and Math-
elier, 2017) features similarity-based matrix repre-
sentations alongside more conventional biadjacency-
based ones. As also discussed in reviews of both
compound graph visualization (Vehlow et al., 2015b;
Ehlers et al., 2024a) and set visualization (Alsallakh
et al., 2016), the use of (similarity) matrices is a novel
avenue with which to communicate group and entity-
level relationships in both sets and compound graphs.
Ego Network Visualizations. Ego network repre-
sentations visualize graph topology relative to some
selected node of interest—the so-called “ego” (Ehlers
et al., 2024b). Ego networks may be used to simplify
the visualization of a graph’s topology, by only visual-
izing those nodes and edges of immediate importance
to the selected ego. Examples of node-centric visual-
izations of larger graphs can be found across several
domains (Ehlers et al., 2024b). Here, we are particu-
larly interested in the use of layered (tree-like) node-
link diagrammatic representations, as they promise an
intuitive and orderly view into the intrinsically lay-
ered topology of ego networks. Such layered rep-
resentations align nodes along “layers” representing
the distance from the selected ego (Sayers, 2004).
While not related to ego networks directly, similar
ideas of edge scaling and distance-based node em-
bedding can be found in the visualization of phyloge-
netic trees (Shank et al., 2018), evolutionary graphs
(Miller et al., 2011), or synaptic/brain graphs (Al-
Awami et al., 2014). To the best of our knowledge,
such ego network visualizations have not yet found
application in compound graph visualization.
IVAPP 2025 - 16th International Conference on Information Visualization Theory and Applications
914

3 THE FIVE FACETS OF PENTA
Visualizing compound graphs is challenging, as one
needs to visually communicate both graph topology
and group-level relationships simultaneously. Specif-
ically, supporting the following aspects is necessary:
1. viewing all groups’ global topology,
2. investigating the particular set-relative topology
of selected groups,
3. understanding the similarities of all groups and
nodes relative to each other,
4. viewing all selected set-element mappings, and
5. investigating the node-relative topology of the
graph, i.e. topology relative to a selected ego.
To integrate the aforementioned channels of infor-
mation, we propose the prototypical web-based Penta
dashboard, which aims to visualize different facets
of a compound graph’s group structure and topology
in five linked views. Users are expected to upload
their compound graph’s topology and group-level as-
sociations they wish to investigate to Penta, within
which they then interactively filter and explore their
dataset. This may entail selecting entities or sets
within its multiple linked views or looking them up
based on their unique identifiers. More specifically, in
accordance with Shneiderman’s (Shneiderman, 1996)
mantra of “Overview First, [...] filter, then details
on demand” the dashboard aims to funnel users from
a global view of topology, through the topology and
similarity of selected sets, to the immediate topology
of a particular node. Interactive selections of vertices
and sets in any of these five views are reflected in all
other views through brushing and linking (Buja et al.,
1991). Penta, available on GitHub, was developed in
Svelte using D3.js (Bostock et al., 2011).
Global Topology. For some compound graph
G(V, E, S) let V denote its total set of elements/nodes,
E its total set of edges, and S its elements’ non-
hierarchical, non-disjoint group structure. For a set
s ∈ S, node-set pairs (v
a
,s) and (v
b
,s) in V
G
are con-
nected by edges E
G
⊆ V
G
× V
G
, where V
G
⊆ V × S.
Here, the input graph’s global topology can be either
represented as a force-directed or (as presented here)
a radial node-link diagram (Figure 1b). As straight-
line node-link diagrams do not tend to produce aes-
thetically pleasing or readable results for graphs of
larger sizes and greater complexity (Ehlers et al.,
2023), we do not visualize nodes v ∈ V and their edges
e ∈ E directly. Instead, each set of nodes V
G
is visual-
ized as its own circular hypernode (Terje Bjørke et al.,
2010). Hovering over such hypernodes reveals their
labels. To communicate which groups of nodes are
present across sets, groups of nodes that form inter-
sections between sets of nodes are represented by sep-
arate, square hypernodes (Figure 1b). Hypernodes’
sizes encode the cardinality of their sets or intersec-
tions, i.e. the more elements a set contains, the larger
the set’s corresponding hypernode.
In the particular example shown in Figure 1b,
seven groups, representing seven Mus musculus
KEGG pathways, are depicted—one circular node per
group. The size of each node represents the num-
ber of genes (nodes) in each pathway. Between these
seven groups, there are five unique intersections, rep-
resented by five square nodes. One particular inter-
section, consisting only of a single node with identi-
fier 58810 is highlighted. Said node is the intersec-
tion between the three selected, i.e. colored, groups,
indicated by the edges connecting the intersection’s
square node to the three groups’ circular nodes.
Set-Relative Topology. From the aforementioned
global topological view, hypernodes can be selected,
thereby adding their elements, i.e. vertices, to the
set-relative topological view. This is represented as
a straight-line node-link diagram (Figure 1a), laid out
using D3.js’s particle-based force-directed algorithm
(Bostock et al., 2011). Each added group of nodes is
color-coded, using an appropriate ColorBrewer color
palette (Harrower and Brewer, 2003) used consis-
tently across all views. To ensure colors remain visu-
ally distinct from each other (Healey, 1996), users can
only select up to ten such groups simultaneously. We
highlight intersections between two or more groups
by color-coding them in black. Hovering over any in-
dividual node reveals its label and highlights its corre-
sponding hypernode in the global topological view, as
well as its location in the (to-be-discussed) element-
similarity matrix in a similar way.
In the example shown in Figure 1a, three of the
seven aforementioned Mus musculus KEGG path-
ways have been selected, one colored green, the other
blue, and the final one orange. Nodes that form an in-
tersection between any two of the three selected path-
ways are colored dark grey. The selected node 58810,
which forms an intersection between all three selected
pathways, is colored black.
Set and Vertex Similarity. To navigate both sets
and elements, we propose the use of two interactive
similarity matrices—one depicting set similarity and
the other representing vertex similarity (Figure 2c).
Unlike identity matrix representations, which may ne-
cessitate panning and scrolling to navigate owing to
potential asymmetries, a square, symmetric similar-
ity matrix offers a clearer overview of all sets or ele-
Penta: Towards Visualizing Compound Graphs as Set-Typed Data
915
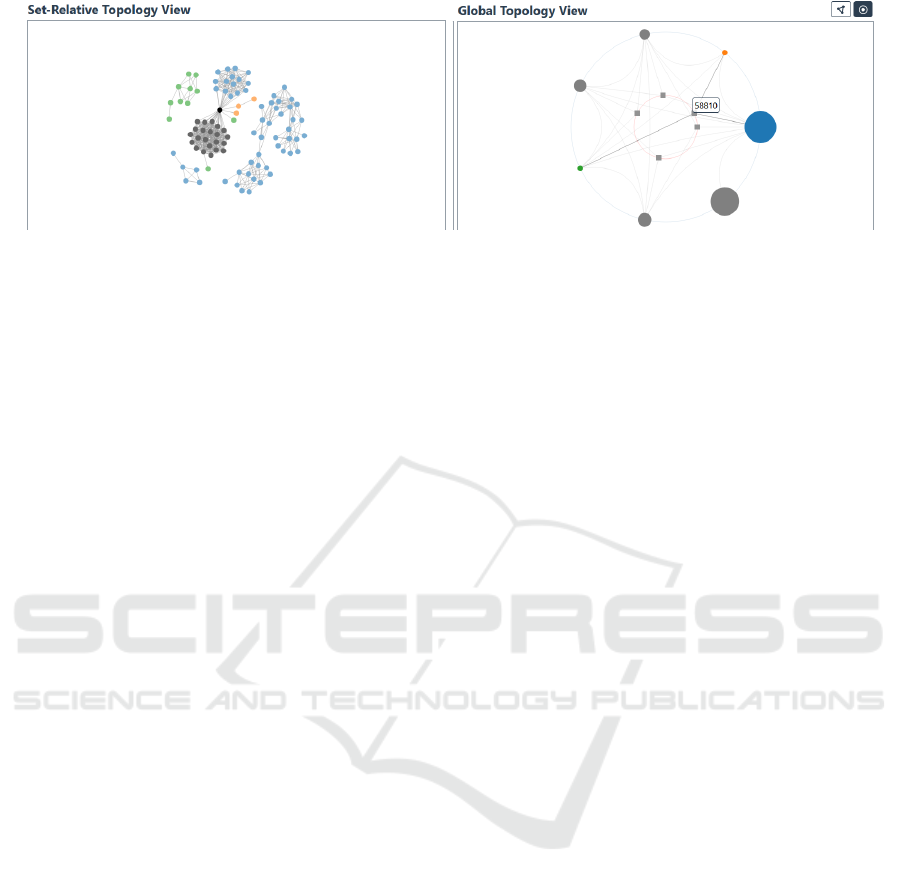
(a) (b)
Figure 1: The (b) global topology view for seven KEGG mouse (MMU) pathways (groups) and their intersections. The (a)
set-relative topology of a selection of three sets from the global topological view, colored in blue, orange, and green in both
views. A notable intersection between these three selected is the entity (vertex) with identifier 58810 which is highlighted in
black on the (a).
ments simultaneously. Moreover, matrix representa-
tions offer overall greater visual clarity and flexibil-
ity over many other approaches for set and element
visualization (Alsallakh et al., 2016). This concep-
tual flexibility includes the straightforward use of
different similarity measures with which to under-
stand groups and elements relationships (Vijaymeena
and Kavitha, 2016). Here, for any two sets A, B ∈ S,
their similarities are computed using the Jaccard dis-
tance J(A,B) = (|A∩B|)/(|A∪B|), chosen for its con-
ceptual simplicity and its applicability to both set and
topological node similarity. To quantify element simi-
larity, the same conceptual approach based on the Jac-
card distance is used: for any two vertices/elements
a,b ∈ V , we can define their “sets” as A = q(a) and
B = q(b), where q(x), for an element x ∈ V , can take
different forms. We make use of a topological set
definition: q(x) = {v : ∀v ∈ V,{x,v} ∈ E}, i.e. we
simply define a node’s set as its immediate neighbor-
hood. In both cases, the similarity is encoded using
a luminance colormap, i.e. white indicating low and
black high similarity. Moreover, a selected set’s rows
and columns are indicated using colored lines. Ad-
ditionally, matrices can be flexibly reordered based
on selected criteria to facilitate the detection of novel
or unexpected relationships between entities (Mueller
et al., 2007). Here, as a proof of concept, we allow the
user to reorder both set and element similarity matri-
ces by either i) a random ordering for the identifica-
tion of unexpected relationships, or ii) an attribute-
based ordering that organizes entities by their lexico-
graphic order, or iii) an agglomerative, hierarchical
clustering-based order to identify clusters of interest
(Kaufman and Rousseeuw, 1990).
In the example shown in Figure 2c, the set-
similarity matrix represents the character similarities
among the first four books of the Harry Potter series
(Ravi, 2024). Each set, i.e. book, is represented by
one of the four rows and columns of the matrix, or-
dered lexicographically. Each cell represents the Jac-
card distance between two sets. The darker a cell,
the more similar the two sets are. Instead of space-
consuming conventional labels, colored lines indicate
the identity of each row and column. Here, books two
and three have been selected from the global topo-
logical view (Figure 2a). The vertex-similarity ma-
trix (Figure 2c), shows the similarity between nodes
(characters) as a function of their immediate neigh-
borhood, i.e. the more neighbors two nodes have in
common, the more similar they are. Each row and col-
umn corresponds to a particular character, and each
cell to the similarity between two nodes. Again, sim-
ilarity is mapped to cell brightness.
Set-Node Connection Graph. The previously dis-
cussed similarity matrix representations allow for an
in-depth exploration of within-set and within-element
relationships. However, they do not visualize the set
membership of elements or the mapping of sets to el-
ements (Pezzotti et al., 2018). To link the aforemen-
tioned similarity views, we visually exploit the bipar-
tite relationship between them and visualize said re-
lationship as a “Connection Graph” (Figure 2c). For
matrices, drawing (curved) edges between their rows
(or columns) is conceptually fairly straightforward,
as they already form a one-dimensional projection of
their elements (Misue and Zhou, 2011). More specifi-
cally, given a single selected set S, its projection point
is connected to all its elements’ (x ∈ S) projection
points by curved edges. Alternatively, given a single
selected element x, its projection point is connected to
all sets of which it is a member, i.e. {s : ∀s ∈ S,x ∈ s}.
Edge and label colors utilize the same color palette as
in the global and set topology views.
In this particular example (Figure 2c), the connec-
tion graph shows the mapping of Harry Potter books
IVAPP 2025 - 16th International Conference on Information Visualization Theory and Applications
916

(sets) to the characters of the series (nodes), and vice-
versa. For each book’s character, curved edges are
drawn between the books’ and the character’s row in
their respective similarity matrices. The color of the
curved line corresponds to the color of the set, as de-
picted in both the global and set-relative topological
views (Figures 2a and 2b). If a node, i.e. character,
maps to multiple sets (books), multiple such lines will
be drawn, connecting the one node to multiple sets.
Node Relative Topology. While the global and set-
local topological views of the graph provide a good
starting point for exploring particular sets and their el-
ements, they are insufficient in understanding a node’s
connectivity across all sets. To amend this, we em-
ploy a vertex-centric representation of topology for a
particular selected entity, i.e. an ego network where
the selected vertex forms the “ego” (Ehlers et al.,
2024b). This ego network is generated from the
graph’s global topology based on a selected ego node
of interest and a user-specified maximum exploration
depth. More specifically, Penta employs a breadth-
first search algorithm to traverse the graph from the
ego node, through its neighbors, its neighbors’ neigh-
bors, and so on, up to the specified depth, thereby
constructing a tree(-like) data structure that encapsu-
lates the shortest possible paths to all reachable nodes.
This tree is visualized as a layered node-link diagram
(Figure 3c). Its layers, i.e. nodes, are sorted by their
inverse weighted edge distance to the ego, i.e. the
greater the edge weight between any two nodes, the
closer they will be visualized in the tree. This also
allows for Penta to sort a node’s neighbors based on
this edge weight, i.e. the closest neighbor appears at
the top of its branch, and the furthest at the bottom.
In the example of Figure 3, a co-occurrence net-
work of Star Wars characters across the first six
movies is shown. The depicted ego network displays
the node-relative topology of one selected character,
namely R2-D2, depicted in the top left of Figure 3c.
The layered node-link diagram shows a character’s
connections across all sets in the dataset. The more
a character interacted with R2-D2, i.e. the larger their
co-occurrence edge weight, the higher up in the lay-
ered node-link diagram it appears, i.e. Anakin inter-
acted more with R2-D2 than Qui-Gon, who interacted
more than Luke. The same ordering system applies to
each layer of this layered node-link diagram. The or-
dering is reinforced by scaling each edge’s horizontal
length based on edge weight, i.e the more two char-
acters interact, the larger their edge weight, and the
closer they appear in the horizontal space.
4 USE CASES
In order to demonstrate the potential utility of Penta,
three small-scale usage scenarios are presented.
Scenario 1: Noticing Notable Nodes. In order to
demonstrate the utility of both the global and set-local
topological view, consider a Mus musculus example
dataset, in which each node represents a gene, each
edge a gene-gene interaction, and groups of genes
represent KEGG pathways in mice (Kanehisa and
Goto, 2000). For seven such pathways, their global
topology is visualized as a hypernode-link diagram
(Figure 1b). Here, three pathways of particular inter-
est, mmu0010, mmu00053 and mmu00040, colored in
blue, green, and orange, respectively, are selected in
the global topological view, their vertices visualized
in the corresponding set-local topology view (Figure
1a). From the global topology view, we can imme-
diately discern the relative sizes of these three sets,
i.e. mmu0010 (blue) is larger than any other pathway
in the dataset, indicated by the area encoding of the
nodes. Moreover, we can immediately see how all our
datasets intersect and the cardinalities of these inter-
sections. More specifically, a particular intersection
between the three pathways of interest is revealed to
be a single node, namely 58810. The importance of
this particular node across the selected pathways is
also made immediately apparent in the set-relative lo-
cal topological view (Figure 1a), where said node not
only forms an intersection between these three path-
ways but also a bridge between two large clusters of
nodes. Among those, one forms an intersection of its
own between two selected pathways (colored in grey).
The combined use of these two views—hypernode
and traditional node-link diagrams—has enabled an
intuitive and speedy overview of the pathway’s global
and local topology and facilitated the identification of
a notable node.
Scenario 2: Such Similarity, Much Wow. In order
to demonstrate the utility of set and node-similarity
matrix views, consider a Harry Potter character co-
occurrence network (Ravi, 2024), in which each node
represents a character, each weighted edge the num-
ber of interactions two characters shared, and each
group one of the first four books of the series. In or-
der to determine the similarities between books two
and three, colored orange and red respectively, the
two groups’ hypernodes have been selected from the
global topological view (Figure 2a) and their nodes
and connections added to the local topological view
(Figure 2b), as discussed previously. This view al-
ready sheds some view into the strong overlap in char-
Penta: Towards Visualizing Compound Graphs as Set-Typed Data
917

(a) (b)
(c)
Figure 2: Visualizing Character Interactions Across Harry Potter Books. (a) Global Topology View: Overview of character
interactions across the first four books, highlighting recurring characters. (b) Local Topology View: Dense inter-character
connections between books two and three. (c) Set and Vertex-Similarity Analysis: Consistent level of recurring characters
and interactions between books.
acters between the two books, given the many (black)
nodes that form intersections between the two books.
However, viewing the set-similarity matrix (Figure
2c), the darker gray color of books two and three’s
similarity, immediately communicates that these two
books share the greatest set of characters across the
first four published books. Following the connection
graph and viewing the vertex similarity matrix, one
can immediately note three interesting blocks of char-
acters, namely i) those that strongly co-occur across
books two and three, ii) those that primarily co-occur
in book two, and iii) those that primarily co-occur in
book three Figure 2c). The interactive dashboard now
allows for individual inspection of character-character
similarity scores. The set and vertex similarity matri-
ces allow us to quickly identify subsets of nodes of
potential interest for follow-up study.
Scenario 3: Me! Me! Me! Me! Here, to ex-
plore the utility of the ego network, consider a co-
occurrence network of Star Wars characters across the
first six movies, in which each node represents a char-
acter, each weighted edge the number of interactions
two characters shared, and each group one of the six
movies (Gabasova, 2024). Here, given some prior ex-
ploration of groups and their connectivity, a user has
identified a particular node of interest, namely R2-
D2, as this particular character forms an intersection
across all six groups (Figure 3a). As the local topo-
logical view (Figure 3b) is too dense to make out said
character’s immediate neighborhood, a user can uti-
lize the vertex-relative ego network view (Figure 3c.
Here, the selected ego, here R2-D2, forms the root
node of the layered tree representation in the top left.
From a simple cursory look, a user can immediately
identify the ego’s closest neighbors, here Anakin, Qui-
Gon, and Luke, thanks to the vertical ordering of the
IVAPP 2025 - 16th International Conference on Information Visualization Theory and Applications
918
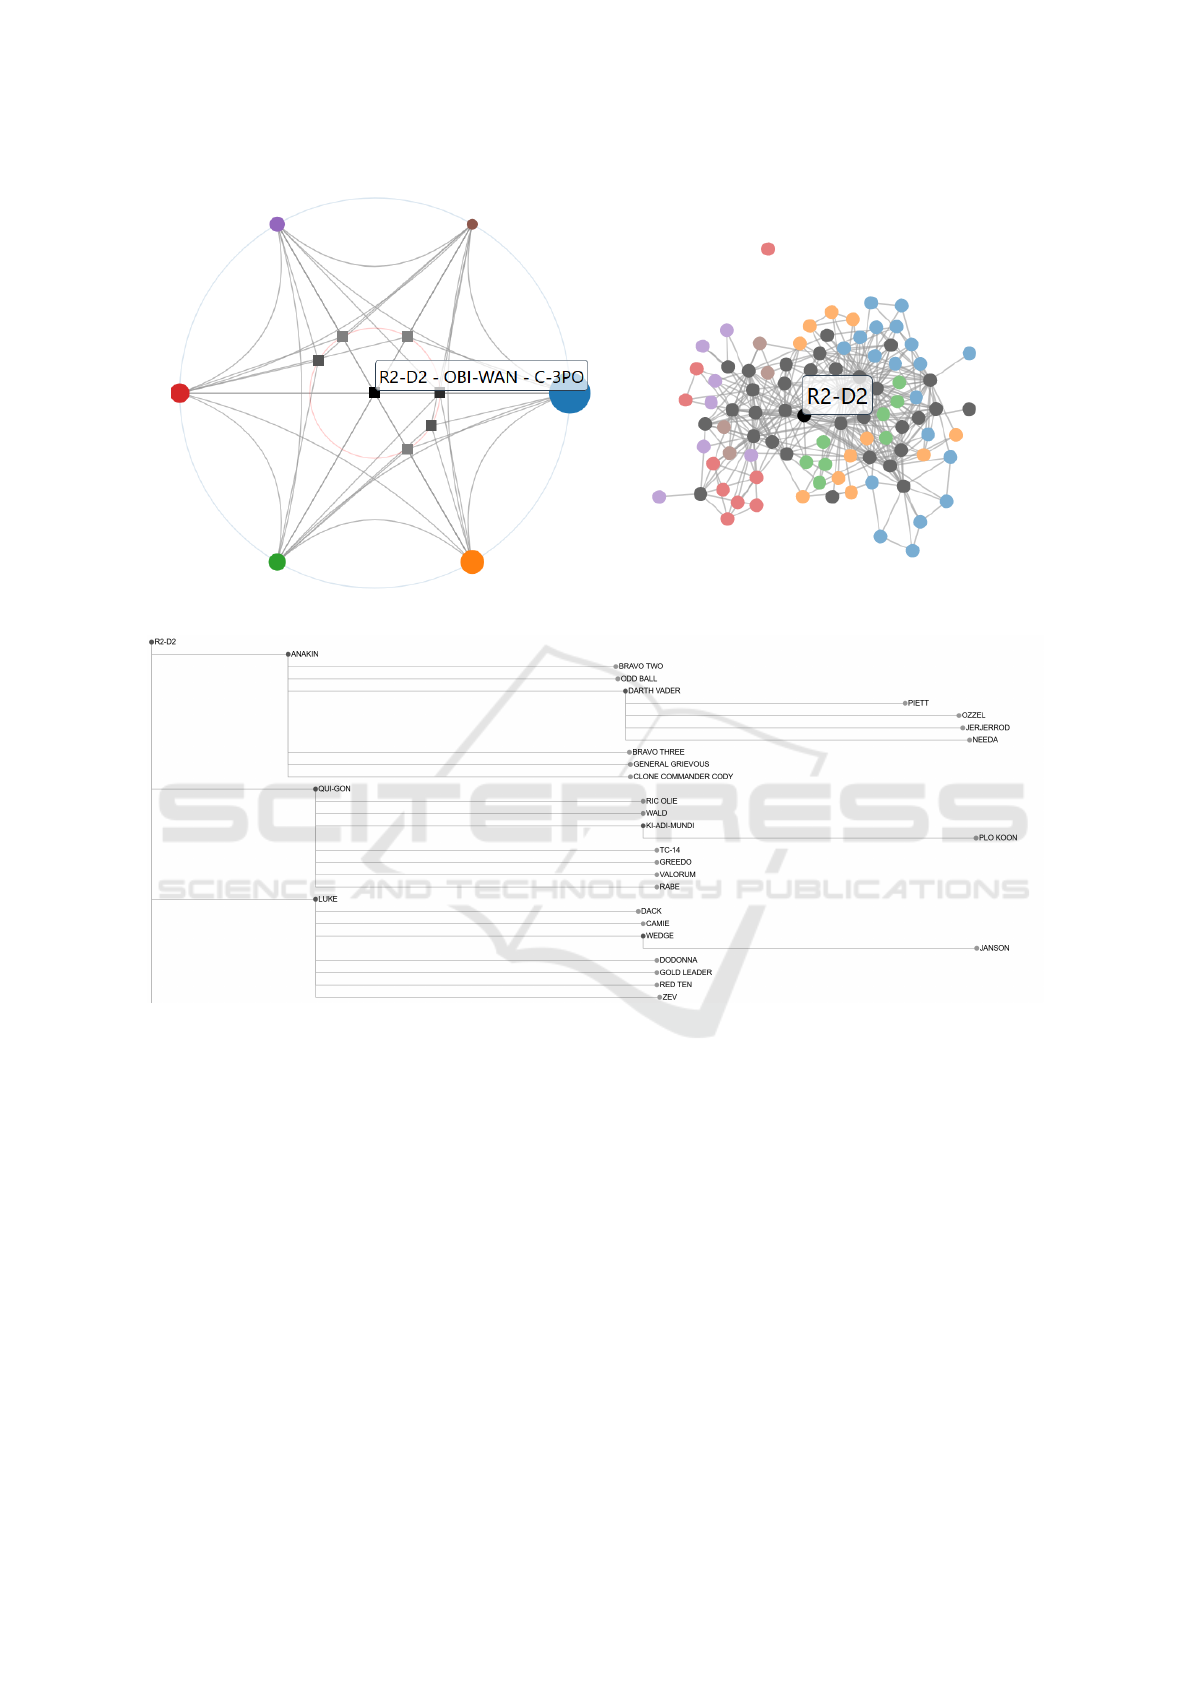
(a) (b)
(c)
Figure 3: Analyzing the Star Wars Character Network. (a) Global Topology View: Comprehensive visual map of the
Star Wars character network, highlighting key characters across all movies. (b) Local Topology View: View into the dense
interrelationships of characters across the first six movies. (c) Ego-Network of R2-D2: Central role and extensive connections
of R2-D2 within the Star Wars narrative.
ego’s neighbors by edge weight, i.e. R2-D2’s closest
neighbors are located at the top of the tree. More-
over, thanks to the horizontal ordering of nodes based
on cumulative proximity to the ego, one can addition-
ally notice that, while Piett and Ozzel are both a hop-
distance of three away from R2-D2, Piett is closer
once edge weights are factored in. This node-relative
topological view facilitated by the ego network allows
for an in-depth look at the selected ego’s (immediate)
neighborhood in an intuitive and fast manner.
5 SUMMARY AND TAKE-AWAY
The prototypical Penta dashboard offers a holistic
approach to visualizing compound graph data, en-
abling users to analyze both topological and group-
level relationships across multiple datasets. Through
our three case studies, Penta demonstrates its abil-
ity to highlight both global and local graph struc-
tures effectively. For example, in the first scenario,
Penta allows users to quickly identify key intersec-
tions and pathways, such as important genes within
Penta: Towards Visualizing Compound Graphs as Set-Typed Data
919

biological networks. The second scenario showcases
Penta’s utility in visualizing co-occurrence networks,
revealing shared character groups across Harry Potter
books. Lastly, the third scenario focuses on individ-
ual nodes within a Star Wars network, where users
can explore character relationships based on interac-
tion frequency. Overall, Penta’s prototypical imple-
mentation already promises to be a valuable tool for
researchers looking to interpret compound graph re-
lationships in larger datasets.
6 CONCLUSION AND FUTURE
WORK
In this paper, we have presented the prototypical im-
plementation of Penta, a novel approach to the holis-
tic visualization of compound graph data. We further
demonstrated the use and effectiveness of our tool on
three use case scenarios, which indicate Penta’s util-
ity in making sense of a compound graph’s topol-
ogy, both on a local and global level, as well as
group structure. In future work, we hope to i) im-
plement additional similarity measures with which
to view set and vertex relationships(Vijaymeena and
Kavitha, 2016), ii) implement additional clustering
algorithms with which to sort similarity matrices
(Koutrouli et al., 2020), iii) allow for the integration
of node and edge attribute data to go beyond purely
topological analyses, and iv) improve the scalability
of multiple views through, for example, latent vari-
able space scatter plots (Pezzotti et al., 2018).
REFERENCES
Abello, J., van Ham, F., and Krishnan, N. (2006). ASK-
GraphView: A Large Scale Graph Visualization Sys-
tem. IEEE Transactions on Visualization and Com-
puter Graphics, 12(5):669–676. Conference Name:
IEEE Transactions on Visualization and Computer
Graphics.
Al-Awami, A. K., Beyer, J., Strobelt, H., Kasthuri, N.,
Lichtman, J. W., Pfister, H., and Hadwiger, M. (2014).
NeuroLines: A Subway Map Metaphor for Visualiz-
ing Nanoscale Neuronal Connectivity. IEEE Trans-
actions on Visualization and Computer Graphics,
20(12):2369–2378.
Alper, B., Riche, N., Ramos, G., and Czerwinski, M.
(2011). Design Study of LineSets, a Novel Set Vi-
sualization Technique. IEEE Transactions on Visual-
ization and Computer Graphics, 17(12):2259–2267.
Conference Name: IEEE Transactions on Visualiza-
tion and Computer Graphics.
Alsallakh, B., Micallef, L., Aigner, W., Hauser, H., Miksch,
S., and Rodgers, P. (2016). The State-of-the-Art of Set
Visualization. Computer Graphics Forum, 35(1):234–
260.
Angori, L., Didimo, W., Montecchiani, F., Pagliuca, D.,
and Tappini, A. (2019). ChordLink: A New Hybrid
Visualization Model. In Graph Drawing and Net-
work Visualization: 27th International Symposium,
GD 2019, Prague, Czech Republic, September 17–20,
2019, Proceedings, pages 276–290, Berlin, Heidel-
berg. Springer-Verlag.
Bach, B., Henry-Riche, N., Dwyer, T., Madhyastha, T.,
Fekete, J.-D., and Grabowski, T. (2015). Small Mul-
tiPiles: Piling Time to Explore Temporal Patterns
in Dynamic Networks. Computer Graphics Forum,
34(3):31–40.
Bach, B., Pietriga, E., and Fekete, J.-D. (2014). GraphDi-
aries: Animated Transitions andTemporal Navigation
for Dynamic Networks. IEEE Transactions on Visu-
alization and Computer Graphics, 20(5):740–754.
Bigelow, A., Nobre, C., Meyer, M., and Lex, A. (2019). Ori-
graph: Interactive Network Wrangling. In 2019 IEEE
Conference on Visual Analytics Science and Technol-
ogy (VAST), pages 81–92.
Bostock, M., Ogievetsky, V., and Heer, J. (2011). D³ Data-
Driven Documents. IEEE Transactions on Visual-
ization and Computer Graphics, 17(12):2301–2309.
Conference Name: IEEE Transactions on Visualiza-
tion and Computer Graphics.
Buja, A., McDonald, J., Michalak, J., and Stuetzle, W.
(1991). Interactive data visualization using focusing
and linking. In Proceeding Visualization ’91, pages
156–163.
Chuang, J., Manning, C. D., and Heer, J. (2012). Ter-
mite: visualization techniques for assessing textual
topic models. In Proceedings of the International
Working Conference on Advanced Visual Interfaces,
AVI ’12, pages 74–77, New York, NY, USA. Associ-
ation for Computing Machinery.
Ducruet, C. (2017). Multilayer dynamics of complex spa-
tial networks: The case of global maritime flows
(1977–2008). Journal of Transport Geography,
60:47–58.
Ehlers, H., Marin, D., Wu, H.-Y., and Raidou, R. (2024a).
Visualizing Group Structure in Compound Graphs:
The Current State, Lessons Learned, and Outstanding
Opportunities. pages 697–708.
Ehlers, H., Pahr, D., Filipov, V., Wu, H.-Y., and Raidou,
R. G. (2024b). Me! Me! Me! Me! A study and com-
parison of ego network representations. Computers &
Graphics, 125:104123.
Ehlers, H., Villedieu, A., Raidou, R. G., and Wu, H.-Y.
(2023). Improving readability of static, straight-line
graph drawings: A first look at edge crossing resolu-
tion through iterative vertex splitting. Computers &
Graphics, 116:448–463.
Gabasova, E. (2024). evelinag/StarWars-social-network.
original-date: 2015-12-15T00:33:54Z.
Harrower, M. and Brewer, C. A. (2003). ColorBrewer.org:
An Online Tool for Selecting Colour Schemes for
Maps. The Cartographic Journal, 40(1):27–37.
Healey, C. (1996). Choosing effective colours for data vi-
sualization. In Proceedings of Seventh Annual IEEE
Visualization ’96, pages 263–270.
IVAPP 2025 - 16th International Conference on Information Visualization Theory and Applications
920

Henry, N., Fekete, J.-D., and McGuffin, M. J. (2007).
NodeTrix: a Hybrid Visualization of Social Networks.
IEEE Transactions on Visualization and Computer
Graphics, 13(6):1302–1309.
Humayoun, S. R., Ezaiza, H., AlTarawneh, R., and Ebert,
A. (2016). Social-Circles Exploration through Inter-
active Multi-Layered Chord Layout. In Proceedings
of the International Working Conference on Advanced
Visual Interfaces, AVI ’16, pages 314–315, New York,
NY, USA. Association for Computing Machinery.
Kanehisa, M. and Goto, S. (2000). KEGG: Kyoto Ency-
clopedia of Genes and Genomes. Nucleic Acids Re-
search, 28(1):27–30.
Kaufman, L. and Rousseeuw, P. (1990). Agglomerative
Nesting (Program AGNES). In Finding Groups in
Data, Wiley Series in Probability and Statistics, pages
199–252. John Wiley & Sons, Ltd.
Khan, A. and Mathelier, A. (2017). Intervene: a tool for
intersection and visualization of multiple gene or ge-
nomic region sets. Pages: 109728 Section: New Re-
sults.
Koutrouli, M., Karatzas, E., Paez-Espino, D., and
Pavlopoulos, G. A. (2020). A Guide to Conquer the
Biological Network Era Using Graph Theory. Fron-
tiers in Bioengineering and Biotechnology, 8:34.
Lamy, J.-B. and Tsopra, R. (2020). RainBio: Propor-
tional Visualization of Large Sets in Biology. IEEE
Transactions on Visualization and Computer Graph-
ics, 26(11):3285–3298. Conference Name: IEEE
Transactions on Visualization and Computer Graph-
ics.
Lex, A. and Gehlenborg, N. (2014). Sets and intersections.
Nature Methods, 11(8):779–779.
Lex, A., Gehlenborg, N., Strobelt, H., Vuillemot, R., and
Pfister, H. (2014). UpSet: Visualization of Intersect-
ing Sets. IEEE Transactions on Visualization and
Computer Graphics, 20(12):1983–1992. Conference
Name: IEEE Transactions on Visualization and Com-
puter Graphics.
Meulemans, W., Riche, N. H., Speckmann, B., Alper, B.,
and Dwyer, T. (2013). KelpFusion: A Hybrid Set Vi-
sualization Technique. IEEE Transactions on Visual-
ization and Computer Graphics, 19(11):1846–1858.
Conference Name: IEEE Transactions on Visualiza-
tion and Computer Graphics.
Miller, R., Mozhayskiy, V., Tagkopoulos, L., and Ma, K.-L.
(2011). EVEVis: A multi-scale visualization system
for dense evolutionary data. In 2011 IEEE Sympo-
sium on Biological Data Visualization (BioVis)., pages
143–150.
Misue, K. and Zhou, Q. (2011). Drawing Semi-bipartite
Graphs in Anchor+Matrix Style. In 2011 15th In-
ternational Conference on Information Visualisation,
pages 26–31. ISSN: 2375-0138.
Mueller, C., Martin, B., and Lumsdaine, A. (2007). A com-
parison of vertex ordering algorithms for large graph
visualization. In 2007 6th International Asia-Pacific
Symposium on Visualization, pages 141–148.
Paduano, F. and Forbes, A. G. (2015). Extended LineSets:
a visualization technique for the interactive inspection
of biological pathways. BMC Proceedings, 9(6):S4.
Partl, C., Lex, A., Streit, M., Kalkofen, D., Kashofer, K.,
and Schmalstieg, D. (2013). enRoute: dynamic path
extraction from biological pathway maps for explor-
ing heterogeneous experimental datasets. BMC Bioin-
formatics, 14(19):S3.
Pezzotti, N., Fekete, J.-D., H
¨
ollt, T., Lelieveldt, B. P., Eise-
mann, E., and Vilanova, A. (2018). Multiscale Visu-
alization and Exploration of Large Bipartite Graphs.
Computer Graphics Forum, 37(3):549–560.
Ravi, N. (2024). nikhil-ravi/harry-potter-interactions.
original-date: 2023-11-05T01:37:30Z.
Rodgers, P., Stapleton, G., and Chapman, P. (2015). Visual-
izing Sets with Linear Diagrams. ACM Transactions
on Computer-Human Interaction, 22(6):27:1–27:39.
Sadana, R., Major, T., Dove, A., and Stasko, J. (2014). On-
Set: A Visualization Technique for Large-scale Bi-
nary Set Data. IEEE Transactions on Visualization
and Computer Graphics, 20(12):1993–2002.
Sayers, C. (2004). Node-centric RDF Graph Visualization.
Shank, S. D., Weaver, S., and Kosakovsky Pond, S. L.
(2018). phylotree.js - a JavaScript library for appli-
cation development and interactive data visualization
in phylogenetics. BMC Bioinformatics, 19(1):276.
Shneiderman, B. (1996). The eyes have it: a task by data
type taxonomy for information visualizations. In Pro-
ceedings 1996 IEEE Symposium on Visual Languages,
pages 336–343. ISSN: 1049-2615.
Terje Bjørke, J., Nilsen, S., and Varga, M. (2010). Visual-
ization of network structure by the application of hy-
pernodes. International Journal of Approximate Rea-
soning, 51(3):275–293.
Vehlow, C., Beck, F., Auw
¨
arter, P., and Weiskopf, D.
(2015a). Visualizing the Evolution of Communi-
ties in Dynamic Graphs. Computer Graphics Forum,
34(1):277–288.
Vehlow, C., Beck, F., and Weiskopf, D. (2015b). The State
of the Art in Visualizing Group Structures in Graphs.
Eurographics Conference on Visualization (EuroVis) -
STARs, page 20 pages.
Vijaymeena, M. and Kavitha, K. (2016). A Survey on Sim-
ilarity Measures in Text Mining. Machine Learning
and Applications: An International Journal, 3(1):19–
28.
Wang, X., Liu, S., Liu, J., Chen, J., Zhu, J., and Guo, B.
(2016). TopicPanorama: A Full Picture of Relevant
Topics. IEEE Transactions on Visualization and Com-
puter Graphics, 22(12):2508–2521.
Xia, J., Gill, E. E., and Hancock, R. E. W. (2015). Net-
workAnalyst for statistical, visual and network-based
meta-analysis of gene expression data. Nature Proto-
cols, 10(6):823–844.
Xu Liu, Ming Luo, and Ben Shneiderman (2005). Visual-
ization of Sets.
Yoghourdjian, V., Dwyer, T., Klein, K., Marriott, K., and
Wybrow, M. (2018). Graph Thumbnails: Identifying
and Comparing Multiple Graphs at a Glance. IEEE
Transactions on Visualization and Computer Graph-
ics, 24(12):3081–3095.
Penta: Towards Visualizing Compound Graphs as Set-Typed Data
921
