
RePAD3: Advanced Lightweight Adaptive Anomaly Detection for
Univariate Time Series of Any Pattern
Ming-Chang Lee
a
, Jia-Chun Lin
b
and Sokratis Katsikas
c
Department of Information Security and Communication Technology,
Norwegian University of Science and Technology (NTNU), Gjøvik, Norway
Keywords:
Anomaly Detection, GrammarViz 3.0, Recurrent Time Series, RePAD2, Univariate Time Series,
Unsupervised Learning.
Abstract:
Univariate time series anomaly detection is crucial for early risk identification and prompt response, making
it essential for diverse applications such as energy usage monitoring, temperature monitoring, heart rate mon-
itoring. To be applicable and valuable in the real world, anomaly detection must process time series data on
the fly, detect anomalies in real time, and adapt to unexpected pattern changes in an efficient and lightweight
manner. Several anomaly detection approaches with such capability have been introduced; however, they
often generate frequent false positives. In this paper, we present a lightweight and adaptive anomaly detec-
tion approach named RePAD3 by leveraging the strengths of two state-of-the-art methods and mitigating their
shortcomings with advanced detection and pattern inspection. According to our extensive experiments with
real-world time series datasets, RePAD3 demonstrates superior detection accuracy and lower false positives
across various patterns presented in the time series, thereby broadening its real-world applicability.
1 INTRODUCTION
A univariate time series refers to a sequence of ob-
servations or measurements recorded at consistent in-
tervals over time and associated with a single time-
dependent variable (Bl
´
azquez-Garc
´
ıa et al., 2021).
It may display either a non-recurrent pattern or a
recurrent pattern. Examples of such data include
room temperature, CO2 levels, energy usage, vibra-
tion levels, and blood pressure. This type of time
series data is widespread in various monitoring sys-
tems and IoT devices across multiple sectors, such as
cyber-physical systems (Ma et al., 2023), smart cities,
healthcare monitoring (Haque et al., 2015), environ-
mental tracking, and smart manufacturing.
Identifying unusual or abnormal data points
within univariate time series is crucial for indus-
tries and organizations, as these anomalous data
points can signal potential issues such as intrusion
attempts, malicious attacks, or system malfunction.
Providing real-time anomaly detection is also imper-
ative as it enables prompt responses to emerging is-
a
https://orcid.org/0000-0003-2484-4366
b
https://orcid.org/0000-0003-3374-8536
c
https://orcid.org/0000-0003-2966-9683
sues and helps prevent catastrophic failures or events
(Bl
´
azquez-Garc
´
ıa et al., 2021; Lee et al., 2020a; Lee
et al., 2020b). Furthermore, for anomaly detection
to be truly valuable and applicable in real-world sce-
narios, it must process time series data on the fly,
accurately detect anomalies as they occur, and effi-
ciently adapt to unforeseen pattern changes without
any downtime (Lee and Lin, 2023a; Wu et al., 2020).
Many univariate time series anomaly detection ap-
proaches, based on either statistical methods or ma-
chine learning, have been developed. However, they
often lack the ability to adapt to changes in data pat-
terns over time. In recent years, several anomaly de-
tection approaches utilizing recurrent neural networks
have been introduced, such as RePAD (Lee et al.,
2020b), ReRe (Lee et al., 2020a), and RePAD2 (Lee
and Lin, 2023a). Nonetheless, they encounter diffi-
culties with high false positives when applied to time
series that exhibit recurrent patterns. To address the
aforementioned issues, this paper proposes RePAD3,
a lightweight and adaptive anomaly detection ap-
proach for univariate time series, based on two meth-
ods, RePAD2 (Lee and Lin, 2023a) and GrammarViz
3.0 (Senin et al., 2018). The former excels at provid-
ing real-time, lightweight, unsupervised, and adaptive
anomaly detection, while the latter excels in identify-
574
Lee, M.-C., Lin, J.-C. and Katsikas, S.
RePAD3: Advanced Lightweight Adaptive Anomaly Detection for Univariate Time Series of Any Pattern.
DOI: 10.5220/0013242700003890
In Proceedings of the 17th International Conference on Agents and Artificial Intelligence (ICAART 2025) - Volume 2, pages 574-585
ISBN: 978-989-758-737-5; ISSN: 2184-433X
Copyright © 2025 by Paper published under CC license (CC BY-NC-ND 4.0)

ing recurrent patterns. However, RePAD2 may pro-
duce notable false positives with recurrent time se-
ries. Conversely, GrammarViz 3.0 (GV for short), an
offline tool, allows users to configure parameters and
visually validate results but cannot process time series
in real time as new data points emerge.
To leverage the strengths of both methods and mit-
igate their drawbacks, RePAD3 employs both meth-
ods to jointly detect anomalies in the target time se-
ries. Whenever RePAD2 identifies an anomalous data
point, RePAD3 evaluates whether it should be con-
sidered anomalous by performing advanced detection
based on recent data fluctuations within the time se-
ries. This strategy helps reduce false positives intro-
duced by RePAD2. Additionally, RePAD3 strategi-
cally invokes GV periodically to identify all possible
recurrent patterns within the current time series. Only
qualified recurrent patterns defined by RePAD3 are
considered to determine if the time series has shifted
its pattern and whether this transition should be con-
sidered anomalous. This design aids in identifying
recurrent patterns and reducing false positives.
To demonstrate the performance of RePAD3, we
conducted experiments with four different real-world
time series datasets to compare RePAD3 against sev-
eral state-of-the-art anomaly detection approaches.
The results demonstrate that RePAD3 excels in de-
tecting anomalies in both recurrent and non-recurrent
time series, achieving high efficiency and accuracy. It
notably outperforms the other approaches by reduc-
ing false positives without any significant increase in
detection time.
The rest of the paper is organized as follows: Sec-
tion 2 reviews related work. Section 3 introduces
RePAD2 and GV. Section 4 presents the design of
RePAD3. Section 5 covers experiments and results.
Section 6 outlines conclusions and future work.
2 RELATED WORK
Time series anomaly detection approaches can be di-
vided into three categories: statistical methods, ma-
chine learning methods, and deep learning methods
(Braei and Wagner, 2020). Statistical-based meth-
ods create a model of normal behavior from historical
time series data to detect anomalies. Typical exam-
ples include Autoregressive Model, Moving Average
Model, and Autoregressive Moving Average Model,
as mentioned in (Braei and Wagner, 2020). Lumi-
nol (LinkedIn, 2018), developed by LinkedIn, calcu-
lates an anomaly score for each data point in a time
series. However, final determination requires human
domain expertise. Siffer et al. proposed a detection
method based on Extreme Value Theory without as-
suming time series distribution or requiring manual
threshold settings (Siffer et al., 2017), but it requires
a significant calibration period.
Machine learning-based anomaly detection meth-
ods excel in diverse domains beyond traditional sta-
tistical approaches because they do not need to under-
stand the data generation process or assume a specific
model (Braei and Wagner, 2020; Breiman, 2001).
Examples include subsequence time-series clustering,
local outlier factor, Isolation Forest, One-Class SVN,
and Extreme Gradient boosting, as described in (Braei
and Wagner, 2020). Isolation Forest (Liu et al., 2008)
gained more popularity due to its simplicity and ef-
fectiveness, but it treats each data point independently
without considering temporal order, which might lead
to poor detection performance (Audibert et al., 2020).
Deep learning-based anomaly detection leverages
neural networks, such as recurrent neural networks
(RNN), long short-term memory (LSTM), convolu-
tional neural networks, and autoencoders, to iden-
tify anomalies in time series data. Goh et al. intro-
duced an unsupervised approach to detect cyber at-
tacks in cyber-physical systems (Goh et al., 2017).
The method leverages LSTM-RNN as a time series
predictor and employs the cumulative sum method to
identify anomalies within a simulated water treatment
plant environment. However, the model lacks adapt-
ability as it is trained offline without subsequent up-
dates or retraining.
RePAD (Lee et al., 2020b) represents the first ef-
fort to train detection models online and automatically
adapt to pattern changes without human intervention.
It uses a simple LSTM model trained with short-term
historical data points to predict and detect anoma-
lies. If the model fails to accurately predict a data
point, RePAD replaces it with a new model trained
on the latest data points. If the new model also fails
to predict the same data point, the data point is con-
sidered anomalous. This enables RePAD to adapt to
pattern changes in the time series and identify anoma-
lies. However, RePAD experiences high false posi-
tives with recurrent time series and may exhaust sys-
tem resources with open-ended time series.
ReRe (Lee et al., 2020a) builds upon RePAD to
enhance detection accuracy by employing two LSTM
detectors to detect anomalies. While one detector op-
erates similarly to RePAD, the other uses a stricter
detection threshold. However, the detection improve-
ment seems limited. RePAD2 (Lee and Lin, 2023a)
employs the same logic as RePAD for anomaly detec-
tion but adjusts the design of the detection threshold.
In RePAD, all historical Average Absolute Relative
Error (AARE) values are used to calculate its thresh-
RePAD3: Advanced Lightweight Adaptive Anomaly Detection for Univariate Time Series of Any Pattern
575

old, which could potentially strain system resources
when dealing with open-ended time series. To miti-
gate this, RePAD2 considers only a fixed number of
recent AARE values. Nevertheless, RePAD2 does not
resolve the issue of high false positives in recurrent
time series. SALAD (Lee et al., 2021b) is designed
for recurrent time series. It converts the time series
into AARE values dynamically in its first phase and
then predicts future AARE values based on short-term
historical data in its second phase. However, users
need knowledge about the duration of recurrent pat-
terns in the target time series to pre-configure the pa-
rameter b, which is the number of data points used to
train the LSTM model in the first phase.
Other time series anomaly detection approaches
based on deep learning, such as (Chen et al., 2022),
(Yang et al., 2023), and (Wang et al., 2023), have
also been introduced. However, they often require of-
fline model training, which can be time-consuming,
and they might not be able to adapt to pattern changes
within time series in dynamic environments.
3 BACKGROUND
Before introducing RePAD3 in details, this section
provides a brief overview of RePAD2 and GV.
3.1 RePAD2
RePAD2 (Lee and Lin, 2023a) is designed to detect
anomalous data points in real time from an open-
ended time series while adapting to pattern changes
over time. Let T denote the current time point, start-
ing from 0, which indicates the first time point in the
target time series. RePAD2 always uses three his-
torical data points to train an LSTM model and uses
the model to predict the next upcoming data point.
Hence, the first model can be trained at time point 2,
and the second at time point 3. In order to identify
anomalies, RePAD2 calculates an AARE value at ev-
ery T, denoted by AARE
T
, using Equation 1.
AARE
T
=
1
3
T
∑
y=T −2
| D
y
−
c
D
y
|
D
y
, T ≥ 5 (1)
D
y
and
c
D
y
represent the observed and predicted data
point values at time point y, respectively. A low
AARE value signifies that the predicted values are
close to the observed values. Additionally, to cal-
culate its detection threshold thd (see Equation 2),
RePAD2 requires at least three AARE values, allow-
ing it to calculate the threshold at each time point
from time point 7 onward. In Equations 3 and 4, W
limits the number of historical AARE values used to
calculate thd. If the total number of historical AARE
values is less than W, all values are used; otherwise,
only the W most recent ones are used, preventing re-
source exhaustion.
thd = µ
aare
+ 3 · σ
aare
, T ≥ 7 (2)
µ
aare
=
(
1
T −4
∑
T
x=5
AARE
x
, 7 ≤ T < W + 4
1
W
∑
T
x=T −W +1
AARE
x
, T ≥ W + 4
(3)
σ
aare
=
q
∑
T
x=5
(AARE
x
−µ
aare
)
2
T −4
, 7 ≤ T < W + 4
q
∑
T
x=T −W+1
(AARE
x
−µ
aare
)
2
W
, T ≥ W + 4
(4)
At every T where T ≥ 7, RePAD2 compares
AARE
T
with the current thd. If AARE
T
does not ex-
ceed thd, the data point at T, denoted by D
T
, is not
considered anomalous, and the current LSTM model
is retained for future prediction. However, if AARE
T
≥ thd, RePAD2 attempts to adapt to potential pattern
changes by retraining another LSTM model with the
three most recent data points to re-predict D
T
. If the
new model yields an AARE value lower than thd,
RePAD2 does not consider D
T
anomalous. Other-
wise, RePAD2 immediately reports D
T
as anomalous,
allowing for immediate actions or countermeasures.
3.2 GV
GV (Senin et al., 2018), standing for GrammarViz
3.0, is an interactive tool for time series pattern dis-
covery. It employs grammar-based compression to
detect and visualize anomalies. To use it, users need
to input an entire time series and configure three pa-
rameters: sliding window size (sw), PAA size (w), and
alphabet size (α). Note that PAA stands for Piecewise
Aggregate Approximation.
GV consists of three phases. In the first phase, GV
converts the time series into a symbolic representa-
tion. The process begins with applying sw, which cap-
tures overlapping segments as it moves along the time
series. Each segment is then normalized and reduced
using PAA(Keogh et al., 2001), where the segment is
divided into w parts, and the average data value within
each part is calculated. These average values are then
mapped to one of α symbols, forming a symbolic rep-
resentation. Figure 1 illustrates how a time series of
100 data points transforms into the string ‘cabbc’.
In the second phase, GV utilizes algorithms like
Sequitur (Nevill-Manning and Witten, 1997) to ana-
lyze the symbolic representation strings and extract
production rules that describe observed patterns. The
resulting grammar models repetitive and significant
patterns. The final phase involves detecting mo-
tifs and anomalies using the grammar, where motifs
ICAART 2025 - 17th International Conference on Agents and Artificial Intelligence
576

Figure 1: An example of time series discretization (Senin,
2023).
represent typical behaviors or recurrent events, and
anomalies indicate deviations from normal behavior.
GV includes visualization tools for users to identify
motifs and anomalies in the time series. It is impor-
tant to note that GV was designed for offline opera-
tions. Converting GV into an online tool by launching
it whenever a new data point is observed may seem
straightforward, but it is inefficient and could lead to
unnecessary computational overhead. Additionally,
GV might overwrite and deny some of anomalies that
they have claimed previously) (Lee et al., 2021b).
4 THE DESIGN OF RePAD3
Figure 2 illustrates the pseudo code of RePAD3. Let
t denote the current time point. When t equals 0, in-
dicating the first time point in the target time series,
RePAD3 launches RePAD2 by injecting the first data
point D
0
into RePAD2, and it also assumes that the
time series is non-recurrent by setting flag F to False.
Whenever time advances, RePAD3 collects a
newly received data point D
t
and injects it into
RePAD2, then waits for notifications. If D
t
is identi-
fied as anomalous by RePAD2, RePAD3 further eval-
uates whether D
t
should be reported as anomalous. To
achieve this advanced detection, a threshold denoted
by thd
ad
is calculated using Equation 5, based on the
Three-Sigma Rule (Hochenbaum et al., 2017).
thd
ad
= µ + 3 · σ (5)
µ and σ represent the mean and standard deviation of
previously collected data point values, and they are
calculated using Equations 6 and 7 respectively. To
prevent slowdown or resource exhaustion, parameter
L limits the number of historical data point values
used for calculating thd
ad
. If the total number of col-
lected data points is less than L, all are used; other-
wise, only the L most recent ones are considered. If
D
t
exceeds thd
ad
, RePAD3 immediately reports D
t
as
anomalous; otherwise, it considers D
t
normal and in-
structs RePAD2 to continue using its current LSTM
model for future prediction (see lines 9 and 10 of Fig-
ure 2).
µ =
(
1
t+1
∑
t
x=0
D
x
,t < L
1
L
∑
t
x=t−L+1
D
x
,t ≥ L
(6)
σ =
q
∑
t
x=0
(D
x
−µ)
2
t+1
, 7 ≤ t < L
q
∑
t
x=t−L+1
(D
x
−µ)
2
L
,t ≥ L
(7)
Furthermore, RePAD3 periodically inspects the time
series to identify pattern changes and detect anomalies
by invoking GV whenever t >= 4K and t mod K = 0
(see lines 11 and 12). If users can easily observe a re-
curring pattern within the target time series, they can
set K to roughly the total number of data points within
that pattern. Otherwise, K is determined by the dura-
tion for which users want to search for recurring pat-
terns, calculated based on the data point interval of the
target time series. For example, if users are seeking
daily patterns in a time series with 1-hour interval, K
is set to 24; for weekly patterns, K is set to 168. When-
ever GV is launched at intervals of K, it searches for
motifs within the last 4K period by setting its sliding
window size to K. To simply the design of RePAD3,
both PAA and alphabet sizes of GV are consistently
set to 4, the default setting for GV.
It is important to note that the motifs identified
by GV may overlap. If the overlap is substantial, as
with the four motifs in Figure 3(a), each marked with
an arrow, RePAD3 does not consider the time series
to be recurrent. Moreover, if the motifs identified by
GV contain fewer than three distinct alphabet letters,
such as the motif ‘abbababa’, RePAD3 does not con-
sider these motifs as qualified recurrent patterns be-
cause they might indicate minor, frequent fluctuations
in time series. To summarize, RePAD3 employs two
conditions to determine qualified motifs: 1) there must
be two similar subsequences within the last 4K pe-
riod, with adjacent subsequences not overlapping by
more than five data points, and 2) each subsequence
must contain at least three different alphabet letters.
Figure 3(b) illustrates an example where two subse-
quences are considered qualified motifs.
As shown on lines 13 and 14, if the current time
series is non-recurrent (i.e., F is False) but GV returns
qualified motifs within the last 4K period, RePAD3
determines whether the time series has transitioned
from non-recurrent to recurrent. To do this, it calcu-
lates the difference between the current time point t
and the end time point of the last qualified motif found,
denoted by e, and then compares the difference with a
pre-defined small value x. If t − e < x (see line 16),
RePAD3 considers the time series as recurrent from
that point onward and set F to True because a qualified
motif has recently emerged. In this scenario, RePAD3
does not consider the transition anomalous, as it sig-
nifies that the time series has evolved into a more pre-
dictable and stable pattern.
RePAD3: Advanced Lightweight Adaptive Anomaly Detection for Univariate Time Series of Any Pattern
577
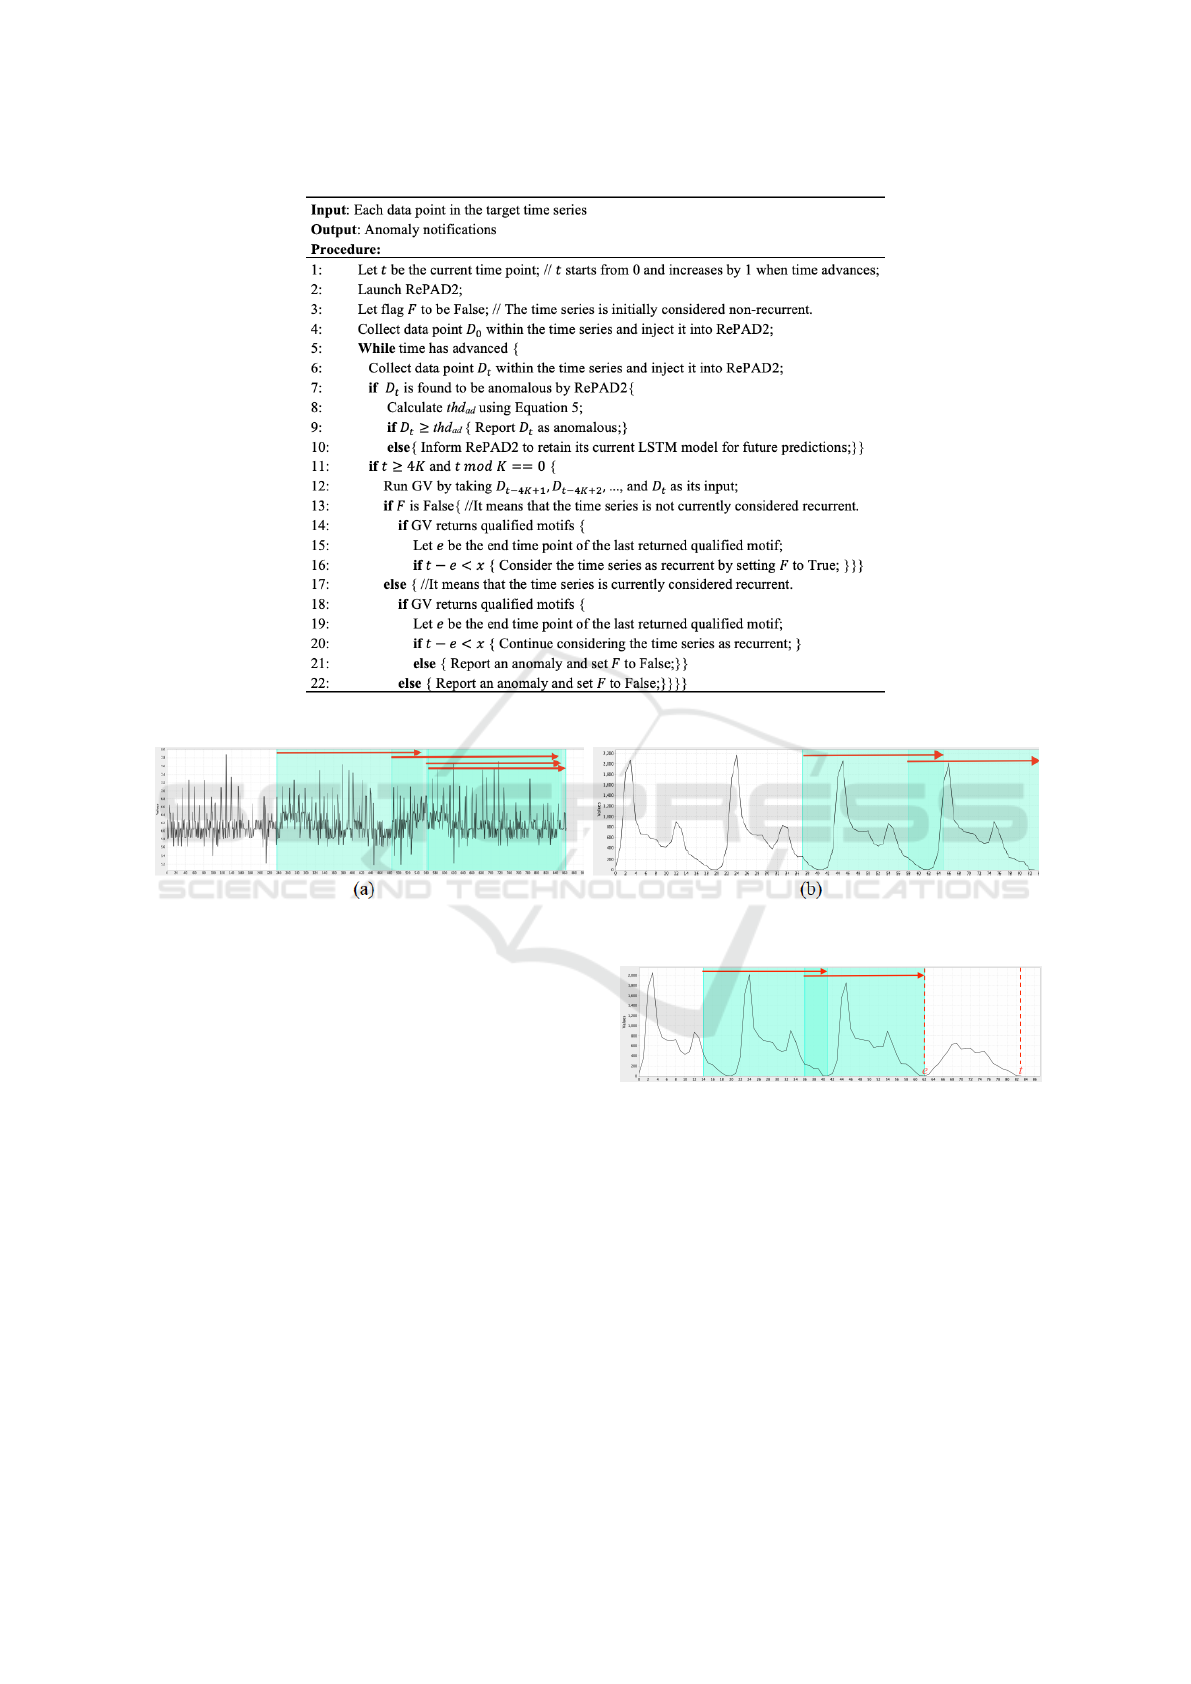
Figure 2: The pseudo code of RePAD3.
Figure 3: Examples of motifs: (a) shows unqualified motifs; (b) depicts qualified motifs.
However, if F is True and GV also returns qual-
ified motifs, RePAD3 determines whether the time
series is still recurrent by re-calculating the differ-
ence between t and e and comparing it with x. If
t − e < x (see line 20), RePAD3 still considers the
time series recurrent. However, if t − e ≥ x (see line
21), RePAD3 instantly reports an anomaly because
the time series has likely transitioned from recurrent
to non-recurrent, as shown in Figure 4. This may
indicate that an evident change or breakdown in the
previously stable state. Another case where RePAD3
reports an anomaly is when F is True but GV fails to
return any qualified motifs (see line 22), implying that
the time series has clearly transitioned from recurrent
to non-recurrent.
Based on the aforementioned design, it is evident
that RePAD3 does not merely utilize RePAD2 and GV
to detect anomalies. Instead, it leverages the strengths
of both methods while attempting to address their lim-
itations by introducing the advanced detection and
pattern inspection.
Figure 4: Time series transition from recurrent to non-
recurrent.
5 EVALUATION AND RESULTS
To evaluate RePAD3, we compared it against four
other state-of-the-art approaches known for their real-
time, unsupervised, and adaptive anomaly capabilities
without offline model training: RePAD (Lee et al.,
2020b), RePAD2 (Lee and Lin, 2023a), ReRe (Lee
et al., 2020a), and SALAD (Lee et al., 2021b). In or-
der to ensure a fair and relevant comparison, we ex-
cluded approaches that rely on offline model train-
ing, as they are often pre-retrained with extensive
datasets, which differs completely from the design of
ICAART 2025 - 17th International Conference on Agents and Artificial Intelligence
578

Table 1: Details of the four real-world time series used in
our experiments.
BSMS P3 CPU-B3B P11
Total Data Points 744 8493 4032 3535
Data Point Interval 1 hour n/a 5 min n/a
Total Point Anomalies 0 0 2 0
Total Sequential Anomalies 1 1 0 2
RePAD3. We conducted four experiments using four
real-world time series data with distinct patterns to
demonstrate RePAD3’s detection capabilities across
diverse cases. Table 1 summarizes these four time
series. The first, Bourke Stree Mall South (BSMS),
features 744 data points from Melbourne Pedestrian
Foot Traffic (CityofMelbourne, 2020). The second,
P3, consists of 8493 data points related to power chan-
nel from the Soil Moisture Active Passive satellite
(SMAP) dataset (Hundman et al., 2018). The third
time series, rds-cpu-utilization-e47b3b (CPU-B3B),
includes 4032 data points related to CPU utiliza-
tion from the Numenta Anomaly Benchmark dataset
(Lavin and Ahmad, 2015). The last time series, P11,
comprises 3535 data points from the Curiosity Rover
on Mars (MSL) dataset (Hundman et al., 2018).
Each time series contains either point or sequen-
tial anomalies, annotated by human experts. A point
anomaly is considered as a single data point that sig-
nificantly differs from the rest of the dataset, while a
sequential anomaly consists of consecutive data points
deviating from the expected pattern (Schneider et al.,
2021). In addition, BSMS and CPU-B3B feature data
point intervals, whereas P3 and P11 do not, as their
timestamps have been anonymized.
To evaluate the detection accuracy of all ap-
proaches, we adopted the evaluation method outlined
in (Lee et al., 2020a) to measure precision (defined
as
T P
T P+F P
), recall (defined as
T P
T P+F N
), and F1-score
(defined as 2 ·
precision·recall
precision+recall
). Here, TP, FP, and FN
represent true positives, false positives, and false neg-
atives, respectively. More specifically, if any point
anomaly occurring at time point z can be detected
within a time range from z−k to z+k, it is considered
correctly detected. On the other hand, if a sequential
anomaly starting at time point i and ending at time
point j can be detected within the period from i−k to
j, this detection is deemed correct. We adhered the
guidelines used in (Ren et al., 2019), setting k to 3 for
hourly-interval time series and 7 for minutely-interval
time series across all the approaches. Furthermore, we
evaluated the efficiency of each approach using three
metrics:
• Online LSTM retraining ratio: Proportion of data
points requiring online LSTM model retraining to
the total data points in the time series. A lower
ratio signifies less resource consumption.
• DT-noTrain: Time taken to detect anomaly for
each data point when model retraining is not re-
quired.
• DT-Train: Time taken to detect anomaly for each
data point when model retraining is required.
To ensure a fair comparison, we attempted to con-
figure the same hyperparameter and parameter setting
for all the approaches. However, SALAD consists of
two phases, making identical configuration impossi-
ble. Despite this, we aligned the settings as closely as
feasible. Table 2 lists the hyperparameter and param-
eter settings for all the approaches compared. These
settings closely adhere to those used by ReRe (Lee
et al., 2020a) and RePAD2 (Lee and Lin, 2023a), en-
suring consistent and comparable comparison across
different approaches. Specifically, the Look-Back pa-
rameter was set to 3, and the Predict-Forward param-
eter was set to 1, as recommended by Lee et al. (Lee
et al., 2021a) The LSTM models trained in all the
approaches have only one hidden layer with 10 hid-
den units, making them very lightweight. In addition,
Early Stopping (EarlyStopping, 2023) was used in all
the approaches to automatically determine the number
of epochs, preventing the LSTM models from overfit-
ting the data. The maximum number of epochs for
all the approaches was set at 50, except for the first
phase of SALAD, which was set to 100 due to the in-
creased data points used for model (re)training (Lee
et al., 2021b).
Table 2: Hyperparameter and parameter setting.
RePAD, ReRe,
RePAD2, RePAD3
SALAD
Phase 1 Phase 2
Total Hidden Layers 1 1 1
Total Hidden Units 10 10 10
Maximum Epochs 50 100 50
Learning Rate 0.005 0.0055 0.0055
Activation Function tanh tanh sigmoid
Random Seed 140 140 140
Look-back parameter 3 – 3
Predict-forward parameter 1 1 1
Recall that RePAD3 employs RePAD2 to identify
suspicious data points, so it inherits parameter W used
by RePAD2 to avoid resource exhaustion. To ensure
fairness in comparison, W was set to the total length of
each time series for RePAD2 and RePAD3, allowing
all the approaches to utilize all historical AARE val-
ues for their dynamic threshold calculation. This set-
ting also means that RePAD2 would operate exactly
the same as RePAD.
Additionally, using RePAD3 requires pre-
configuring the parameters L and x. The former
is used in Equations 6 and 7 to perform advanced
RePAD3: Advanced Lightweight Adaptive Anomaly Detection for Univariate Time Series of Any Pattern
579
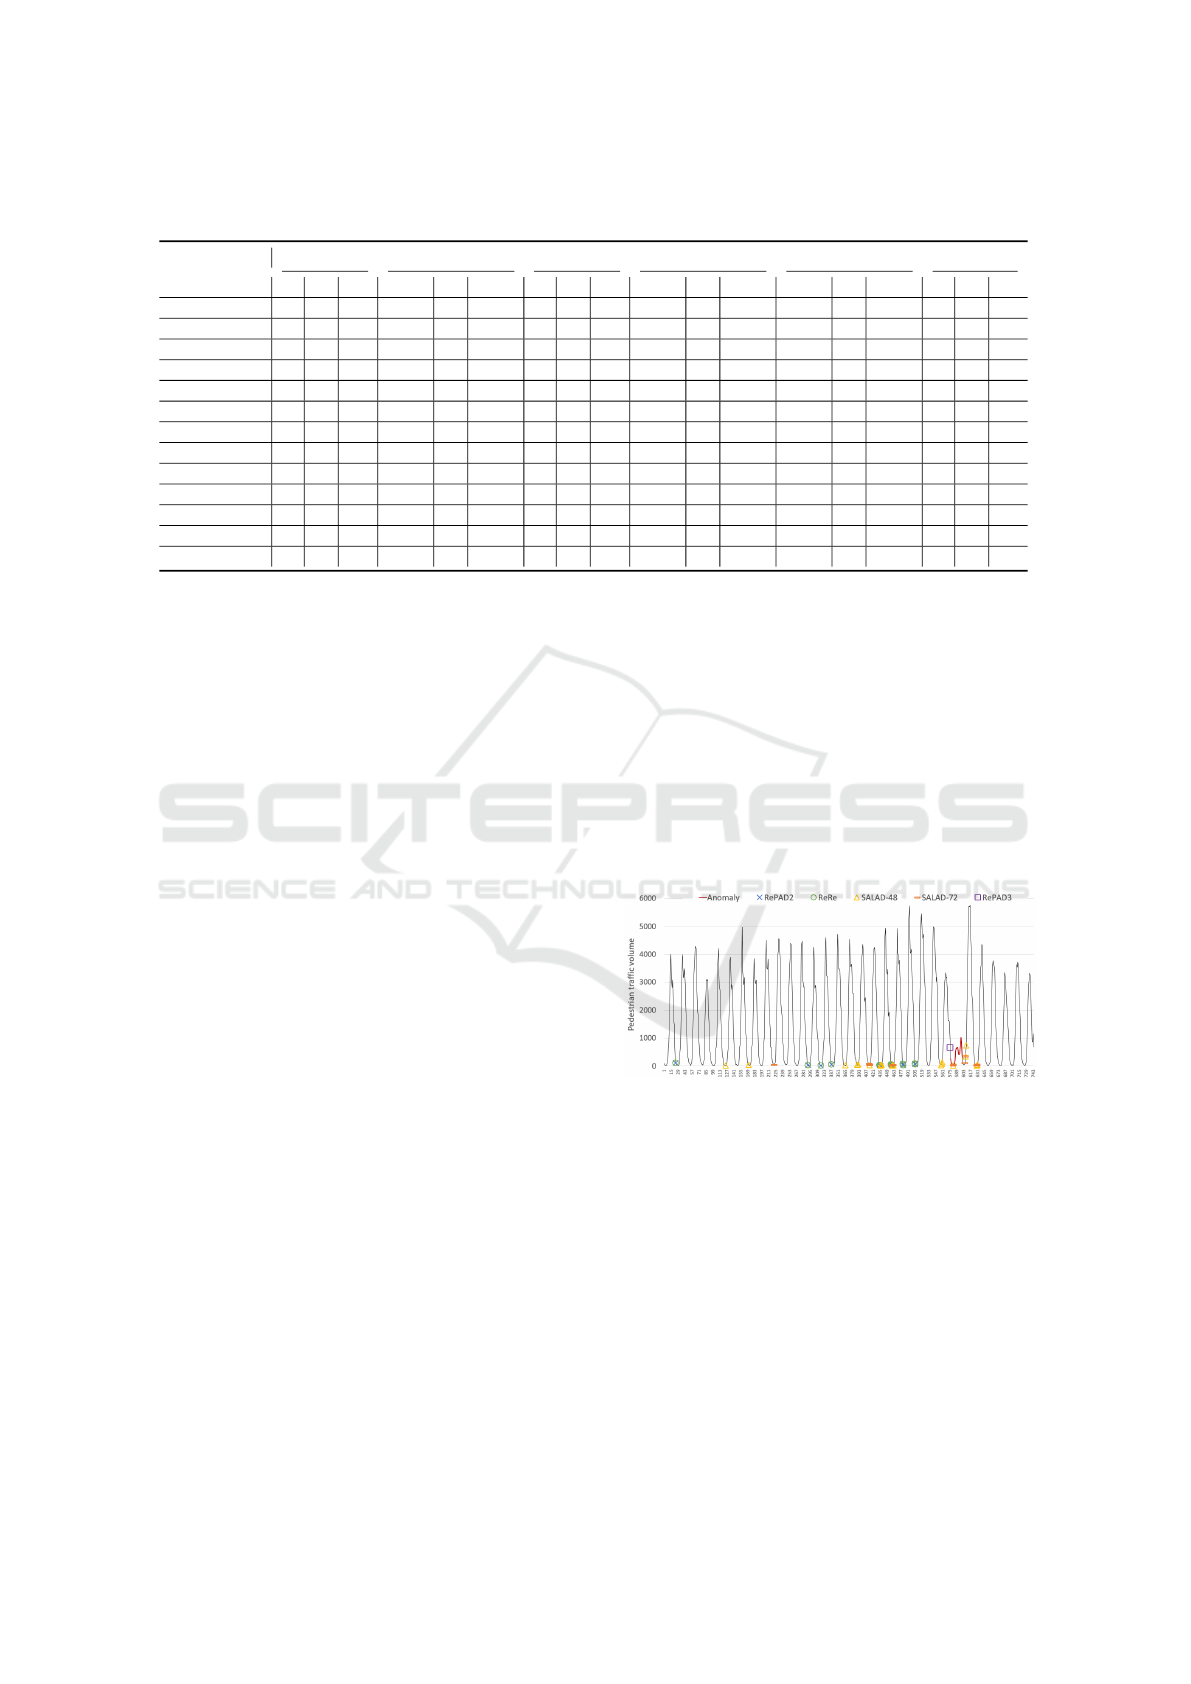
Table 3: Detection accuracy of RePAD3 across various settings of parameter L for advanced detection in six different time
series. Note that P, R, and F1 denote precision, recall, and F1-score, respectively.
P2 P3 P4 P11 P14 P15
P R F1 P R F1 P R F1 P R F1 P R F1 P R F1
RePAD3(L=8) - 0 - - 0 - 0 0 - 0 0 - 0 0 - 0 0 -
RePAD3(L=9) - 0 - - 0 - 0 0 - 0 0 - 0 0 - 0 0 -
RePAD3(L=10) - 0 - - 0 - 0 0 - 0 0 - 0 0 - 0 0 -
RePAD3(L=11) 1 1 1 1 1 1 1 1 1 1 1 1 1 1 1 1 1 1
RePAD3(L=12) 1 1 1 1 1 1 1 1 1 1 1 1 1 1 1 1 1 1
RePAD3(L=13) 1 1 1 1 1 1 1 1 1 1 1 1 0.995 1 0.997 1 1 1
RePAD3(L=14) 1 1 1 1 1 1 1 1 1 0.996 1 0.998 0.995 1 0.997 1 1 1
RePAD3(L=15) 1 1 1 0.999 1 0.999 1 1 1 0.996 1 0.998 0.989 1 0.994 1 1 1
RePAD3(L=16) 1 1 1 0.999 1 0.999 1 1 1 0.996 1 0.998 0.989 1 0.994 1 1 1
RePAD3(L=17) 1 1 1 0.999 1 0.999 1 1 1 0.996 1 0.998 0.989 1 0.994 1 1 1
RePAD3(L=18) 1 1 1 0.999 1 0.999 1 1 1 0.996 1 0.998 0.984 1 0.992 1 1 1
RePAD3(L=19) 1 1 1 0.999 1 0.999 1 1 1 0.996 1 0.998 0.978 1 0.989 0 0 -
RePAD3(L=20) 1 1 1 0.999 1 0.999 1 1 1 0.996 1 0.998 0.973 1 0.986 0 0 -
detection on any suspicious data points reported by
RePAD2. To determine an appropriate value for L, we
evaluated the advanced detection function of RePAD3
on six different time series (named P2, P3, P4, P11,
P14, and P15) from the SMAP and MSL datasets by
disabling periodic invocations of GV. Table 3 details
the detection accuracy of RePAD3 across 13 settings
of L on these six time series. It is evident that setting
L to 11 or 12 yields the highest F1-score of 1 across
all the six time series. In contrast, lower values of
L resulted in a recall of 0, and higher values of L
result in false positives. Based on these results, we
recommend setting L to 11 or 12. Therefore, in this
paper, L was set to 11 for RePAD3.
On the other hand, recall that the parameter x
determines whether a qualified motif has recently
emerged (see lines 16 and 20 in Figure 2). Setting x
too high can lead to misidentification of data patterns;
thus, a lower value is recommended. In all the exper-
iments, x was carefully set to 10 based on a thorough
analysis. This setting implies that a time series is con-
sidered recurrent if a qualified motif appears within
the last 10 time points.
All the approaches were implemented using DL4J
(Deeplearning4j, 2023), a Java-based programming li-
brary for deep learning. All the experiments were con-
ducted on a laptop running MacOS Sonoma 14.2.1,
equipped with a 2.6 GHz 6-Core Intel Core i7 pro-
cessor and 16GB DDR4 SDRAM. To simulate the
streaming behavior of time series, we adopted Apache
Kafka with version 2.13-3.4.0. For each time series,
each data point was sequentially injected into each ap-
proach being compared.
5.1 Evaluation Results on BSMS
In the first experiment, we evaluated the five ap-
proaches on BSMS, which has a data point interval of
one hour. Figure 5 depicts the entire BSMS time se-
ries, with the sequential anomaly marked in red. Re-
call that SALAD requires users to configure parame-
ter b based on their knowledge about the duration of
recurrent patterns in the target series. Given that the
duration of recurrent patterns in BSMS roughly con-
sists of 24 data points, we set b to 48 (i.e., 24 · 2) and
72 (i.e., 24 ·3) to evaluate SALAD’s performance un-
der these two settings. These two variants are denoted
by SALAD-48 and SALAD-72. Additionally, due to
the evident recurring pattern, we set parameter K to
24 for RePAD3. For the remaining tested approaches,
no such parameters need to be pre-configured.
Figure 5: Anomalies detected within BSMS by each tested
approach, with a true sequential anomaly highlighted in red.
Figure 5 shows all data points detected as anoma-
lies by each tested approach, and Table 4 provides
detailed results on detection accuracy and time effi-
ciency. It is clear from the table that RePAD and
RePAD2 exhibited identical detection accuracy, as
they both utilized all historical AARE values to calcu-
late their detection threshold in this experiment, ren-
dering them indistinguishable. Both were unable to
identify the sequential anomaly, resulting in precision
and recall scores of 0. Because of this reason, we
omit RePAD’s detection results in Figure 5, as they
mirror those of RePAD2. Furthermore, we observed
that ReRe could not detect the anomaly either, imply-
ICAART 2025 - 17th International Conference on Agents and Artificial Intelligence
580

Table 4: Performance results of all compared approaches on BSMS.
Detection
accuracy
Online LSTM retraining ratio DT-Train (sec) DT-noTrain (sec)
P R F1 Avg. Std. Avg. Std.
RePAD 0 0 N/A 0.042(=31/744) 0.265 0.042 0.012 0.001
RePAD2 0 0 N/A 0.042(=31/744) 0.267 0.043 0.012 0.001
ReRe 0 0 N/A
D1: 0.042(=31/744)
D2: 0.052(=39/744)
0.595 0.148 0.052 0.031
SALAD-48 0.533 1 0.695
Phase 1: 0.109(=81/744)
Phase 2: 0.063(=41/648)
4.867 0.532 0.197 0.090
SALAD-72 0.667 1 0.800
Phase 1: 0.132(=98/744)
Phase 2: 0.047(=28/600)
7.035 0.545 0.256 0.114
RePAD3 1 1 1 0.071(=53/744) 0.274 0.050 0.016 0.003
ing that its parallel detectors still cannot recognize the
recurrent pattern within BSMS.
When SALAD-48 and SALAD-72 were tested,
both detected the anomaly; however, they also gen-
erated false positives. It is evident that setting b to 72
yields better results than setting b to 48. It is clear that
among all the tested approaches, RePAD3 stands out
for its superior detection accuracy, as it successfully
detected the anomaly without any false positives, re-
sulting in the highest F1-score of 1. In fact, as shown
in Figure 5, it proactively detected the anomaly one
hour before it occurred, enabling timely intervention
from human experts.
Regarding time consumption in anomaly detec-
tion, it is evident from Table 4 that when LSTM
model retraining was necessary, all approaches re-
quired more time to detect each data point compared
to when LSTM model retraining was not required.
Notably, the two SALAD variants took more time
to detect each data point compared to the other ap-
proaches. This is due to the more frequent model re-
training needed to adapt to pattern changes in BSMS,
especially in the first phase of SALAD, as indicated
by the LSTM retraining ratios of 0.109 and 0.132
shown in Table 4. Additionally, due to the utiliza-
tion of two parallel detectors, D1 and D2, ReRe re-
quired 0.595 seconds for DT-Train and 0.052 seconds
for DT-noTrain in average. These values are higher
than those of RePAD, RePAD2, and RePAD3.
It is evident that, despite the use of RePAD2 and
GV, there was only a slight increase in DT-Train and
DT-noTrain for RePAD3. This is due to 1) the ad-
vanced detection only occurred when a suspicious
data point was reported by RePAD2, and 2) GV was
invoked periodically at 24 time points instead of ev-
ery time point. This design ensures that RePAD3 not
only remains lightweight but only provides real-time
responses.
Based on the above results, we conclude that
RePAD3 excels in detection accuracy and maintains
high efficiency, despite a slight increase in detection
response time compared to RePAD and RePAD2. In
contrast, while RePAD, RePAD2, and ReRe are con-
sidered lightweight, they struggle to handle BSMS.
Furthermore, SALAD’s accuracy depends on the
proper setting of parameter b, and it is less time-
efficient than the other approaches.
5.2 Evaluation Results on P3
In the second experiment, we evaluated the five ap-
proaches on P3, where data point intervals are un-
known due to anonymization by the data owner. Fig-
ure 6 depicts the time series, with the true sequen-
tial anomaly marked in red. It can be easily observed
that there is a recurring pattern within P3, and the ap-
proximate length is 168 data points. Hence, we set K
to 168 for RePAD3, and we also used this informa-
tion to configure parameter b for SALAD. Here, we
set b to 336 (i.e., 168 · 2) and 504 (i.e., 168 · 3) to
evaluate SALAD’s performance under these two set-
tings. These two variants are denoted by SALAD-336
and SALAD-504. Similar to the first experiment, the
other approaches do not require such a setting.
Figure 6 depicts all data points identified as
anomalies by each approach tested, and Table 5 pro-
vides detailed performance results. All tested ap-
proaches successfully detected the anomaly within
P3, which is why they achieved a recall of 1, ex-
cept for SALAD. It is clear that RePAD2 performed
similarly to RePAD because its parameter W was set
to match the total length of P3. Both generated the
highest number of false positives (i.e., 12), leading
to a F1-score of 0.995. When ReRe was tested, it
produced slightly fewer false positives, leading to a
slightly higher F1-score of 0.996.
When SALAD-336 and SALAD-504 were tested,
their second phase malfunctioned. Consequently, we
could not evaluate their performance in this exper-
iment. This issue arose because all data points in
P3 were normalized using min/max normalization by
the data owner, which distributed non-anomalous data
RePAD3: Advanced Lightweight Adaptive Anomaly Detection for Univariate Time Series of Any Pattern
581

Figure 6: Anomalies detected within P3 by each approach, with a true sequential anomaly marked in red.
Table 5: Performance results of all compared approaches on P3.
Detection
accuracy
Online LSTM retraining ratio DT-Train (sec) DT-noTrain (sec)
P R F1 Avg. Std. Avg. Std.
RePAD 0.991 1 0.995 0.058(=493/8493) 0.265 0.056 0.012 0.003
RePAD2 0.991 1 0.995 0.058(=493/8493) 0.266 0.055 0.013 0.002
ReRe 0.992 1 0.996
D1:0.058(=493/8493)
D2:0.093(=791/8493)
0.439 0.188 0.061 0.018
SALAD-336 N/A N/A N/A N/A N/A N/A N/A N/A
SALAD-504 N/A N/A N/A N/A N/A N/A N/A N/A
RePAD3 0.995 1 0.997 0.054(=458/8493) 0.318 0.064 0.035 0.011
points between -0.3 and 0.1, as illustrated in Fig-
ure 6. These low values resulted in very small AARE
values in the first phase of SALAD, which subse-
quently caused the malfunction in the second phase
of SALAD.
RePAD3 achieved the highest F1-score of 0.997
among all tested approaches, as it not only success-
fully detected the anomaly but also generated only 8
false positives, fewer than other approaches. Further-
more, RePAD3 required the fewest LSTM model re-
trainings since it instructed RePAD2 to continue us-
ing the current model for future prediction when it
did not identify the current data point as anomalous
(see line 10 in Figure 2). However, we observed that
RePAD3 required slightly more DT-Train and DT-
noTrain compared to the first experiment (please com-
pare Table 5 with Table 4). This increase is due to the
larger number of data points for parameter K, which
was set at 168 in this experiment, compared to 24 in
the first experiment. Nevertheless, RePAD3 remains
highly efficient because it can detect each of the 458
data points within P3 in an average of 0.318 seconds,
and each of the remaining 8035 (= 8493−458) data
points in an average of 0.035 seconds.
5.3 Evaluation Results on CPU-B3B
In the third experiment, we attempted to analyze the
performance of all the five approaches on CPU-B3B,
which has the data point interval of 5 minutes. How-
ever, as depicted in Figure 7, CPU-B3B does not ex-
hibit any evident recurrent patterns. Therefore, we ex-
cluded SALAD from this experiment, due to inflexi-
bility in setting the parameter b for SALAD. Further-
more, since users of RePAD3 cannot easily observe
recurring patterns within CPU-B3B, we assume that
they wish to seek daily and weekly patterns within it.
Hence, the parameter K of RePAD3 was set to 288
(= 60/5 · 24) for the daily pattern scenario and 2016
(= 288 · 7) for the weekly pattern scenario. Both are
referred to as RePAD3-288 and RePAD3-2016.
Figure 7 marks the two true point anomalies as red
hollow circles, along with all data points detected as
anomalies by each tested approach. Furthermore, Ta-
ble 6 provides detailed performance results. When
RePAD3-288 and RePAD3-2016 were tested, they
successfully detected the two anomalies without pro-
ducing any false positives, resulting in the highest
F1-score of 1. It is important to note that GV was
never invoked by RePAD3-2016 because the length
of CPU-B3B (i.e., 4032) is shorter than the inspection
period of 4K (i.e., 4 · 2016). In other words, RePAD3-
2016 relied entirely on its advanced detection func-
tion to identify anomalies within CPU-B3B. Never-
theless, RePAD3-2016 achieved detection results that
are equally superior to those of RePAD3-288. On the
other hand, RePAD, RePAD2, and ReRe also success-
fully detected the two anomalies. However, they all
generated the same number of false positives, indicat-
ing that ReRe was unable to enhance RePAD’s per-
formance despite employing two parallel detectors.
Regarding time efficiency, we observed that both
RePAD3-288 and RePAD3-2016 required fewer on-
ICAART 2025 - 17th International Conference on Agents and Artificial Intelligence
582

Figure 7: Anomalies detected within CPU-B3B by each approach, with two true point anomalies marked as red hollow circles.
Table 6: Performance results of all compared approaches on CPU-B3B.
Detection
accuracy
Online LSTM retraining ratio DT-Train (sec) DT-noTrain (sec)
P R F1 Avg. Std. Avg. Std.
RePAD 0.789 1 0.882 0.010(=42/4032) 0.262 0.051 0.012 0.002
RePAD2 0.789 1 0.882 0.010(=42/4032) 0.261 0.053 0.012 0.002
ReRe 0.789 1 0.882
D1: 0.010(=42/4032)
D2: 0.020(=81/4032)
0.391 0.146 0.046 0.010
RePAD3-288 1 1 1 0.007(=28/4032) 0.296 0.059 0.026 0.006
RePAD3-2016 1 1 1 0.007(=28/4032) 0.301 0.063 0.030 0.007
line model retrainings than the other approaches due
to the implementation of the advanced detection (i.e.,
Equation 5), which decreased the need for model
retraining. Similar to the previous experiments,
RePAD3 exhibited a detection response time slightly
longer than RePAD2’s but shorter than ReRe’s. Based
on these results, we confirm that RePAD3 delivers su-
perior detection accuracy on CPU-B3B without sig-
nificantly increasing detection time.
5.4 Evaluation Results on P11
In the last experiment, we evaluated the performance
of all tested approaches on P11. Figure 8 depicts
the entire time series and marks the two true sequen-
tial anomalies in red. It is clear that there is no eas-
ily observed recurring pattern within this time series.
Therefore, SALAD was excluded from this experi-
ment due to the inflexibility of configuring its param-
eter b. Furthermore, P11 lacks data point intervals
because of the anonymization performed by the data
owner. Hence, we considered two possible intervals
for P11: one minute and one hour. We also assumed
that users of RePAD3 would seek daily and weekly
pattern within P11. This assumption led to the selec-
tion of four settings for parameter K: 24, represent-
ing the hourly interval and the desire to detect daily
patterns (i.e., 1·24); 168, representing the hourly in-
terval and the desire to detect weekly patterns (i.e.,
24·7); 1440, representing the minute interval and the
desire to detect daily patterns (i.e., 60·24); and 10080,
representing the minute interval and the desire to de-
tect daily patterns (i.e., 60·24·7). These four variants
are denoted by RePAD3-24, RePAD3-168, RePAD3-
1440, and RePAD3-10080.
Table 7 lists detailed performance results of all
tested approaches. When RePAD3-24 was tested, it
achieved a F1-score identical to RePAD and RePAD2.
This occurred because setting K to 24 enabled GV
to search for short recurring patterns within the last
4K period, which caused RePAD3 to misidentify pat-
terns and led to some false positives. When RePAD3-
168 was tested, the F1-score increased due to reduced
false positives. When RePAD3-1440 and RePAD3-
10080 were tested, they successfully detected the two
sequential anomalies without any false positives, re-
sulting in the highest F1-score of 1. Therefore, setting
a low value for K is not recommended when there is
no evident recurrent pattern in a time series. Further-
more, it is also important to note that GV was not in-
voked when RePAD3-1440 and RePAD3-10080 were
tested because the period of 4K was longer than the
length of P11. However, this did not impact RePAD3
at all, thanks to the excellent detection performed by
RePAD3’s advanced detection function. Additionally,
Table 7 shows that RePAD3 maintains high efficiency,
with no significant increase in both DT-Train and DT-
noTrain compared to other approaches.
6 CONCLUSIONS
In this paper, we have introduced RePAD3 for detect-
ing anomalies in univariate time series of any pattern
RePAD3: Advanced Lightweight Adaptive Anomaly Detection for Univariate Time Series of Any Pattern
583

Figure 8: Anomalies detected within P11 by each approach, with two true sequential anomalies marked in red.
Table 7: Performance results of all compared approaches on P11.
Detection
accuracy
Online LSTM retraining ratio DT-Train (sec) DT-noTrain (sec)
P R F1 Avg. Std. Avg. Std.
RePAD 0.912 1 0.954 0.026(=93/3535) 0.270 0.075 0.011 0.003
RePAD2 0.912 1 0.954 0.026(=93/3535) 0.272 0.077 0.012 0.003
ReRe 0.927 1 0.962
D1:0.026(=93/3535)
D2:0.066(=234/3535)
0.361 0.162 0.044 0.009
RePAD3-24 0.912 1 0.954 0.021(=75/3535) 0.276 0.080 0.025 0.006
RePAD3-168 0.991 1 0.995 0.021(=75/3535) 0.293 0.058 0.025 0.006
RePAD3-1440 1 1 1 0.021(=75/3535) 0.291 0.062 0.025 0.006
RePAD3-10080 1 1 1 0.021(=75/3535) 0.293 0.061 0.026 0.006
in real time, online, adaptive, and lightweight manner
by leveraging two state-of-the-art methods: RePAD2
and GrammarViz 3.0. As discussed that each method
has its own distinct strengths and limitations. By cap-
italizing on these strengths and addressing the limita-
tions using the proposed advanced detection function
and pattern inspection, RePAD3 demonstrates the ca-
pability to identify various types of anomalies in both
recurrent and non-recurrent time series in real time.
A series of experiments using real-world time se-
ries have been conducted to compare RePAD3 with
four state-of-the-art anomaly detection approaches
that do not require offline model training. The re-
sults indicate that RePAD3 outperforms all other ap-
proaches in detection accuracy by effectively detect-
ing anomalies and significantly reducing false pos-
itives, without noticeably increasing detection re-
sponse time.
In future work, we plan to extend RePAD3 by in-
tegrating it with RoLA (Lee and Lin, 2023b) for de-
tecting anomalies in multivariate time series. This ex-
tension will be deployed in various environments for
different purposes, such as cyber-physical systems for
detecting anomalies and intrusions.
ACKNOWLEDGEMENT
This work received funding from the Research Coun-
cil of Norway through the SFI Norwegian Centre for
Cybersecurity in Critical Sectors (NORCICS), project
no. 310105.
REFERENCES
Audibert, J., Michiardi, P., Guyard, F., Marti, S., and Zu-
luaga, M. A. (2020). Usad: Unsupervised anomaly
detection on multivariate time series. In Proceedings
of the 26th ACM SIGKDD international conference
on knowledge discovery & data mining, pages 3395–
3404.
Bl
´
azquez-Garc
´
ıa, A., Conde, A., Mori, U., and Lozano,
J. A. (2021). A review on outlier/anomaly detection
in time series data. ACM Computing Surveys (CSUR),
54(3):1–33.
Braei, M. and Wagner, S. (2020). Anomaly detection in
univariate time-series: A survey on the state-of-the-
art. arXiv preprint arXiv:2004.00433.
Breiman, L. (2001). Statistical modeling: The two cultures
(with comments and a rejoinder by the author). Sta-
tistical science, 16(3):199–231.
Chen, Z., Liu, J., Su, Y., Zhang, H., Ling, X., Yang,
Y., and Lyu, M. R. (2022). Adaptive performance
anomaly detection for online service systems via pat-
tern sketching. In Proceedings of the 44th Inter-
national Conference on Software Engineering, pages
61–72.
CityofMelbourne (2020). City of Melbourne - Pedestrian
Counting System. https://www.pedestrian.melbourne.
vic.gov.au. [Online; accessed 16-January-2025].
ICAART 2025 - 17th International Conference on Agents and Artificial Intelligence
584

Deeplearning4j (2023). Introduction to core deeplearning4j
concepts. https://deeplearning4j.konduit.ai/. [Online;
accessed 16-January-2025].
EarlyStopping (2023). What is early stopping? https:
//deeplearning4j.konduit.ai/. [Online; accessed 16-
January-2025].
Goh, J., Adepu, S., Tan, M., and Lee, Z. S. (2017). Anomaly
detection in cyber physical systems using recurrent
neural networks. In 2017 IEEE 18th International
Symposium on High Assurance Systems Engineering
(HASE), pages 140–145. IEEE.
Haque, S. A., Rahman, M., and Aziz, S. M. (2015). Sen-
sor anomaly detection in wireless sensor networks for
healthcare. Sensors, 15(4):8764–8786.
Hochenbaum, J., Vallis, O. S., and Kejariwal, A. (2017).
Automatic anomaly detection in the cloud via statisti-
cal learning. arXiv preprint arXiv:1704.07706.
Hundman, K., Constantinou, V., Laporte, C., Colwell,
I., and Soderstrom, T. (2018). Detecting space-
craft anomalies using LSTMs and nonparametric dy-
namic thresholding. In Proceedings of the 24th ACM
SIGKDD international conference on knowledge dis-
covery & data mining, pages 387–395.
Keogh, E., Chakrabarti, K., Pazzani, M., and Mehrotra, S.
(2001). Locally adaptive dimensionality reduction for
indexing large time series databases. In Proceedings
of the 2001 ACM SIGMOD international conference
on Management of data, pages 151–162.
Lavin, A. and Ahmad, S. (2015). Evaluating real-time
anomaly detection algorithms–the numenta anomaly
benchmark. In 2015 IEEE 14th international confer-
ence on machine learning and applications (ICMLA),
pages 38–44. IEEE.
Lee, M.-C. and Lin, J.-C. (2023a). RePAD2: Real-
time lightweight adaptive anomaly detection for open-
ended time series. In Proceedings of the 8th Interna-
tional Conference on Internet of Things, Big Data and
Security - IoTBDS, pages 208–217. INSTICC.
Lee, M.-C. and Lin, J.-C. (2023b). RoLA: A real-time on-
line lightweight anomaly detection system for multi-
variate time series. In Proceedings of the 18th Inter-
national Conference on Software Technologies - IC-
SOFT, pages 313–322. INSTICC.
Lee, M.-C., Lin, J.-C., and Gan, E. G. (2020a). ReRe: A
lightweight real-time ready-to-go anomaly detection
approach for time series. In 2020 IEEE 44th Annual
Computers, Software, and Applications Conference
(COMPSAC), pages 322–327. IEEE. arXiv preprint
arXiv:2004.02319. The updated version of the ReRe
algorithm from arXiv was used in this RePAD3 paper.
Lee, M.-C., Lin, J.-C., and Gran, E. G. (2020b). RePAD:
real-time proactive anomaly detection for time series.
In Advanced Information Networking and Applica-
tions: Proceedings of the 34th International Confer-
ence on Advanced Information Networking and Ap-
plications (AINA-2020), pages 1291–1302. Springer.
arXiv preprint arXiv:2001.08922.
Lee, M.-C., Lin, J.-C., and Gran, E. G. (2021a). How far
should we look back to achieve effective real-time
time-series anomaly detection? In Advanced Infor-
mation Networking and Applications: Proceedings of
the 35th International Conference on Advanced In-
formation Networking and Applications (AINA-2021),
Volume 1, pages 136–148. Springer. arXiv preprint
arXiv:2102.06560.
Lee, M.-C., Lin, J.-C., and Gran, E. G. (2021b). SALAD:
Self-adaptive lightweight anomaly detection for real-
time recurrent time series. In 2021 IEEE 45th Annual
Computers, Software, and Applications Conference
(COMPSAC), pages 344–349. IEEE. arXiv preprint
arXiv:2104.09968.
LinkedIn (2018). linkedin/luminol [online code reposi-
tory]. https://github.com/linkedin/luminol. [Online;
accessed 16-January-2025].
Liu, F. T., Ting, K. M., and Zhou, Z.-H. (2008). Isolation
forest. In 2008 eighth IEEE international conference
on data mining, pages 413–422. IEEE.
Ma, X., Almutairi, L., Alwakeel, A. M., and Alhameed,
M. H. (2023). Cyber physical system for distributed
network using dos based hierarchical bayesian net-
work. Journal of Grid Computing, 21(2):27.
Nevill-Manning, C. G. and Witten, I. H. (1997). Identify-
ing hierarchical structure in sequences: A linear-time
algorithm. Journal of Artificial Intelligence Research,
7:67–82.
Ren, H., Xu, B., Wang, Y., Yi, C., Huang, C., Kou, X., Xing,
T., Yang, M., Tong, J., and Zhang, Q. (2019). Time-
series anomaly detection service at microsoft. In Pro-
ceedings of the 25th ACM SIGKDD international con-
ference on knowledge discovery & data mining, pages
3009–3017.
Schneider, J., Wenig, P., and Papenbrock, T. (2021). Dis-
tributed detection of sequential anomalies in univari-
ate time series. The VLDB Journal, 30(4):579–602.
Senin, P. (2023). GrammarViz 3.0. https://grammarviz2.
github.io/grammarviz2
site/. [Online; accessed 16-
January-2025].
Senin, P., Lin, J., Wang, X., Oates, T., Gandhi, S., Boedi-
hardjo, A. P., Chen, C., and Frankenstein, S. (2018).
GrammarViz 3.0: Interactive discovery of variable-
length time series patterns. ACM Transactions on
Knowledge Discovery from Data (TKDD), 12(1):1–
28.
Siffer, A., Fouque, P.-A., Termier, A., and Largouet, C.
(2017). Anomaly detection in streams with ex-
treme value theory. In Proceedings of the 23rd
ACM SIGKDD International Conference on Knowl-
edge Discovery and Data Mining, pages 1067–1075.
Wang, X., Yao, Z., and Papaefthymiou, M. (2023). A
real-time electrical load forecasting and unsuper-
vised anomaly detection framework. Applied Energy,
330:120279.
Wu, W., He, L., Lin, W., Su, Y., Cui, Y., Maple, C., and
Jarvis, S. (2020). Developing an unsupervised real-
time anomaly detection scheme for time series with
multi-seasonality. IEEE Transactions on Knowledge
and Data Engineering, 34(9):4147–4160.
Yang, Z., Soltani, I., and Darve, E. (2023). Anomaly de-
tection with domain adaptation. In Proceedings of the
IEEE/CVF Conference on Computer Vision and Pat-
tern Recognition, pages 2957–2966.
RePAD3: Advanced Lightweight Adaptive Anomaly Detection for Univariate Time Series of Any Pattern
585
