
Real-Time Manufacturing Data Quality: Leveraging Data Profiling and
Quality Metrics
Teresa Peixoto
1 a
, Bruno Oliveira
1 b
,
´
Oscar Oliveira
1 c
and Fillipe Ribeiro
2 d
1
CIICESI, School of Management and Technology, Porto Polytechnic, Portugal
2
JPM Industry, Portugal
fi
Keywords:
Data Quality, Data Profiling, Real-Time Data Analysis, Smart Manufacturing Environments, Industry 4.0.
Abstract:
Ensuring data quality in decision-making is essential, as it directly impacts the reliability of insights and
business decisions based on data. Data quality measuring can be resource-intensive, and it is challenging to
balance high data quality and operational costs. Data profiling is a fundamental step in ensuring data quality,
as it involves thoroughly analyzing data to understand its structure, content, and quality. Data profiling enables
teams to assess the state of their data at an early stage, uncovering patterns, anomalies, and inconsistencies
that might otherwise go unnoticed. In this paper, we analyze data quality metrics within Industry 4.0 envi-
ronments, emphasizing various critical aspects of data quality, including accuracy, completeness, consistency,
and timeliness, and showing how typical data profiling outputs can be leveraged to monitor and improve data
quality. Through a case study, we validate the feasibility of our approach and highlight its potential to improve
data-driven decision-making processes in smart manufacturing environments.
1 INTRODUCTION
In modern data-driven business systems, maintaining
high data quality is essential for ensuring the relia-
bility of decision-making processes (Rangineni et al.,
2023). The increasing adoption of the Internet of
Things (IoT) and Cyber-Physical Systems (CPS) in
the industry has significantly escalated the volume
of data generated (Goknil et al., 2023), revelling the
need for advanced techniques for analyzing and un-
derstanding its characteristics (Tverdal et al., 2024).
Much of this data is streamed in real-time, resulting in
substantial volumes of (time series) data organized by
timestamps (Hu et al., 2023), which require constant
supervision. Ensuring data quality is vital for opti-
mizing processes, enabling predictive maintenance,
and supporting data-driven decisions, ultimately en-
hancing the efficiency and reliability of automated
systems while minimizing error rates (Goknil et al.,
2023). However, maintaining data quality within the
context of Industry 4.0 presents challenges, including
managing multiple data sources, varying formats and
a
https://orcid.org/0009-0002-6136-8602
b
https://orcid.org/0000-0001-9138-9143
c
https://orcid.org/0000-0003-3807-7292
d
https://orcid.org/0000-0002-8851-9688
standards, real-time validation, and integrating legacy
systems with emerging technologies.
Through data profiling (Abedjan et al., 2018), en-
gineers and analysts gain detailed visibility into var-
ious data attributes, such as distributions, data types,
and relationships across tables or databases. This in-
sight helps in establishing baseline quality metrics,
enabling teams to set realistic and meaningful qual-
ity standards. For instance, if profiling reveals that a
particular dataset has a high percentage of null val-
ues in key fields, it signals that corrective actions
are necessary, like data cleaning or enrichment, be-
fore the data is used in downstream applications.
Once the data characteristics are known, engineers
can automate quality monitoring processes that con-
tinuously check data against predefined thresholds
(Tverdal et al., 2024). For example, if certain data
fields should never be empty, data profiling enables
the creation of validation rules to enforce this require-
ment. As data flows through pipelines, these checks
help maintain quality by identifying any deviations
from expected standards. Overall, data profiling is
more than a preliminary step; it is an ongoing prac-
tice in data engineering that sustains data quality over
time.
This paper presents a data quality evaluation ap-
proach tailored to the unique characteristics of IoT
56
Peixoto, T., Oliveira, B., Oliveira, Ó. and Ribeiro, F.
Real-Time Manufacturing Data Quality: Leveraging Data Profiling and Quality Metrics.
DOI: 10.5220/0013242900003944
In Proceedings of the 10th International Conference on Internet of Things, Big Data and Security (IoTBDS 2025), pages 56-68
ISBN: 978-989-758-750-4; ISSN: 2184-4976
Copyright © 2025 by Paper published under CC license (CC BY-NC-ND 4.0)

and Industry 4.0 data, applied within a specific case
study. It investigates key dimensions and metrics of
data quality, leveraging data profiling outputs to ac-
tively enhance the evaluation process. By integrat-
ing profiling results, this approach enables continu-
ous, real-time assessment of manufacturing data, re-
ducing the need for human intervention and support-
ing automated, high-frequency quality monitoring in
industrial environments.
The rest of this article is structured as follows.
Section 2 reviews related work. Section 3 describes
the case study. Section 4 presents the results and dis-
cusses the main findings. Finally, Section 5 concludes
the article.
2 RELATED WORK
With the advances in industrial technology, the in-
creasing number of sensors deployed for monitoring
manufacturing processes leads to the constant gener-
ation of large volumes of time series data (Schultheis
et al., 2024). The growing volume and complexity
of time series data present significant challenges for
data analysis (Hu et al., 2023). Analyzing this data
can uncover underlying patterns, reveal correlations
and periodicity between events, and provide a deeper
understanding of the nature and mechanisms of these
events. Through the analysis of time trends, valuable
information can be extracted, such as anomaly de-
tection, classification, and clustering (Bandara et al.,
2020). Missing data, outliers or duplicated records are
some examples of problems typically found in time-
series data (Tverdal et al., 2024).
The quality and continuity of data present signifi-
cant bottlenecks in Industry 4.0 data. Various factors
can lead to a decline in data quality. For instance, sys-
tems can face sensor malfunctions and failures, result-
ing in corrupted sensor measurements. These issues
can vary from electromagnetic interference, packet
loss, and signal processing faults (Goknil et al., 2023).
Poor data quality affects trust and reliance on these In-
dustry 4.0 systems. Data Monitoring, Data Cleaning
and Data Repair are three types of data quality identi-
fied in (Goknil et al., 2023).
The definition of data quality is intricate and
context-dependent. It can be described as the
degree to which data characteristics meet explicit
and implicit requirements in specific circumstances
(ISO/IEC 25012:2008, 2008). Notably, data quality
cannot be easily distilled into a single metric or defi-
nition. Instead, it is a multifaceted concept that must
be carefully evaluated against the particular needs and
objectives of data users.
Data Quality Dimensions (DQD) (Loshin, 2011)
are characteristics or attributes used to assess the qual-
ity of data. These dimensions are crucial for under-
standing and measuring the fitness of data for its in-
tended use. By establishing clear criteria for evalu-
ation, these dimensions ensure that data aligns with
established needs and expectations. Identifying these
relevant dimensions forms the basis for effectively
assessing data quality and initiating continuous im-
provement activities (Cichy and Rass, 2019).
Batini (Batini and Scannapieco, 2016) proposed
several DQD, such as Accuracy, Completeness and
Consistency, and organised them into groups based
on their similarity, with each group addressing spe-
cific problem categories, strategies and metrics for
evaluating data quality. In the Accuracy group, Ba-
tini distinguishes between Structural Accuracy and
Temporal Accuracy. Structural Accuracy refers to
the correctness of data within a stable time frame,
while Temporal Accuracy measures how quickly up-
dates in data values reflect real-world changes. In
addition, the author identifies Timeliness as one of
the principal temporal accuracy dimensions, repre-
senting how up-to-date the data are for the specific
task. Completeness measures the extent to which
all required data is present and accounted for, ensur-
ing that the dataset includes all necessary informa-
tion without omissions or gaps, while Consistency
can be defined as the ability of information to present
a uniform and synchronized representation of real-
ity, as established by integrity constraints, business
rules, and other formalities. This dimension identi-
fies violations of semantic rules defined on a data set.
Consequently, data values must be uniform and syn-
chronized in all instances and applications. Other au-
thors have proposed classifications for DQDs, such
as (Loshin, 2011; Mahanti, 2019; Zhang et al., 2021).
The latter presents a comprehensive evaluation frame-
work for sensor measurements in the context of IoT.
The authors in (Goknil et al., 2023) present a com-
prehensive overview of metrics for IoT, categorized
into 17 Data Quality Dimensions (DQDs). Note-
worthy, is that among these, the study by Liu et al.
(Liu et al., 2021) identifies the dimensions of Accu-
racy, Completeness, Consistency and Timeliness as
the most relevant to the main data problems in smart
manufacturing scenarios.
For Accuracy, i.e., degree of precision in which
the stored data reflects reality, (Goknil et al., 2023)
presents 5 metrics found in the literature. For in-
stance, the metric identified by M4 and used in (Sicari
et al., 2016), is an accuracy metric that varies between
0 and 1 and indicates how close a value is to the cor-
rect values. This metric is calculated using the fol-
Real-Time Manufacturing Data Quality: Leveraging Data Profiling and Quality Metrics
57

lowing mathematical expression:
Accuracy =
x − min(X)
max(X) − min(X)
(1)
, where x is the value to be analyzed and X is the
data set. This normalized accuracy score is useful for
understanding the relative position of a value about
the entire range of data. If Accuracy is close to 0,
it means that x is close to the minimum value ob-
served in X, while Accuracy close to 1 means that x
is close to the maximum value observed in X. When
Accuracy is less than 0 or greater than 1, it indicates
that the x score is outside the range of values observed
in X, suggesting the presence of outliers or errors in
the data.
For Completeness, which refers to the expecta-
tion that certain attributes should have assigned val-
ues in the data under evaluation, many authors iden-
tify and propose various metrics to measure this di-
mension. Although the terminology may differ, the
metrics themselves are fundamentally similar. For in-
stance, (Goknil et al., 2023) presents six metrics, in-
cluding the metric identified as M13, which is also
used by (Byabazaire et al., 2020). Similarly, (Ma-
hanti, 2019) proposes metrics based on the same con-
cept. Despite minor variations, the underlying prin-
ciples of these quantitative metrics for completeness
remain consistent. The metric for the Completeness
dimension is expressed as follows:
Completeness =
N
total
− N
miss
N
total
(2)
where, N
miss
is the sum of missing values (such as
nulls, blank values or others) and N
total
is the total
number of data that should have been filled in. This
metric can be applied at both the record and attribute
levels, allowing completeness gaps to be identified at
different layers. In this way, it is possible to detect
a variety of underlying causes for data completeness
problems.
For Consistency, (Goknil et al., 2023) does not
offer a predefined metric for consistency, since its
evaluation is based on contextual rules. However,
(Mahanti, 2019) measures consistency by the ratio of
the number of rules that are found in the data (N
rule
) to
the number of previously established rules that should
exist (N
total
). Presenting the following metric:
Consistency =
N
rule
N
total
(3)
This metric should be applied to individual
records as well as to cross-records of different data
sets. For example, on a plastic extrusion machine,
if the screw rotation sensor is showing high values,
it would be expected that the barrel temperature sen-
sors would also be showing high values, as the fric-
tion generated by high rotation tends to heat the ma-
terial. This type of analysis is essential to identify
inconsistencies that could indicate faults in the mon-
itoring system or problems with the machine. In ad-
dition, when receiving data associated with a specific
machine, such as a unique identifier generated by the
sensors, it is essential that this machine is correctly
identified in a separate set of data that lists all of the
company’s machines.
For Timeliness, which refers to the degree of
timeliness of data for a specific task, one of the met-
rics presented by (Goknil et al., 2023), identified as
M28, was used in (Sicari et al., 2016). This metric is
defined based on data Age and Volatility, where Age
represents the time elapsed since the creation of the
data, while Volatility characterizes the period during
which this data remains valid. Thus, Timeliness is
calculated as follows:
Timeliness = max
0, 1 −
Age
Volatility
(4)
In this metric, the Timeliness value varies between
0 and 1, where 0 indicates that the data is outside the
ideal period of analysis, while 1 means that the data is
entirely within the ideal range for decision-making.
Data profiling presents itself as a critical and rou-
tine task for IT professionals and researchers, involv-
ing a wide range of techniques to analyze datasets
and generate metadata. This process can yield sim-
ple statistics and the most common patterns within
data values. More complex metadata, such as inclu-
sion and functional dependencies, require examina-
tion across multiple columns (Naumann, 2014).
Data profiling faces three primary challenges:
ingestion, computation, and output interpretation
(Abedjan et al., 2018). Ingestion involves efficiently
loading and preparing data from diverse sources. The
metadata discovered through profiling can be applied
to improve data quality by translating patterns and
dependencies into constraints or rules for validation,
cleansing, and integration. (Oliveira and Oliveira,
2022) introduced a data pipeline to ensure a cer-
tain level of data ”normality”. This framework de-
rives system behaviours, such as load management
and quarantine, based on a straightforward reliabil-
ity score. It relies on services that utilize a message
and communication broker. The reliability score can
be enhanced through a plugin architecture and sim-
ple configuration, enabling the development of spe-
cialized systems. This approach offers flexibility and
adaptability, making it easier to maintain data quality
and system reliability.
IoTBDS 2025 - 10th International Conference on Internet of Things, Big Data and Security
58

Computational complexity is also a significant
factor, as profiling algorithms must handle the number
of rows and columns in a dataset. Tasks often involve
inspecting various column combinations, which can
lead to exponential complexity, particularly in smart
manufacturing domains (Tverdal et al., 2024).
The use of data profiling outputs for data qual-
ity assessment was explored in (Kusumasari and Fi-
tria, 2016), in which OpenRefine was used to per-
form multiple analysis techniques on different data
elements. The data profiling with openRefine
1
can
detect data quality issues and provide suggestions to
improve data quality. This process is particularly im-
portant in research information systems, where data
quality directly impacts the success of Business Intel-
ligence applications (Azeroual et al., 2018). (Tverdal
et al., 2024) proposed EDPRaaS (Edge-based Data
Profiling and Repair as a Service), an approach de-
signed for efficient data quality profiling and repair in
IoT environments. It uses data profiling to comple-
ment data quality assessment. The repair component
leverages Great Expectations
2
outputs for data correc-
tion tasks, while Pandas
3
profiling provides end-users
with reports on identified data quality issues.
In (Heine et al., 2019), the authors present a pro-
filing component designed to streamline data quality
management by automatically generating rule sugges-
tions and parameters based on existing data. The pro-
filing component analyzes data to propose rule candi-
dates, allowing users to review and activate the most
suitable rules with the aid of their business knowl-
edge.
This highlights the importance of treating data
profiling as a primary tool in data analysis environ-
ments, using metadata generated by profiling mecha-
nisms as an active asset for data quality assessment
and monitoring. Profiling outputs should be lever-
aged to drive data quality processes, enabling a more
proactive approach to data quality management and
allowing for quicker responses to shifts in data char-
acteristics. This is particularly valuable in smart man-
ufacturing scenarios, where data streams from numer-
ous sensors require agile, real-time quality control
(Agolla, 2021).
(Abedjan et al., 2018) define a set of tasks for
data profiling that ranges from simple analysis of
individual columns to identifying dependencies be-
tween multiple columns. For analyzing individual
columns, the authors divide the analysis into three
main categories: Cardinalities, Value Distributions
and Data Types, Patterns and Domains. The Cardi-
1
https://openrefine.org/
2
https://greatexpectations.io/
3
https://pandas.pydata.org/
nalities category provides simple summaries of the
data by means of counts, among the main tasks are
the number of rows in a table, the number or percent-
age of null values, the count of distinct values in a
column and uniqueness, which is the ratio between
the number of distinct values and the total number of
rows. The Value Distributions category summarises
the distribution of values per column, in this category
are the different types of frequency histograms (Equi-
width histograms, Equi-depth histograms, etc.), the
extremes of a numerical column (minimums and max-
imums), the constancy of a column, which is the ratio
between the frequency of the most common value and
the total number of rows, the quartiles and, finally,
the first digit task, which is the distribution of the first
digits of a set of numerical values. For the last cat-
egory of analysing individual columns, Data Types,
Patterns and Domains, which brings together eight
tasks: determining basic data types such as numeric,
alphabetic, alphanumeric, dates or times, identifying
more specific data types such as booleans, integers,
timestamps, among others. Other tasks in this cat-
egory are the minimum, maximum, median and av-
erage lengths of values in a column, the maximum
length of digits in numerical values, the maximum
number of decimal places in numerical values, his-
tograms of patterns of values, identification of class
data (generic semantic data types) and identification
of semantic domains.
In addition to analysing individual columns,
(Abedjan et al., 2018) also highlight the dependen-
cies between columns, which describe the relation-
ships between them and are essential for data in-
tegrity. Functional dependencies, Single column
combinations and Inclusion dependencies are some
of the main types. These dependencies help to iden-
tify primary keys and foreign keys, guaranteeing con-
sistency and facilitating data cleansing by identifying
dependency patterns which, when violated, indicate
possible quality problems.
3 CASE STUDY
Data profiling and data quality assessment are inter-
connected, with profiling as a foundational step that
supports quality monitoring and management. By
systematically analyzing the structure, distribution,
and relationships within datasets, data profiling gen-
erates detailed metadata that reveals potential issues.
By using profiling outputs to shape quality rules, or-
ganizations can maintain high data quality standards
dynamically, reducing the risk of data degradation
over time and supporting more accurate, reliable ana-
Real-Time Manufacturing Data Quality: Leveraging Data Profiling and Quality Metrics
59

lytics (Heine et al., 2019). The case study presented
in this paper demonstrates how this approach can be
effectively implemented to manage data quality in a
dynamic manufacturing setting.
The case study describes plastic extrusion in a
manufacturing environment scenario. Extrusion is
a core process in the manufacture of plastic prod-
ucts used in the production of various items, includ-
ing pipes, coatings, wire and cable insulation, and
monofilaments. In this scenario, the focus is on the
single-screw extrusion process, which converts raw
material in the form of plastic granules into a viscous
molten fluid, resulting in a finished solid or flexible
product. Single-screw extrusion is a process that in-
volves a rotating screw with helical blades, which is
positioned inside a heated barrel. The extruder is fed
from a hopper mounted on top, with the plastic mate-
rial transported through the barrel by a rotating screw.
This screw moves the material along the barrel, where
it is heated and compressed. The molten plastic mate-
rial is then forced through a hole, known as a matrix,
which moulds it into the desired shape (Khan et al.,
2014).
To ensure the smooth operation of this process, the
machine has several sensors monitoring key parame-
ters such as temperature, pressure, and speed. As de-
tailed in the (Groover, 2010), the screw has multiple
functions and is divided into sections that align with
these functions. The sections and functions are as fol-
lows:
1. Feed Section: Responsible for moving the mate-
rial from the hopper door and preheating it.
2. Compression Section: Transforms the material
into a liquid consistency, extracts air trapped be-
tween the pellets, and compresses the molten
mass.
3. Metering Section: Homogenizes the molten
mass and develops sufficient pressure to pump the
material through the die opening.
Several sensors capture data throughout the flow
to analyze and optimize the process, reduce waste,
and minimize defects. The machines are equipped
with four temperature sensors (one for each screw
section and one for the ambient temperature), two
pressure sensors (one in the barrel and one for the am-
bient pressure), and a speed sensor in the screw.
Temperature sensors serve vital and distinct func-
tions in each section of the extruder. The tempera-
ture sensor in the feeding section (temp1) monitors
the initial temperature of the plastic granules as they
are transported from the hopper to the barrel. This
ensures that the material is being preheated correctly
to facilitate subsequent melting and avoid thermal
shocks that could affect the quality of the product.
In the compression section, the temperature sensor
(temp2) measures the temperature during the melting
and compression of the plastic material. This allows
the liquid consistency of the plastic and the extraction
of trapped air to be controlled, ensuring that the mate-
rial reaches the ideal viscosity for extrusion and pre-
venting defects caused by air bubbles. In the meter-
ing section, the temperature sensor (temp3) monitors
the final temperature of the melt before it is forced
through the die. This ensures that the melt is at the
correct temperature to be moulded, preventing varia-
tions in the quality of the finished product. The am-
bient temperature sensor (ambient
temp
) measures the
temperature of the working environment by adjusting
the extruder’s operating parameters based on the am-
bient conditions. This is because the ambient temper-
ature can influence the efficiency of heat transfer and
the behaviour of the plastic material.
It is also important to note the crucial role that
pressure sensors play. The pressure sensor in the bar-
rel monitors the internal pressure during the extrusion
process, controlling it to ensure efficient melting of
the material and to prevent problems such as over-
pressure, which can result in equipment damage or
cause the final product to fail. The ambient pressure
(ambient
pressure
) sensor measures atmospheric pres-
sure in the working environment, allowing adjust-
ments to be made to the process to maintain consis-
tency in production. This is essential because ambi-
ent pressure conditions can affect the operation of the
equipment and the behavior of the plastic material.
The screw speed sensor (rotation) monitors the
rotation speed of the extruder screw, controlling the
feed rate and the flow of material through the barrel.
The speed of the screw directly influences the homo-
geneity of the melt and the quality of the end prod-
uct. It is therefore crucial to keep the speed within
the ideal parameters to guarantee the efficiency of the
process and the integrity of the product.
The sensors transmit data continuously every sec-
ond. Considering the study environment, the tempera-
ture in the first section of the screw is expected to vary
between 130 and 150 ºC, in the second section be-
tween 150 and 180 ºC and in the third section between
180 and 220 ºC. The pressure in the barrel varies be-
tween 70 and 350 bar, while the rotational speed of
the screw varies between 20 and 60 rpm. The am-
bient temperature varies between 18 and 30 ºC, and
the ambient pressure varies between 1005 and 1025
hPa. The details of the dataset fields are summarized
in Table 1.
A sample of data generated, covering 3 working
days, was considered to demonstrate the approach.
IoTBDS 2025 - 10th International Conference on Internet of Things, Big Data and Security
60

Table 1: Dataset Details.
Field Type Description
machine id string Machine id
timestamp timestamp Specific time of registration
ambient temp float Ambient temperature (ºC)
ambient pressure float Ambient pressure (hPa)
rotation float Screw rotation speed (RPM)
temp1 float Temperature in the first section of the screw (ºC)
temp2 float Temperature in the second section of the screw (ºC)
temp3 float Temperature in the third section of the screw (ºC)
pressure float Pressure in the barrel (Bar)
The dataset consists of 203273 records, with data
collected from multiple sensors. Of these, 139209
records from the first two days are used for histori-
cal analysis, while the remaining 64065 records from
the last day are used for real-time analysis. The pres-
ence of null values in a specific sensor may indicate a
malfunction, which is crucial for quickly identifying
and solving technical problems that could affect pro-
duction. Additionally, the presence of outliers may be
caused by sensor malfunctions, resulting in substan-
tially non-standard records. Such anomalies often in-
dicate that the process deviates from ideal conditions,
which could affect the quality of the final product.
Figure 1 represents this sample, showing the values
recorded by each sensor over the 3 days and provid-
ing an overview of the dataset. This visualization fa-
cilitates the identification of null and anomalous val-
ues, critical aspects for data quality analysis. Identi-
fying and correcting these discrepancies immediately
is essential to maintaining operational efficiency and
avoiding large-scale production failures. This sam-
ple was chosen precisely because it contains the most
common data quality problems, representing a realis-
tic scenario for evaluating and dealing with inconsis-
tencies.
In industrial data processing, having a clear archi-
tecture is essential for capturing, processing, and stor-
ing information from various sources. Our architec-
ture leverages Apache Kafka
4
as a message broker to
ensure smooth, reliable, and efficient communication
between sources and the data ingestion service. Each
industrial device acts as a distinct source, sending
data such as pressure and temperature through Kafka.
Messages are organized by specific topics (e.g., ma-
chine type) to maintain a coherent data flow.
At the core of this system is the ingestion service,
which consumes messages from Kafka. It uses a con-
figuration file to dynamically determine the topics and
tasks to execute on each message. To evaluate data
quality metrics, we configured only two tasks for this
4
https://kafka.apache.org/
study as represented in Figure 2: Raw Task for storing
data in its raw format and Data Quality for conducting
a data quality assessment. This assessment calculates
the metrics and stores them for analysis. Tools like
Grafana
5
can be used to visualize and analyze both
real-time and historical data, providing valuable in-
sights into system performance.
To evaluate data quality, the records were orga-
nized into 5-minute blocks, allowing for continuous
and incremental analysis over time. Each block goes
through specific processing steps before the quality
metrics are calculated. For instance, null values are
identified and treated, as they may indicate sensor
failures or data transmission interruptions. Dynamic
statistics, such as minimum and maximum values ad-
justed by percentiles, are calculated based on the data
available up to the previous block. The results are
stored and made available for viewing, ensuring that
both the processed data and the derived metrics can
be analyzed in real-time. Although some examples
of pre-processing have already been presented, all the
steps required to calculate each quality metric will be
detailed later.
4 DATA QUALITY ANALYSIS
To ensure data quality in a manufacturing environ-
ment, it is essential to implement metrics that fa-
cilitate effective assessment. These metrics monitor
data and support informed decision-making, enhanc-
ing operational performance. In this case study, data
quality metrics are applied every 5 minutes, incorpo-
rating previous data and profile results derived from
functions using the Pandas library. While some met-
rics were used as presented in Section 2, others were
adapted to better align with the specific context of the
study.
To analyze the Accuracy dimension, Metric 1 was
5
https://grafana.com/
Real-Time Manufacturing Data Quality: Leveraging Data Profiling and Quality Metrics
61
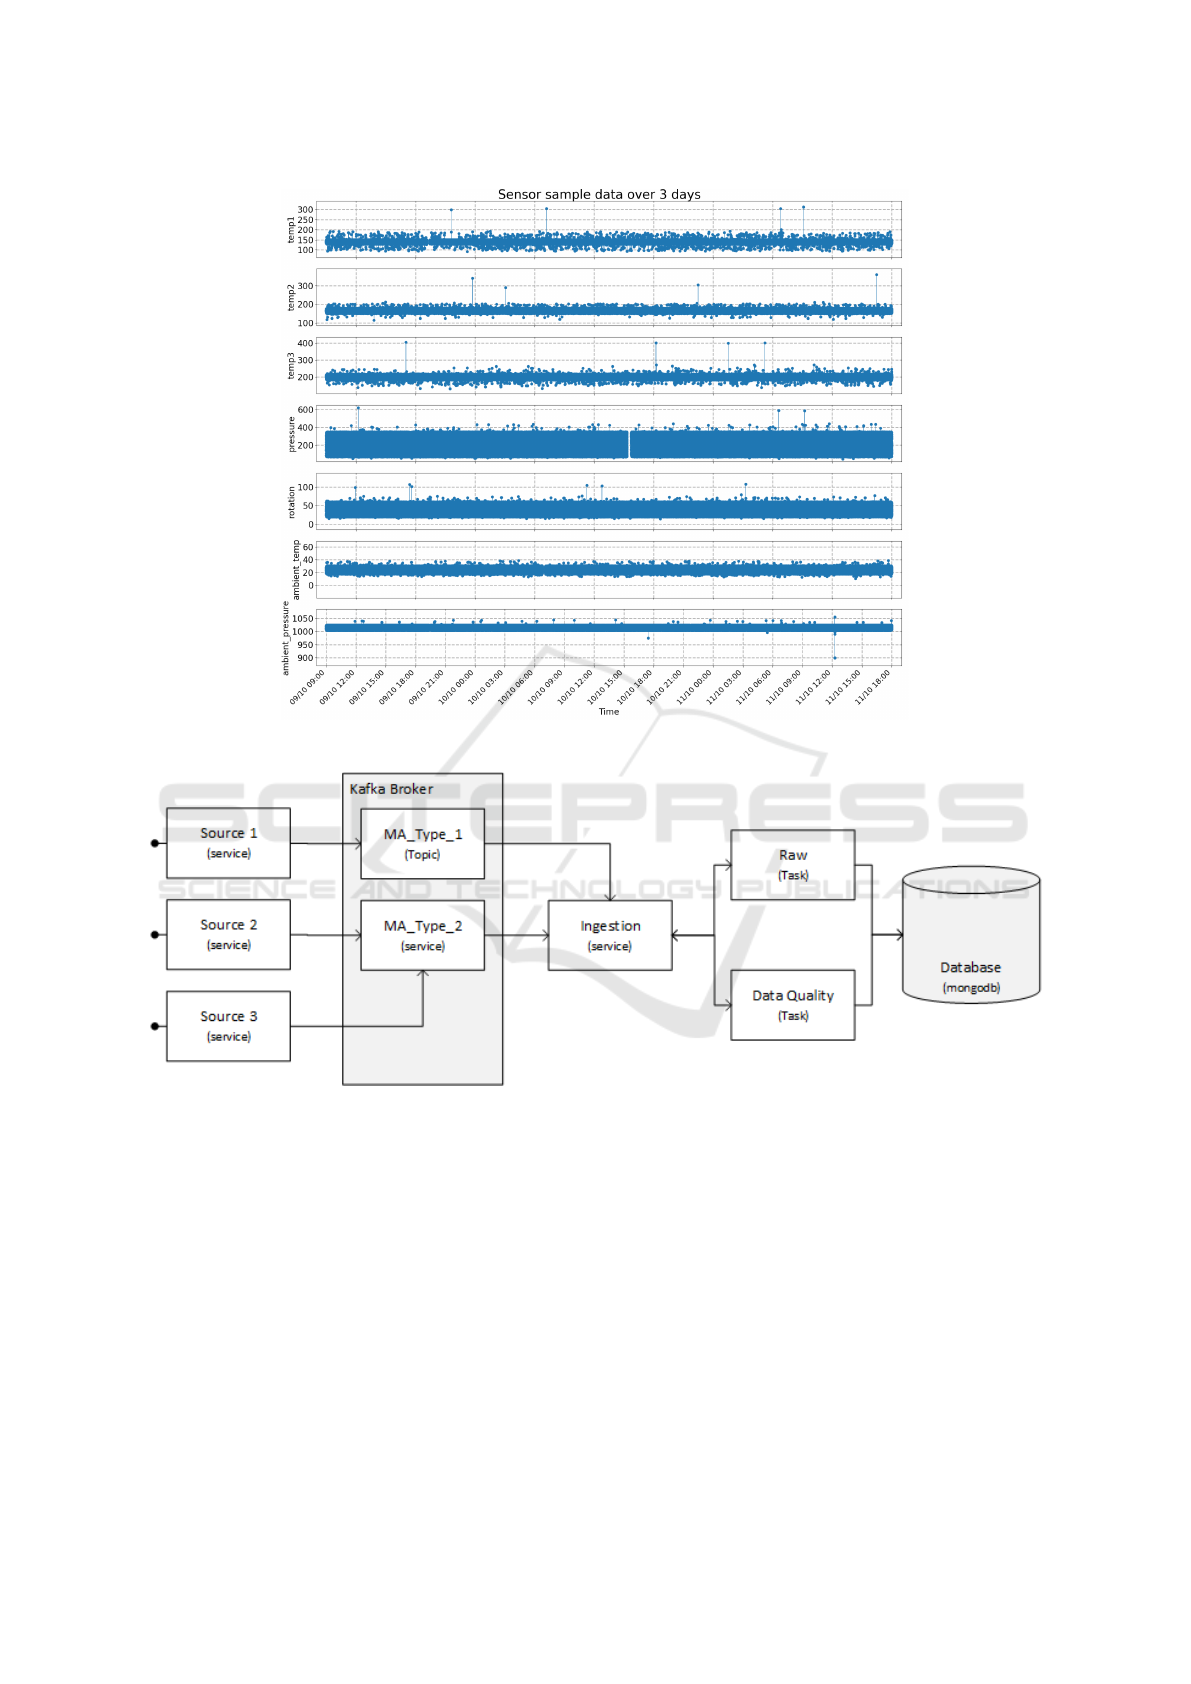
Figure 1: Variation of each sensor over time.
Figure 2: Data Stream Pipeline.
applied, as defined in eq. 1. In each numerical col-
umn, for blocks of 5 minutes, the average normal-
ized accuracy of the sensor data is calculated. The
10th and 90th percentiles of all data up to the time
of the block are used as dynamic limits, which al-
lows the calculation to adapt to the sensor’s behaviour
over time. The choice of percentiles, rather than the
actual minimum and maximum values, prevent out-
liers previously identified in Figure 1 from influenc-
ing accuracy inappropriately. Figure 3 illustrates the
variation of the actual minimum and maximum values
measured in each 5-minute block, along with the dy-
namic limits based on the percentiles. It can be seen
that the actual values (dashed in red for the maximum
and green for the minimum) show more pronounced
fluctuations, which could distort accuracy if they were
used directly. The percentiles, on the other hand, of-
fer a more stable and adaptable range, justifying their
choice for a robust analysis that is less susceptible to
extreme deviations (orange line for the maximum and
blue for the minimum). For this calculation, profiling
tasks were used, such as identifying null values, ex-
tremes, and data types in each column. These tasks
correspond to the profiling categories defined by the:
Cardinality, Value Distributions and Data Types, Pat-
terns and Domains, respectively.
IoTBDS 2025 - 10th International Conference on Internet of Things, Big Data and Security
62

Figure 3: Minimum and Maximum Variation.
The results of the Accuracy Metric 1 for the above
sample data are shown in Figure 4. This figure shows
the accuracy values of all the sensors, where it is pos-
sible to identify 4 to 5 situations on day 11 of Octo-
ber where the accuracy is close to the limits of the
[0, 1] interval. As the data from each column are
grouped into 5-minute blocks (with around 300 val-
ues per block) and the average accuracy of each block
is calculated dynamically based on normalization be-
tween the 10th and 90th percentiles, it is expected that
the majority of readings will fall within the accuracy
range [0.4, 0.6]. The 10th and 90th percentiles were
chosen after several attempts, as they proved to be
the most effective in representing the minimum and
maximum acceptable values for each column. This
range indicates a concentration of values within rel-
atively predictable limits. If the results fall outside
this expected range, this suggests the presence of val-
ues outside the expected standard, which may indi-
cate possible anomalies or significant inaccuracies in
the operation of the sensors or the machine. Figure 5
shows the same data on the same day, but in separate
graphs, which makes it easier to identify the inaccu-
racies in each sensor in more detail.
To evaluate the Completeness dimension, two
metrics were considered. The Metric 2, eq. 2,
when applied to different contexts (i.e., both rows and
columns), offers a unique perspective on data com-
pleteness. This metric is used to assess column in-
tegrity, providing a comprehensive view of data com-
pleteness by attribute, which is essential to identify
problems in each sensor. By row, it provides a de-
tailed view of data integrity at the record level, help-
ing to identify problems at the machine level as a
whole. To evaluate this metric, the last day of the de-
fined dataset sample (11 October) was used and Met-
ric 2 was applied to each 5-minute block (around 300
values per column and around 2400 values per row).
Through data profiling tasks, it was possible to iden-
tify the number of null values and the total count of
values, both by column and by row, as well as identify
the types of data. These tasks fall into the categories
of Cardinality and Data Types, Patterns and Domains.
The results obtained for completeness at row level are
shown in Figure 6, where you can see that complete-
ness is almost always 1 (ideal value), except between
5:55 and 6:05 where completeness drops to 0.79 and
0.66 in each block.
The Metric 5, as presented in eq. 5, evaluates data
completeness by offering a complementary perspec-
tive and identifies missing records through timestamp
analysis, comparing the expected event pattern with
its actual occurrence. This approach provides insights
into the uniformity and temporal integrity of the data.
The mathematical representation of the metric is as
Real-Time Manufacturing Data Quality: Leveraging Data Profiling and Quality Metrics
63
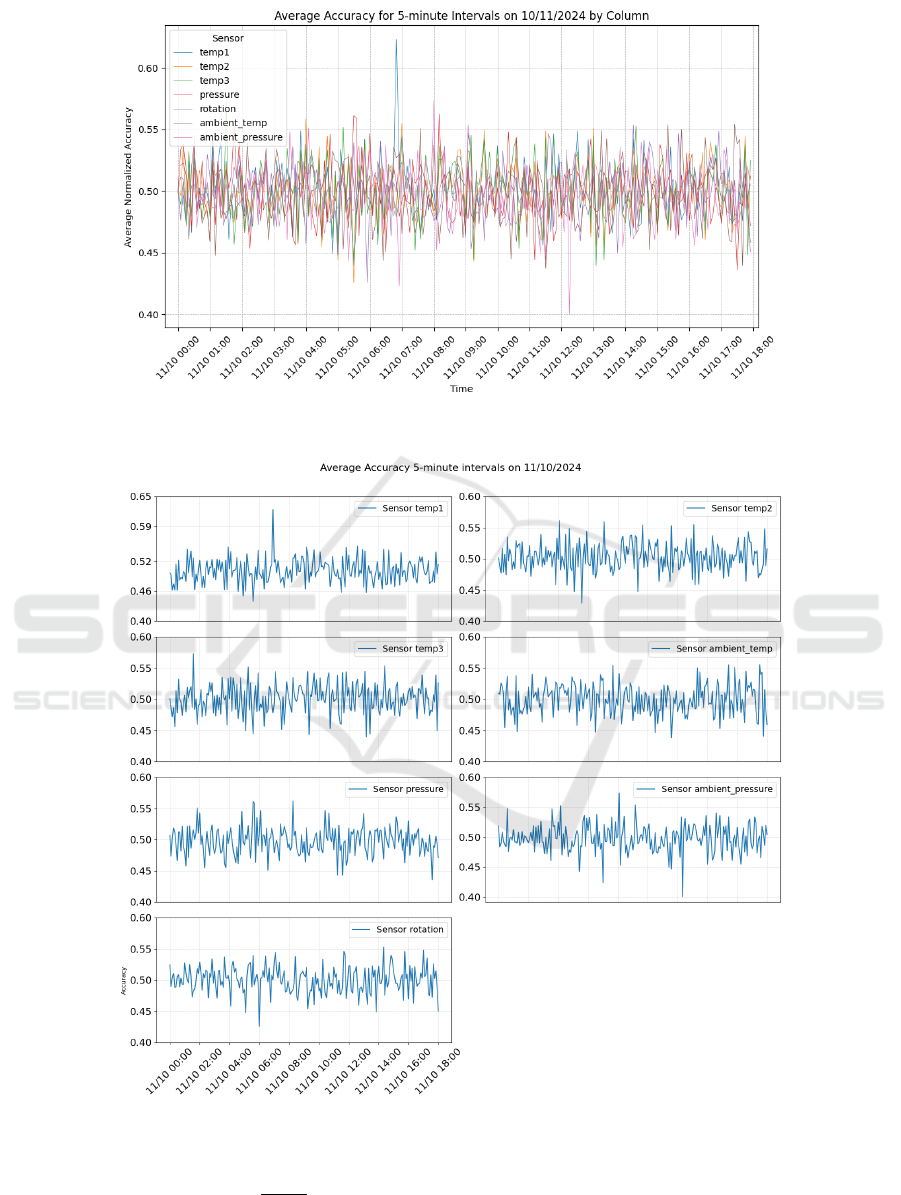
Figure 4: Accuracy results.
Figure 5: Accuracy results by column.
follows:
Completeness =
N
occur
N
exp
(5)
, where N
occur
represents the number of occurrences
in the specified time interval and N
exp
the number of
expected occurrences in that same interval. This met-
ric provides a means of assessing the regularity of the
data and identifying any gaps or irregularities in the
IoTBDS 2025 - 10th International Conference on Internet of Things, Big Data and Security
64
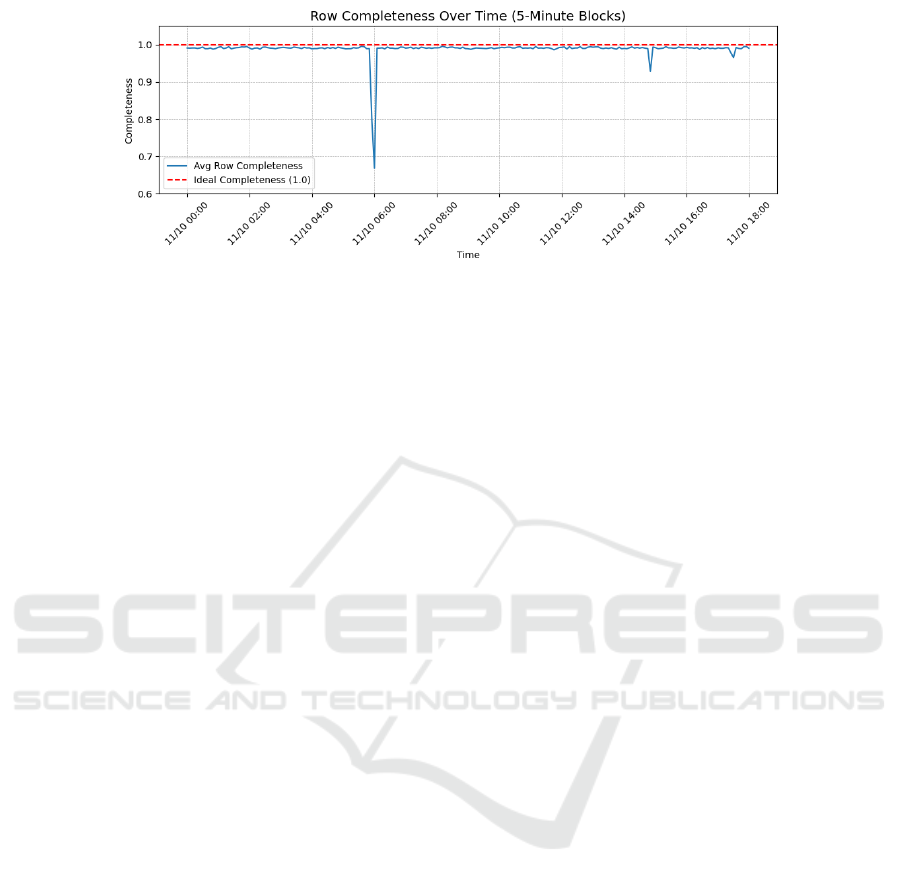
Figure 6: Completeness results by row.
collection of events. To calculate eq. 5, the data pro-
filing tasks presented by (Abedjan et al., 2018) are
used, such as counting the number of rows in the Car-
dinality category and the task of identifying data types
in the Data Types, Patterns, and Domains category.
Figure 7 illustrates the comparison between the
result obtained by the Metric 5 for 5-minute blocks
(represented by the blue line, where each point indi-
cates the total completeness in a block) and the ideal
completeness value (which would be 1). As shown in
the figure, there are times when the result corresponds
to the expected pattern, while at other times the result
decreases to the expected values, which could indicate
machine faults or data transfer problems. Incidentally,
none of the completeness values in the sample used
were higher than the expected value, if they were, this
could indicate duplicate values.
To calculate the Consistency Metric 3 (Eq. 3),
a historical dataset is required to establish the rules.
In this study, the first two days were used to identify
the rules, while the last day was used for verification.
Profiling and column dependencies were employed to
detect correlations, with a threshold of 0.7 indicat-
ing a high probability of a rule. Although correlation
alone is not sufficient to confirm a functional depen-
dency, it suggests possible relationships. Three strong
correlations were identified between different sensors
(temp1 with temp2, temp2 with temp3, and temp1
with temp3). The results, shown in Figure 8, reveal
that most of the 5-minute blocks on October 11 had a
consistency value of 1, indicating the identification of
all three rules. A smaller number of blocks showed a
consistency value of 0.66, indicating the identification
of two rules, and one block had a consistency value of
0.33, indicating the identification of only one rule.
The Timeliness dimension, as defined in Metric 4
(eq. 4), assesses the relevance of data based on its age,
which refers to the time that has passed since the data
was collected. This metric is essential to determine
whether the data is still valid and relevant for analysis
at the current time. To calculate Timeliness, the age
of the data is first determined by calculating the dif-
ference between the current time and the timestamp
when the data was recorded. This process utilizes the
Data Types, Patterns and Domains category of data
profiling. Specifically, it involves identifying the col-
umn that represents the timestamp of the data.
The volatility parameter is crucial in defining the
time window during which data remains relevant for
analysis. It can be expressed as a range, based on
domain knowledge, operational norms, or experience.
In this study, a volatility value of 10 minutes was ini-
tially assumed, meaning that data is considered cur-
rent and valid for 10 minutes from the moment of col-
lection. It is important to note that the volatility value
may vary depending on the system’s specific charac-
teristics or sensors used.
Thus, Timeliness provides a metric between 0 and
1, where 1 indicates that the data is perfectly current
and 0 indicates that the data is outside its valid period.
The closer the data are to the present, the higher the
timeliness score, reflecting its relevance to decision-
making. The results of the timeliness metric remained
at 0 for most of the day, indicating that the data was
outside the range of validity defined for the analysis.
However, in the last blocks of time (between 17:50
and 18:00), there was an increase, with values reach-
ing 0.25 and 0.7499, due to the fact that this data was
the most recent.
To summarise how data profiling contributes to as-
sessing each data quality metric, Figure 9 presents a
source-to-target diagram based on the taxonomy iden-
tified by the authors in (Abedjan et al., 2018). The di-
agram begins with the different types of data profiling
analysis - the analysis of individual columns and de-
pendencies between multiple columns - which form
the basis of the subsequent analysis categories.
These categories of analysis include Cardinality,
Value Distributions, Data Types, Patterns, Domains
and Functional Dependencies (the latter is not associ-
ated with any task and is directly related to the met-
ric), each of which plays a key role in specific tasks
Real-Time Manufacturing Data Quality: Leveraging Data Profiling and Quality Metrics
65
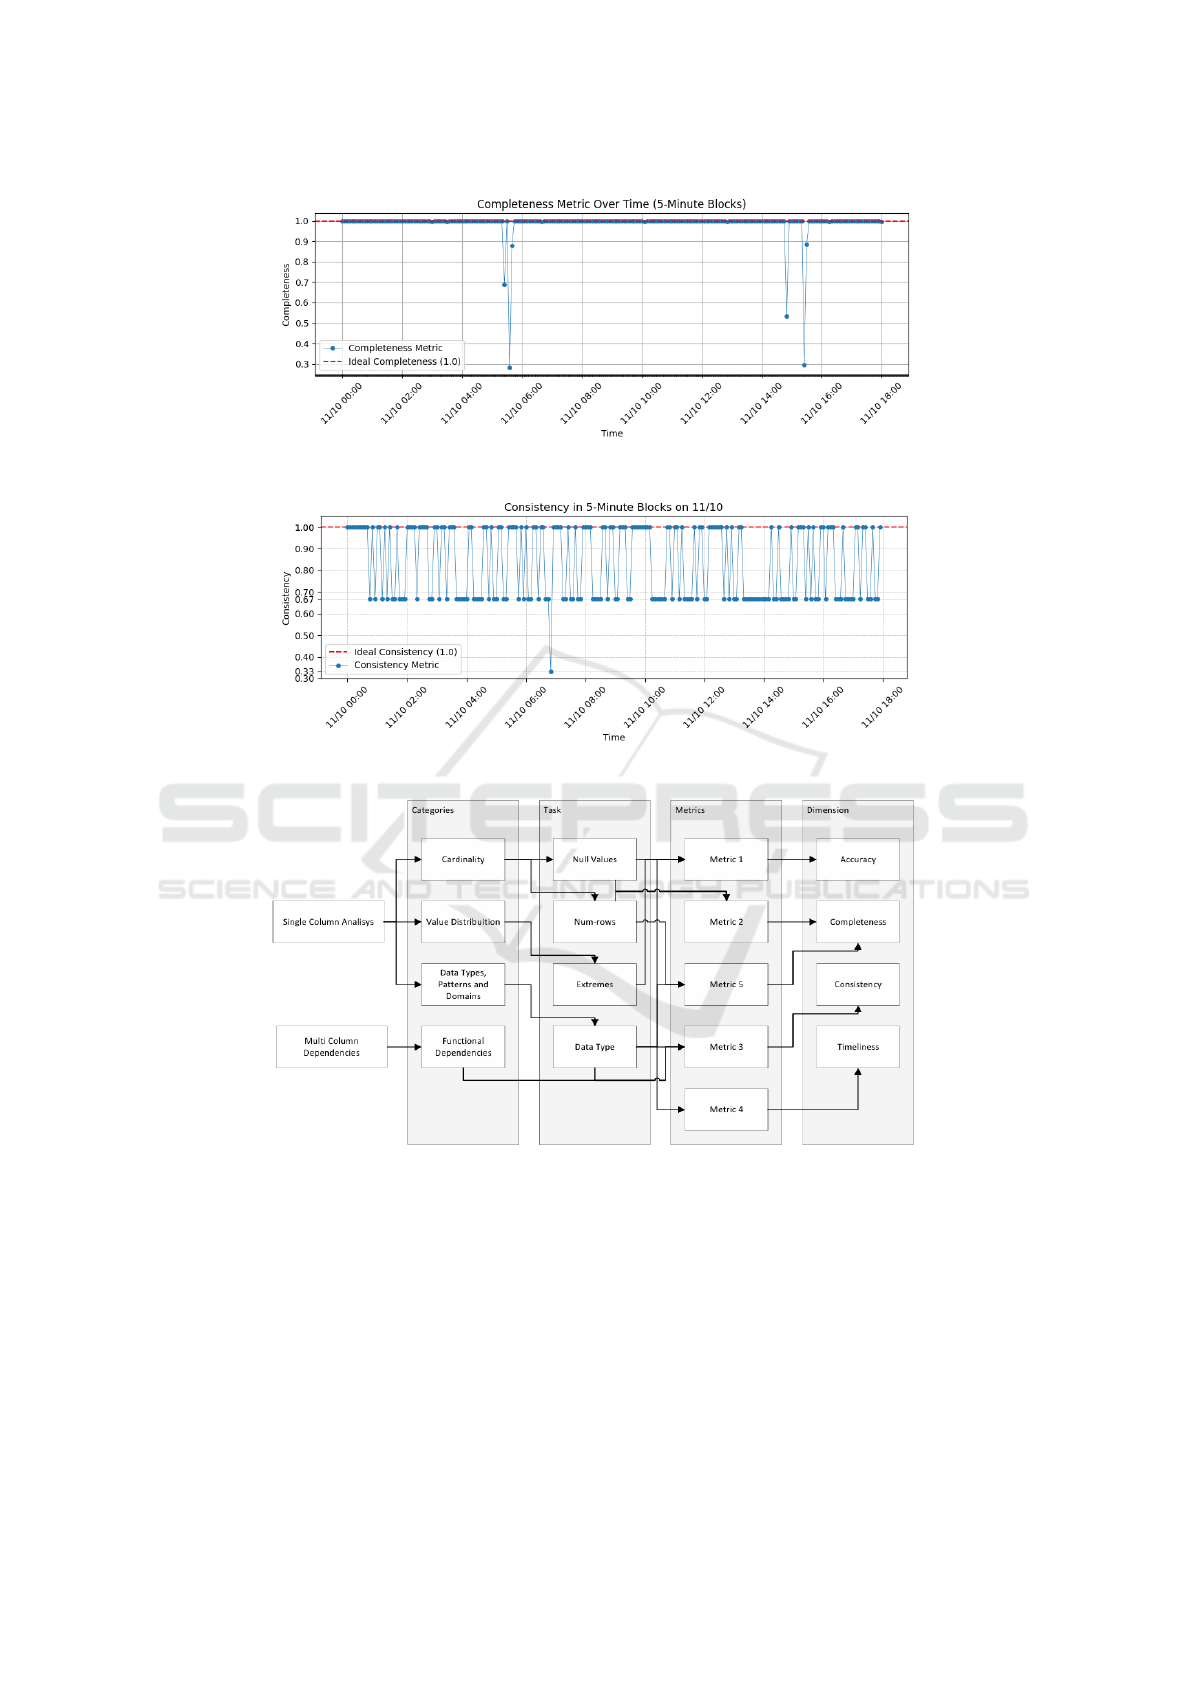
Figure 7: Completeness results from Metric 5.
Figure 8: Consistency results.
Figure 9: Correspondence between data profiling tasks, metrics and dimensions.
such as checking for null values, counting records,
identifying extreme values and data types. These
tasks provide essential information for calculating
various quality metrics, which in turn are linked to
specific data quality dimensions such as accuracy,
completeness, consistency and timeliness.
This linkage provides a structured view of how
different elements of analysis and metrics converge
to support the dimensions of data quality.
5 CONCLUSIONS
The Internet of Things (IoT) and Cyber-Physical Sys-
tems (CPS) are integral to the advancement of Indus-
try 4.0 and smart manufacturing (Goknil et al., 2023).
IoT supports interconnected devices to collect and ex-
change data during the manufacturing process, while
CPS combines computing, networking, and physical
processes to create autonomous, adaptive systems.
IoTBDS 2025 - 10th International Conference on Internet of Things, Big Data and Security
66

These technologies enhance automation, efficiency,
and innovation within Industry 4.0. However, the vol-
ume and diversity of data generated by this environ-
ment present significant challenges, including issues
like transmission noise, device malfunctions, and in-
stability.
To address these, we propose a data quality moni-
toring pipeline that integrates seamlessly into the core
process, ensuring continuous management of data
quality as part of the operational workflow, thus im-
proving data reliability and process efficiency. Met-
rics specifically tailored for IoT scenarios are used to
monitor data quality, allowing real-time assessment
with minimal configuration and eliminating the need
for complex, custom solutions.
Data profiling is a fundamental component of this
pipeline, providing insights into the structure, dis-
tribution, and relationships within datasets. Profil-
ing tasks, such as detecting null values, extreme val-
ues, data types, and dependencies, generate metadata
crucial for assessing data quality dimensions such as
Accuracy, Completeness, Consistency, and Timeli-
ness. Taking a proactive profiling approach, we en-
able rapid responses to quality issues, ensuring high
data quality over time. Moreover, integrating data
profiling into the monitoring pipeline helps address
common IoT challenges, such as sensor malfunctions
and data gaps, which could otherwise affect opera-
tional performance and product quality. The profiling
outputs allow for automated checks, reducing human
intervention and enabling timely adjustments to main-
tain process stability.
Future work will focus on improving both perfor-
mance and outcomes by incorporating advanced tech-
niques such as sketching methods (e.g., t-digest (Dun-
ning, 2021)).
ACKNOWLEDGEMENTS
This work has been supported by the European Union
under the Next Generation EU, through a grant of
the Portuguese Republic’s Recovery and Resilience
Plan (PRR) Partnership Agreement, within the scope
of the project PRODUTECH R3 – ”Agenda Mo-
bilizadora da Fileira das Tecno-logias de Produc¸
˜
ao
para a Reindustrializac¸
˜
ao”, Total project investment:
166.988.013,71 Euros; Total Grant: 97.111.730,27
Euros.
REFERENCES
Abedjan, Z., Golab, L., Naumann, F., and Papenbrock, T.
(2018). Data profiling. Synthesis Lectures on Data
Management, 10:1–154.
Agolla, J. E. (2021). Smart Manufacturing: Quality Control
Perspectives. IntechOpen.
Azeroual, O., Saake, G., and Schallehn, E. (2018). Analyz-
ing data quality issues in research information systems
via data profiling. International Journal of Informa-
tion Management, 41:50–56.
Bandara, K., Bergmeir, C., and Smyl, S. (2020). Fore-
casting across time series databases using recurrent
neural networks on groups of similar series: A clus-
tering approach. Expert Systems with Applications,
140:112896.
Batini, C. and Scannapieco, M. (2016). Data and Informa-
tion Quality. Springer International Publishing.
Byabazaire, J., O’Hare, G., and Delaney, D. (2020). Us-
ing trust as a measure to derive data quality in data
shared iot deployments. In 2020 29th International
Conference on Computer Communications and Net-
works (ICCCN), pages 1–9. IEEE.
Cichy, C. and Rass, S. (2019). An overview of data quality
frameworks. IEEE Access, 7:24634–24648.
Dunning, T. (2021). The t-digest: Efficient estimates of
distributions. Software Impacts, 7:100049.
Goknil, A., Nguyen, P., Sen, S., Politaki, D., Niavis, H.,
Pedersen, K. J., Suyuthi, A., Anand, A., and Ziegen-
bein, A. (2023). A systematic review of data quality in
cps and iot for industry 4.0. ACM Computing Surveys,
55(14s):1–38.
Groover, M. P. (2010). Fundamentals of modern manufac-
turing: materials, processes, and systems. John Wiley
& Sons.
Heine, F., Kleiner, C., and Oelsner, T. (2019). Automated
Detection and Monitoring of Advanced Data Quality
Rules, pages 238–247. Springer, Cham.
Hu, C., Sun, Z., Li, C., Zhang, Y., and Xing, C. (2023).
Survey of time series data generation in iot. Sensors,
23.
ISO/IEC 25012:2008 (2008). Software engineering Soft-
ware product Quality Requirements and Evaluation
(SQuaRE) Data quality model. Standard, Interna-
tional Organization for Standardization, Geneva, CH.
Khan, J., Dalu, R., and Gadekar, S. (2014). Defects in ex-
trusion process and their impact on product quality.
International journal of mechanical engineering and
robotics research, 3(3):187.
Kusumasari, T. F. and Fitria (2016). Data profiling for data
quality improvement with openrefine. In 2016 Inter-
national Conference on Information Technology Sys-
tems and Innovation (ICITSI), pages 1–6. IEEE.
Liu, C., Peng, G., Kong, Y., Li, S., and Chen, S. (2021).
Data quality affecting big data analytics in smart fac-
tories: research themes, issues and methods. Symme-
try, 13(8):1440.
Loshin, D. (2011). The Practitioner’s Guide to Data Qual-
ity Improvement. Elsevier.
Real-Time Manufacturing Data Quality: Leveraging Data Profiling and Quality Metrics
67

Mahanti, R. (2019). Data Quality: Dimensions, Measure-
ment, Strategy, Management, and Governance. ASQ
Quality Press, USA.
Naumann, F. (2014). Data profiling revisited. ACM SIG-
MOD Record, 42:40–49.
Oliveira,
´
O. and Oliveira, B. (2022). An extensible frame-
work for data reliability assessment. In Proceedings
of the 24th International Conference on Enterprise In-
formation Systems, pages 77–84. SCITEPRESS - Sci-
ence and Technology Publications.
Rangineni, S., Bhanushali, A., Suryadevara, M., Venkata,
S., and Peddireddy, K. (2023). A review on enhancing
data quality for optimal data analytics performance.
International Journal of Computer Sciences and En-
gineering, 11:51–58.
Schultheis, A., Malburg, L., Gr
¨
uger, J., Weich, J., Bertrand,
Y., Bergmann, R., and Asensio, E. S. (2024). Iden-
tifying Missing Sensor Values in IoT Time Series
Data: A Weight-Based Extension of Similarity Mea-
sures for Smart Manufacturing, pages 240–257.
Sicari, S., Cappiello, C., Pellegrini, F. D., Miorandi, D.,
and Coen-Porisini, A. (2016). A security-and quality-
aware system architecture for internet of things. Infor-
mation Systems Frontiers, 18:665–677.
Tverdal, S., Goknil, A., Nguyen, P., Husom, E. J., Sen, S.,
Ruh, J., and Flamigni, F. (2024). Edge-based data pro-
filing and repair as a service for iot. pages 17–24. As-
sociation for Computing Machinery.
Zhang, L., Jeong, D., and Lee, S. (2021). Data qual-
ity management in the internet of things. Sensors,
21(17):5834.
IoTBDS 2025 - 10th International Conference on Internet of Things, Big Data and Security
68
