
Development of a Procedure for Detecting Dementia Symptoms Using
Features in Differential Waveforms of the Pupil Light Reflex
Minoru Nakayama
1 a
, Wioletta Nowak
2 b
and Anna
˙
Zarowska
2 c
1
Institute of Science Tokyo (Tokyo Tech.), O-okayama, Meguro-ku, Tokyo, 152–8552, Japan
2
Wrocław University of Science and Technology, Wrocław, 50–370, Poland
Keywords:
Pupil, Pupil Light Reflex, Alzheimer’s Disease, Feature Extraction, Functional Data Analysis.
Abstract:
A procedure for detecting dementia levels is developed using features of waveform shapes of the pupillary
light reflex (PLR) in response to chromatic light pulses on either eye. Features of waveform shapes were
extracted using a functional data analysis technique which measured the reactions of both eyes. In considering
the physiological mechanism, differential waveform shapes were also analysed. The feature was extracted as a
coefficient of B-spline basis functions of the waveforms. The feature sets of the differential waveform shapes
for blue and red light pulses contributed to detection performance. Also, feature weights are used to represent
PLR reaction mechanisms and differences in response to chromatic stimuli.
1 INTRODUCTION
Conventionally, the pupil light reflex (PLR) is based
on ipRGC (intrinsically photosensitive retinal gan-
glion cell) systems which can be an index for the di-
agnosis of various types of diseases (Gamlin et al.,
2007; Kawasaki and Kardon, 2007; Chougule et al.,
2019; Kelbsch et al., 2019). In order to develop a
biomarker of diseases, PLRs in response to chromatic
stimuli have been observed and analysed (Nowak
et al., 2020; Nowak et al., 2021; Nakayama et al.,
2022; Nakayama et al., 2023b). In particular, the
differential responses caused by problems with sig-
nal transfer by the optic nerve of each eye may pro-
vide clinical information such as the influence of de-
mentia or Alzheimer’s disease on the synchronisa-
tion of pupil reactions (McDougal and Gamlin, 2015;
Chaitanuwong et al., 2023; Molitor et al., 2015; Nie
et al., 2020). Asynchronicity of PLRs of both eyes
shows some symptoms of the disease in the optic
nerve system, as some factors may influence on PLRs,
since most participants are elderly people (Nakayama
et al., 2024a). In order to observe the disparity of
both pupils, PLR measurements of both eyes using
a light pulse to either eye may be useful (Nakayama
et al., 2022; Nakayama et al., 2023b; Nakayama
a
https://orcid.org/0000-0001-5563-6901
b
https://orcid.org/0000-0002-4135-2526
c
https://orcid.org/0000-0003-4544-9082
et al., 2024b). Another issue is the methodology of
feature extraction of PLR waveforms, because the
waveform shapes of PLRs may reflect the dynamics
of physiological functions. However, overall wave-
form features have been used before, though detec-
tion performance for irregular responses was insuffi-
cient (Nowak et al., 2019). In order to improve perfor-
mance significantly, a set of specific features of PLRs
measured during the pupil constriction phase was in-
troduced instead of the overall set of features. The
remaining part of the waveform, composed of pupil
reactions after the eye has recovered from constric-
tion are often referred to as post-illumination pupil re-
sponses (PIPRs) in the diagnostic procedure. In con-
sidering the localised features of waveform shapes,
an improved feature extraction procedure for entire
waveform is required. A functional data analysis
technique can be applied to waveforms of any length
and waveform features including PLR waveforms can
be extracted (Nakayama et al., 2024a). The benefit of
this will be confirmed in this paper.
This paper examines the possibility of detec-
tion for dementia levels using differential features of
waveform shapes of PLRs. In particular, the effective-
ness of extracting features from an entire PLR wave-
form and introducing features of differentials of PLR
waveforms is discussed. The following topics are ad-
dressed in this paper.
1. The features of waveform shapes, which are sum-
Nakayama, M., Nowak, W. and
˙
Zarowska, A.
Development of a Procedure for Detecting Dementia Symptoms Using Features in Differential Waveforms of the Pupil Light Reflex.
DOI: 10.5220/0013244400003911
Paper published under CC license (CC BY-NC-ND 4.0)
In Proceedings of the 18th International Joint Conference on Biomedical Engineering Systems and Technologies (BIOSTEC 2025) - Volume 1, pages 943-948
ISBN: 978-989-758-731-3; ISSN: 2184-4305
Proceedings Copyright © 2025 by SCITEPRESS – Science and Technology Publications, Lda.
943

mations and ratios of PLRs of both eyes, are ex-
tracted using a B-spline technique while either eye
is irradiated in blue or red light pulse.
2. Classification performance of the level of demen-
tia is examined using a combination of extracted
features of PLRs
The following section of this paper consists of re-
lated works, where the method, classification analysis
for patients and normal control group, and summary
of the work are based on previous studies.
2 RELATED WORKS
Some clinical surveys measuring PLR reactions
to chromatic light stimuli have been conducted
since ipRGC was discovered (Gamlin et al., 2007;
Kawasaki and Kardon, 2007; Chougule et al., 2019;
Kelbsch et al., 2019). In addition to these studies,
possible levels of dementia have also been measured
using chromatic light pulse stimuli of the pupil (Moli-
tor et al., 2015; Nie et al., 2020). Since the number of
patients who can participate is limited, most analyses
have been published as case studies. In due course,
more systematic surveys were conducted, and addi-
tional analytical reports were published (Nakayama
et al., 2022; Nakayama et al., 2023b). This survey
consists of two sets of light irradiation, of the left and
right eyes, as validation tests using previously studied
data sets of left and right eye light pulses (Nakayama
et al., 2022; Nakayama et al., 2023b). The ocular
responses of each eye may differ, even though the
same stimulus is provided simultaneously. The re-
sponses of either eye can be summarised as indepen-
dent data sets when differential metrics are introduced
(Nakayama et al., 2024b). In experimental surveys,
the participation of patients is limited, and asymmet-
ric responses can be used to compensate for the dearth
of measured data.
However, in these previous studies the analyses
employed a set of fixed feature points which were
extracted during a large reaction to the light pulse
(Nowak et al., 2020; Nowak et al., 2021). The over-
all features of PLR waveform shapes should be in-
troduced, as mentioned in the introduction. One ap-
proach may be the extraction of feature of waveform
shapes using a B-spline technique (Ramsay et al.,
2009; López et al., 2022; Nakayama et al., 2024a),
however an appropriate dimension reduction tech-
nique will be required in order to suppress the large
number of dimensions of the features. The features of
entire waveform shapes may be useful for the detailed
analysis of time series data, and the temporal features
can be compared for the feature selections. The pos-
sibility of patient detection using PLR waveform fea-
tures should be examined. In most cases, B-spline is
often employed as a basis function. Therefore, this
work is based on this conventional procedure as the
first step.
3 METHOD
The set of PLR data consiting pupillary responses
to be analysed was surveyed in previous studies
(Nakayama et al., 2022; Nakayama et al., 2023b),
which measured 1 sec. chromatic light pulses (blue
or red) to either eye during a 10 sec. period of obser-
vations. The participants were elderly people and in-
cluded some patients with Alzheimer’s disease (AD),
mild cognitive impairment (MCI) and a normal con-
trol group (NC).
3.1 Experimental Procedure
3.1.1 Measurmement Protocols
Pupil diameters of each eye were measured for 10 sec.
in a temporal darkened space under the following con-
ditions (Nakayama et al., 2022). PLRs were measured
during Conditions 2-5.
1. Condition 1: Observe static pupil oscillation with-
out light pulses
2. Condition 2: Blue light pulses to the right eye
3. Condition 3: Blue light pulses to the left eye
4. Condition 4: Red light pulses to the right eye
5. Condition 5: Red light pulses to the left eye
The light stimulus is irradiated for one second dur-
ing each session. The combination of the experimen-
tal conditions is fixed for all participants. In regards to
each of the four light pulse irradiation conditions, the
measured data is classified into sets for irradiation of
the left and right eyes. Condition 1 is a set of common
data for both eyes (Nakayama et al., 2024b).
The experimental procedure was approved by an
ethics committee at Osaka Kawasaki Rehabilitation
University.
3.1.2 Apparatus
Pupil diameters of both eyes were observed using a
piece of specialised measuring equipment at 60Hz
(URATANI, HITOMIRU). Light stimuli consisted of
a blue light source (469nm, 14.3cd/m
2
, 6.5lx) and a
red light source (625nm, 12.3cd/m
2
, 10.5lx).
BIOSIGNALS 2025 - 18th International Conference on Bio-inspired Systems and Signal Processing
944
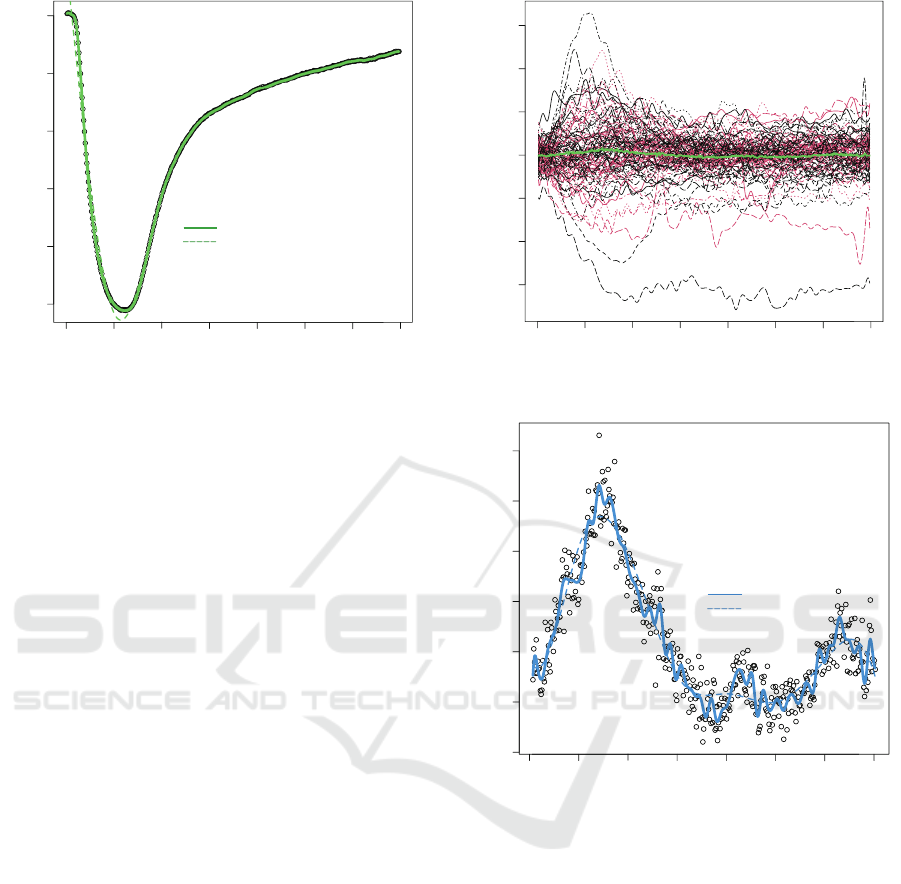
0.75 0.80 0.85 0.90 0.95 1.00
Relative Pupil Size
70 basis
10 basis
1
2 3 4 5 6 7
Time (seconds)
8
Figure 1: A summation signal of PLRs for blue light pulses.
3.1.3 Experimental Participants
101 elderly individuals were selected to take part in
the experiment (Mean age : 78.5, SD : 8.9, F:66,
M:35) (Nakayama et al., 2022; Nakayama et al.,
2023a). Their cognitive functions were diagnosed
by a clinical doctor and sorted into three levels us-
ing MMSE (Mini-Mental State Examination) scores
(Tombaugh et al., 1996).
• AD: 32 (Mean age:83.0, SD:6.3, F:22, M:10).
• MCI: 9 (Mean age:82.1, SD:6.3, F:5, M:4).
• NC: 60 (Mean age:75.6, SD:9.2, F:38, M:22).
3.2 Analysis of Functional Data
Measured pupil sizes are summarised into sets for ir-
radiation of the left and right eyes, forming two sets
of data (the left and right eye data sets). Condition 1
is provided as a common control condition. Observed
signals from both eyes are processed as summation
of thr left and right eyes, and the ratios between the
sizes for the left and right eyes right size/left size) are
asynchronous measurements. All data are standard-
ised using the initial level measurements made during
the initial 1 sec. before irradiation. Also, the period
of the final 2 sec. is eliminated in order to reduce the
amount of data measured. Figure 1 shows the over-
all means of summation waveforms of the left eye re-
sponses to right eye blue light irradiation. The hor-
izontal axis represents the time course, from 1 to 8
seconds. A waveform of pupil size shows pupil con-
strict, with dome delay, after 1 second blue light pulse
(1-2sec.). The summation waveform is very smooth.
This waveform can be represented using a B-spline
basis function as a functional data analysis technique
(Ramsay et al., 2009; López et al., 2022). When 70
0.85 0.90 0.95 1.00 1.05
1.10 1.15
Pupil ratio (right / left)
NC
MCI+AD
Oveall average
1 2 3 4 5 6 7
Time (seconds)
8
Figure 2: Individual differential signals of PLRs for blue
light pulses.
0.996 0.998 1.000 1.002 1.004 1.006
1.008
Pupil ratio (right / left)
70 basis
10 basis
1
2 3 4 5 6 7
Time (seconds)
8
Figure 3: A differential signal of PLRs for blue light pulses.
basis functions are introduced (the solid line), the fit
is much better than in the case of 10 basis functions
(the dotted line), as shonwn in Figure 1. In this pa-
per, a condition with 70 basis functions is selected for
evaluating errors of reproduction and detection per-
formances, as detailed in the following analysis.
The individual differential ratio of both eyes is il-
lustrated in Figure 2. Most differential lines are con-
nected around ratio=1, though some differences are
observed around light pulses (1-3sec.) and at the end
of the observation period (8 sec.). The red lines in-
dicate patient cases (AD and MCI). A summation
of these waveforms is illustrated in Figure 3, show-
ing that even the changes in overall summation have
not been smoothened. In this case, 70 B-spline basis
functions are required to represent the waveform.
As an FDA technique, sets of coefficients of basis
functions can be used to represent features of wave-
Development of a Procedure for Detecting Dementia Symptoms Using Features in Differential Waveforms of the Pupil Light Reflex
945
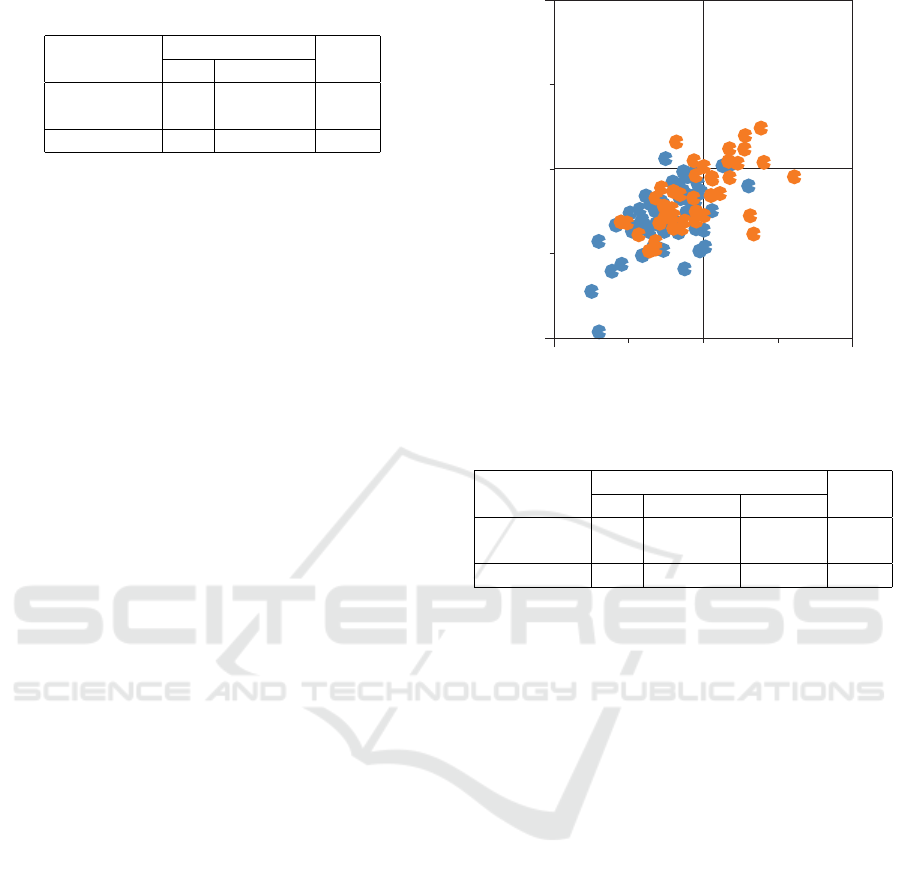
Table 1: Contingency table: Right trained / Left tested.
Classified
Participants NC MCI+AD Total
NC 54 6 60
MCI+AD 24 17 41
Total 78 23 101
form shapes of PLRs or differential PLRs. These sets
of features of PLR waveforms are used for classifica-
tion of participants in the section which follows.
4 CLASSIFICATION RESULTS
Using the extracted features from waveform shapes
and logistic regression functions, patients are clas-
sified as either patients (AD or MCI) or NC partic-
ipants. A logistic function presents the probability
of diagnosing patients using the set of features men-
tioned above. The waveform features are generated
from waveform shapes, and measurement conditions
such as using blue, red, or both colours of chromatic
lights, can be combined. However, the number of di-
mensions of features increases even as the LASSO
technique (Kawano et al., 2018) is introduced in or-
der to select features which are significant.
In an evaluation of classification performance,
cross validation of the irradiation of the right or left
eye is introduced and another set of data of left and
right eye measurements is used, for example, when
the regression model is trained using the data set of
the right eye and tested against the data set of the
left eye. In comparison of performance using several
combination of features of waveforms, the best per-
formance obtained to date is from a combination of
using a control condition, and differential ratios for
blue and red light, for a total of 270 dimensions of
features.
A contingency table classifying performance is
summarised in Table 1. The horizontal column repre-
sents the classified results, and the vertical row shows
the type of participant. Once again, the results present
the classification of the data set of the left eye using a
regression model trained with the data set of the right
eye. In the results, 71 out of the 101 participants were
classified correctly using a threshold 0.5, and the ac-
curacy was 70%. In another regression model classifi-
cation of the right eye, the accuracy was 65%. Though
an improvement of detection performance is required,
the differential ratios of irradiations using both blue
and red light pulseses may indicate the existence of
physiological impairment, which causes dementia.
Using the data set combination, detection occurs
1
0
0.5
0.50 1
NC
MCI+AD
Probability: Left to Right
Probability: Right to Left
Figure 4: A differential signal of PLRs for blue light pulses.
Table 2: Contingency table using both detections.
Classified
Participants NC Either(+) Both(+) Total
NC 52 6 2 60
MCI+AD 22 11 8 41
Total 74 17 10 101
twice for each participant. are produced for each par-
ticipant. These probabilities are summarised in Figure
4. The horizontal axis represents the probability of
patients trained with the right eye data set and tested
using the left eye data set, and the vertical axis repre-
sents probabilities of patients trained with the left eye
data set and tested using the right eye data set. In the
figure, the blue dots represent NC participants, and
the orange dots represent MCI or AD patients. The
threshold of 0.5 is represented by fine lines along the
horizontal and vertical axes. The plots of many par-
ticipants overlap in the centre of the graph.
The two procedures produce two probabilities, so
participants are classified again using the logical OR
of the two classification results. These results are
summarised in Table 2. Using this procedure to merge
the results, the number of patient detections increases
slightly. However, overall accuracy remains at the
same level such as 70% in the case mentioned above.
In order to evaluate the contribution of ex-
tracted waveform features, the feature values are sum-
marised, as shown in Figure 5. The horizontal axis
represents time such as a dimensional sequence, and
the vertical axis represents the weight values. Mean
weights of the three waveforms for control, blue, and
red differentials of the data sets of the right and left
eyes are summarised. The weights on both sides are
almost the same. Regarding the changes in weights,
BIOSIGNALS 2025 - 18th International Conference on Bio-inspired Systems and Signal Processing
946
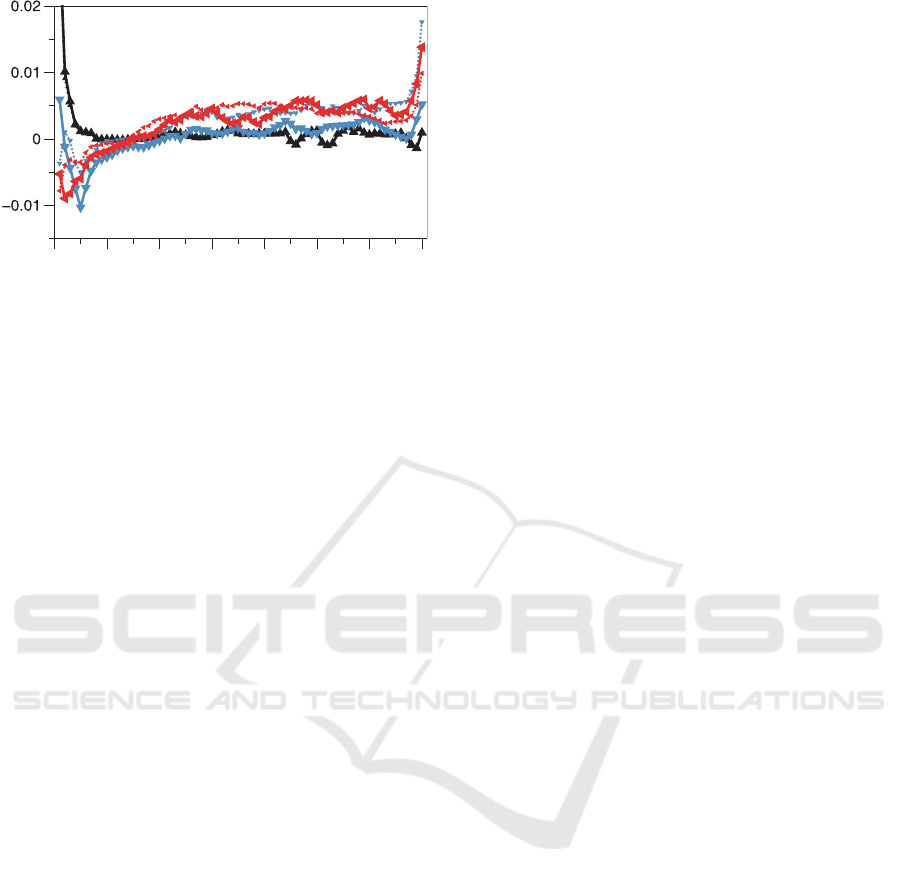
1 2 3 4 5 6 7
Time (seconds)
8
Weight
Figure 5: Comparison of coefficients of PLRs for control
(black), and differentials for blue and red light pulses.
the amounts are relarively large during the light pulses
and at the ends of the observations. There are some
differences between blue and red light pulses. Also,
the weights for red light pulses are maintained after
the light pulse. As a phenomenon, post-illumination
pupil response (PIPR) is observed in the case of red
light irradiation. These differences may suggest that
some weight patterns at the ends of the reaction ob-
servations show some increase. These results indicate
that the most correct detections are accomplished by
using the overall features of PLR waveform shapes.
Further feature selection and additional features of
waveforms from around the irradiation of light pulses
when constriction of the pupil does not occur may be
required in order to improve performance. The fac-
tor of the basis function should be also evaluated to
improve performance. In addition, MCI and AD de-
tection performance will be examined. As the number
of patients is limited, a different detection procedure
will be required. A detailed analysis of performance
improvements will be a subject of our further study.
5 SUMMARY
The hypothesis that pupillary light reflex (PLR) wave-
form shapes may provide feature metrics about pa-
tients with dementia was tested using a functional data
analysis technique to extract features of overall wave-
forms. Detection performances of a clinical survey
data consisting of PLRs of chromatic light pulses to
either eye was evaluated. The features of differential
waveform shapes of each eye contributed to their clas-
sification. The feature of waveform shapes also pre-
sented physiological features of PLRs of chromatic
light pulses.
REFERENCES
Chaitanuwong, P., Singhanetr, P., Chainakul, M., Arjkong-
harn, N., Ruamviboonsuk, P., and Grzybowski, A.
(2023). Potential ocular biomarkers for early detection
of Alzheimer’s disease and their roles in artificial in-
telligence studies. Neurology and Therapy, 12:1517–
1532.
Chougule, P. S., Najjar, R. P., Finkelstein, M. T., Kandiah,
N., and Milea, D. (2019). Light-induced pupillary re-
sponses in Alzheimer’s disease. Frontiers in Neurol-
ogy, 10(360):1–12.
Gamlin, P. D., McDougal, D. H., and Pokorny, J. (2007).
Human and macaque pupil responses driven by
melanopsin-containing retinal ganglion cells. Vision
Research, 47:946–954.
Kawano, S., Matsui, H., and Hirose, K. (2018). Statistical
Modeling via Sparse Estimation. KYORITSU Publi-
cation, Tokyo, Japan.
Kawasaki, A. and Kardon, R. H. (2007). Intrinsically pho-
tosensitive retinal ganglion cells. Journal of Neuro-
Ophthalmology, 27:195–204.
Kelbsch, C., Strasser, T., Chen, Y., Feigl, B., Gamlin, P. D.,
Kardon, R., Peters, T., Roeckeln, K. A., Steinhauer,
S. R., Szabadi, E., Zele, A. J., Wilhelm, H., and Wil-
helm, B. J. (2019). Standards in pupillography. Fron-
tiers in Neurology, 10(129):1–26.
López, O. A. M., López, A. M., and Crossa, J. (2022). Mul-
tivariate Statistical Machine Learning Methods for
Genomic Prediction. Springer, New York, USA.
McDougal, D. H. and Gamlin, P. D. (2015). Auto-
nomic control of the eye. Comprehensive Physiology,
5(1):439–473.
Molitor, R. J., Ko, P. C., and Ally, B. A. (2015). Eye move-
ments in Alzheimer’s disease. Journal of Altzheimers
Disease, 44(1):1–12.
Nakayama, M., Nowak, W., and Krecicki, T. (2024a). De-
tecting Alzheimers patients using features in differen-
tial waveforms of pupil light reflex for chromatic stim-
uli. EAI Endorsed Transactions on Intelligent Systems
and Machine Learning Applications, 1:1–7.
Nakayama, M., Nowak, W., and Zarowska, A. (2022). De-
tecting symptoms of dementia in elderly persons us-
ing features of pupil light reflex. In Proceedings of
the Federated Conference on Computer Science and
Information Systems (FedCSIS), pages 745–749.
Nakayama, M., Nowak, W., and Zarowska, A. (2023a). Pre-
diction procedure for dementia levels based on wave-
form features of binocular pupil light reflex. In Pro-
ceedings of ACM Eye-Tracking Research & Applica-
tions (ETRA), pages 1–6.
Nakayama, M., Nowak, W., and Zarowska, A. (2023b).
Using features of PLRs to chromatic light pulse ir-
radiations of either eye to detect dementia in elderly
persons. Communication Papers of the 18th Confer-
ence on Computer, Science and Intelligent Systems,
37:201–207.
Nakayama, M., Nowak, W., and Zarowska, A. (2024b).
Extracting dementia symptoms in elderly using ocu-
lar motor activity during pupil light reflexes to chro-
Development of a Procedure for Detecting Dementia Symptoms Using Features in Differential Waveforms of the Pupil Light Reflex
947

matic light pulses on either eye. In Proceedings
of International Conference Information Visualisation
(IV2024), pages 1–6.
Nie, J., Qiu, Q., Philips, M., Sun, L., Yan, F., Lin, X., Xiao,
S., and Li, X. (2020). Early diagnosis of mild cogni-
tive impairment based on eye movement parameters in
an aging Chinese population. frontiers in Aging Neu-
roscience, 29(Article 221):1–11.
Nowak, W., Nakayama, M., Kr˛ecicki, T., and Hachoł,
A. (2020). Detection procedures for patients of
Alzheimer’s disease using waveform features of pupil
light reflex in response to chromatic stimuli. EAI En-
dorsed Transactions on Pervasive Health and Tech-
nology, 6:1–11. e6.
Nowak, W., Nakayama, M., Kr˛ecicki, T., Trypka, E., An-
drzejak, A., and Hachoł, A. (2019). Analysis for ex-
tracted features of pupil light reflex to chromatic stim-
uli in Alzheimer’s patients. EAI Endorsed Transac-
tions on Pervasive Health and Technology, 5:1–10. e4.
Nowak, W., Nakayama, M., Trypka, E., and Zarowska, A.
(2021). Classification of Alzheimer’s disease patients
using metrics of oculo-motors. In Proceedings of the
Federated Conference on Computer Science and In-
formation Systems (FedCSIS), pages 403–407.
Ramsay, J., Hooker, G., and Graves, S. (2009). Functional
Data Analysis with R and MATLAB. Springer, New
York, USA.
Tombaugh, T., McDowell, I., Kristjansson, B., and Hubley,
A. (1996). Mini-mental state examination (MMSE)
and the modified MMSE (3MS): A psychometric
comparison and normative data. Psychological As-
sessment, 8(1):48–59.
BIOSIGNALS 2025 - 18th International Conference on Bio-inspired Systems and Signal Processing
948
