
Homography VAE: Automatic Bird’s Eye View Image Reconstruction
from Multi-Perspective Views
Keisuke Toida
1 a
, Naoki Kato
2 b
, Osamu Segawa
2 c
, Takeshi Nakamura
2 d
and Kazuhiro Hotta
1 e
1
Meijo University, 1-501 Shiogamaguchi, Tempaku-ku, Nagoya 468-8502, Japan
2
Chubu Electric Power Co., Inc., 1-1 Higashishin-cho, Higashi-ku, Nagoya 461-8680, Japan
Keywords:
Variational Autoencoder, Homography Transformation, Unsupervised Learning.
Abstract:
We propose Homography VAE, a novel architecture that combines Variational AutoEncoders with Homog-
raphy transformation for unsupervised standardized view image reconstruction. By incorporating coordinate
transformation into the VAE framework, our model decomposes the latent space into feature and transfor-
mation components, enabling the generation of consistent standardized view from multi-viewpoint images
without explicit supervision. Effectiveness of our approach is demonstrated through experiments on MNIST
and GRID datasets, where standardized reconstructions show significantly improved consistency across all
evaluation metrics. For the MNIST dataset, the cosine similarity among standardized view achieved 0.66,
while original and transformed views show 0.29 and 0.37, respectively. The number of PCA components re-
quired to explain 95% of the variance decreases from 193.5 to 33.2, indicating more consistent representations.
Even more pronounced improvements are observed on GRID dataset, in which standardized view achieved a
cosine similarity of 0.92 and required only 7 PCA components compared to 167 for original images. Further-
more, the first principal component of standardized view explains 71% of the total variance, suggesting highly
consistent geometric patterns. These results validate that Homography VAE successfully learns to generate
consistent standardized view representations from various viewpoints without requiring ground truth Homog-
raphy matrices.
1 INTRODUCTION
In recent years, the importance of techniques for
transforming images captured from various view-
points into a standardized perspective has grown
significantly in fields such as autonomous driving
and surveillance camera systems. Bird’s Eye View
(BEV), which provides a top-down perspective of
a scene, is particularly important for these applica-
tions as it enables better understanding of spatial re-
lationships and object positions. Although Homog-
raphy transformation has been widely used for such
viewpoint transformations, manual estimation of Ho-
mography parameters requires significant human ef-
fort and expertise, making it impractical for large-
scale applications. In the field of deep learning, Vari-
a
https://orcid.org/0009-0006-4873-3651
b
https://orcid.org/0009-0004-3815-0829
c
https://orcid.org/0009-0000-2469-6098
d
https://orcid.org/0009-0001-4991-3383
e
https://orcid.org/0000-0002-5675-8713
ational Autoencoders (VAE) (Kingma and Welling,
2014) have demonstrated excellent performance in
image generation and reconstruction. Although VAEs
can encode input data into a low-dimensional latent
space and reconstruct the original data from it, con-
ventional VAEs struggle to directly reconstruct stan-
dardized view images from perspective-transformed
images.
To address this limitation and enable unsuper-
vised learning of viewpoint transformations, we pro-
pose Homography VAE, a novel architecture that in-
corporates Homography transformation into the VAE
framework through coordinate transformation. Our
model learns to decompose the latent space into fea-
ture and transformation components, enabling the re-
construction of both input and standardized view us-
ing a single framework.
We demonstrated the effectiveness of our pro-
posed method through experiments on the MNIST
and synthetic GRID datasets. Our results show
that the proposed method successfully generates con-
sistent standardized view reconstructions, achieving
626
Toida, K., Kato, N., Segawa, O., Nakamura, T. and Hotta, K.
Homography VAE: Automatic Bird’s Eye View Image Reconstruction from Multi-Perspective Views.
DOI: 10.5220/0013244800003912
Paper published under CC license (CC BY-NC-ND 4.0)
In Proceedings of the 20th International Joint Conference on Computer Vision, Imaging and Computer Graphics Theory and Applications (VISIGRAPP 2025) - Volume 3: VISAPP, pages
626-632
ISBN: 978-989-758-728-3; ISSN: 2184-4321
Proceedings Copyright © 2025 by SCITEPRESS – Science and Technology Publications, Lda.

higher pairwise cosine similarity and lower L2 dis-
tance compared to input and transformed views. Fur-
thermore, the significant reduction in PCA compo-
nents indicates the model’s ability to learn compact
and consistent representations.
This paper is organized as follows. Section 2 re-
views related works in variational autoencoders and
Homography estimation. Section 3 describes the de-
tails of our proposed method. Section 4 presents ex-
perimental results and analysis. Finally, Section 5
concludes our paper.
2 RELATED WORKS
The research related to our work involves vari-
ational autoencoders, transformation-aware autoen-
coders, and deep learning-based Homography esti-
mation. VAE(Kingma and Welling, 2014) combines
variational inference with deep neural networks to
learn latent representations of data. This framework
has been widely adopted for various image genera-
tion and reconstruction tasks. β-VAE(Higgins et al.,
2017) extends this framework by introducing a hy-
perparameter to control the capacity of the latent bot-
tleneck. In the context of transformation-aware ar-
chitectures, Affine VAE(Bidart and Wong, 2019) in-
corporates affine transformation awareness into the
VAE framework, demonstrating improved generaliza-
tion and robustness to distribution shifts. Similarly,
Spatial Transformer Networks(Jaderberg et al., 2015)
introduced a differentiable module for spatial trans-
formations within neural networks though not specif-
ically in a VAE context.
In the field of Homography estimation, deep learn-
ing approaches have shown promising results. Deep
Image Homography Estimation(DeTone et al., 2016)
demonstrated the first successful application of deep
learning to direct Homography parameter estimation
from image pairs. This approach was extended to dy-
namic scenes(Le et al., 2020), incorporating temporal
consistency. Self-supervised approaches(Wang et al.,
2019) have further eliminated the need for manual an-
notations in Homography estimation.
However, these existing approaches have sev-
eral limitations. Deep learning-based methods typi-
cally require ground truth Homography matrices for
training, which are often costly to obtain. Further-
more, while various methods have been proposed
for Homography estimation or image transformation,
none have specifically addressed the challenge of re-
constructing standardized view images from multi-
viewpoint datasets without explicit supervision. Our
proposed Homography VAE addresses these lim-
itations by incorporating Homography transforma-
tion into the VAE framework, enabling unsupervised
learning of viewpoint transformations.
3 PROPOSED METHOD
We propose Homography VAE, a novel architecture
that combines VAE with Homography transforma-
tion to enable standardized view image reconstruc-
tion from multi-viewpoint images. As shown in Fig-
ure 1, our method consists of three main components:
an encoder for latent representation, a Homography
transformation module, and a decoder for image re-
construction.
3.1 Model Architecture
3.1.1 Image Encoder
Let x ∈ R
H×W ×C
be an input image captured from an
arbitrary viewpoint, where H, W , and C denote the
height, width, and number of channels respectively.
The encoder E(·) maps x to a latent representation z.
z = E(x) (1)
The latent space z is designed to contain both im-
age feature information and Homography parameters.
Specifically, we partition z into two parts.
z = [z
f eat
, z
homo
] (2)
where z
f eat
∈ R
d
represents d-dimensional image fea-
tures and z
homo
∈ R
8
contains the information for
computing the Homography transformation matrix
H ∈ R
3×3
.
3.1.2 Homography Transformation Module
From z
homo
, we compute the Homography transfor-
mation matrix H that represents the viewpoint trans-
formation from the standard coordinate system to the
input image’s perspective. A Homography transfor-
mation can be represented by a 3 × 3 matrix.
H =
h
11
h
12
h
13
h
21
h
22
h
23
h
31
h
32
h
33
(3)
where h
33
is typically set to 1 as the matrix is defined
up to a scale factor. The standard coordinates C
std
are
defined as a regular grid in normalized coordinates.
C
std
:= {x ∈ R
3×h×w
| − 1 ≤ x ≤ 1} (4)
For a point in homogeneous coordinates p =
(x, y, 1)
⊤
, the transformation is computed by Equa-
tion 5.
p
′
= H p = (x
′
, y
′
, w
′
)
⊤
(5)
Homography VAE: Automatic Bird’s Eye View Image Reconstruction from Multi-Perspective Views
627
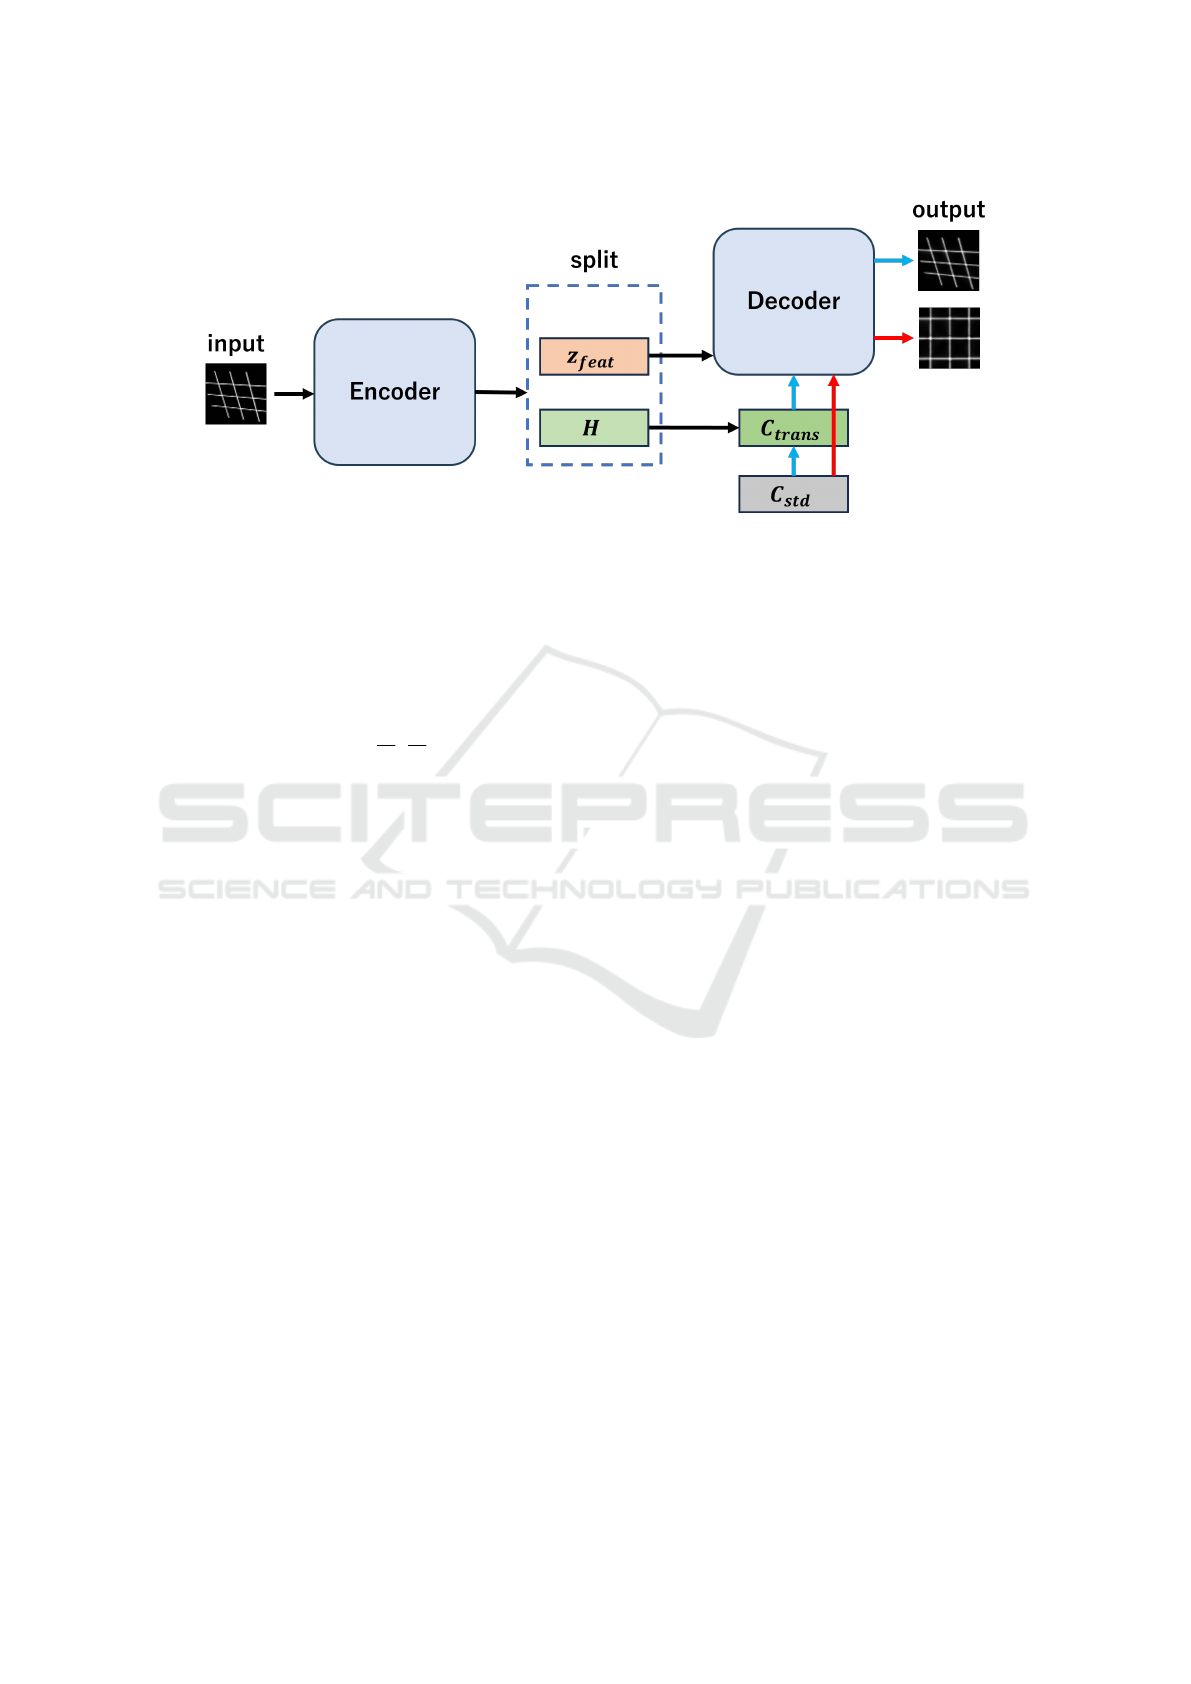
Figure 1: Overview of Homography VAE architecture. The encoder maps input images to a latent representation that is
split into feature and transformation components. The decoder employs a dual-branch strategy: the first branch (blue arrow)
uses transformed coordinates C
trans
to reconstruct the input viewpoint, while the second branch (red arrow) uses standard
coordinates C
std
to generate the standardized view. Both branches share the same feature representation z
f eat
but use different
coordinate information.
The homogeneous coordinates are converted back
to Euclidean coordinates through perspective division
in Equation 6.
(x
′′
, y
′′
) = (
x
′
w
′
,
y
′
w
′
) (6)
Applying these transformations to all points in
C
std
, we obtain the transformed coordinates C
trans
.
C
trans
= H ·C
std
(7)
3.1.3 Decoder and Image Reconstruction
The decoder D(·) takes both the image features z
f eat
and coordinate information to reconstruct the image.
For reconstructing the input viewpoint image, we use
x
rec
= D(z
f eat
, C
trans
). (8)
To reconstruct the standardized view image, we
use the standard coordinates C
std
instead of the trans-
formed coordinates.
x
std
= D(z
f eat
, C
std
) (9)
This key feature allows our model to reconstruct stan-
dardized view images without explicit supervision of
the transformation parameters. The decoder learns
to associate the standard coordinate system with the
standardized view perspective through the training
process.
3.2 Training Objective
The model is trained using the standard VAE objec-
tive function with a reconstruction loss and KL diver-
gence term.
L(θ, φ; x, z) = E
q
φ
(z|x)
[log p
θ
(x|z)] − D
KL
(q
φ
(z|x)||p(z))
(10)
where q
φ
(z|x) and p
θ
(x|z) denote the encoder and de-
coder distributions respectively, with p(z) = N (0, 1).
Here, φ and θ are learnable parameters of the neural
networks. The encoder q
φ
(z|x) outputs parameters of
a Gaussian distribution N (µ
φ
(x), σ
2
φ
(x)), where µ
φ
(x)
and σ
2
φ
(x) are learned through the neural network.
The KL divergence term D
KL
measures the difference
between the encoder’s distribution and the prior dis-
tribution p(z).
The key advantage of our proposed method is that
it learns to estimate Homography transformations in
an unsupervised manner while simultaneously encod-
ing image features in the latent space. By decom-
posing the latent representation into feature and trans-
formation components, the model can reconstruct im-
ages from both the input and standardized view using
a single framework. This unified approach enables
viewpoint transformation without requiring ground
truth Homography matrices during training.
4 EXPERIMENTS
4.1 Datasets
We evaluate our proposed method on two different
datasets. The first dataset is MNIST, which consists of
handwritten digits with a resolution of 28×28 pixels.
The second dataset comprises synthetically generated
GRID images with a resolution of 64×64 pixels con-
taining grid patterns. For both datasets, we apply
random Homography transformations to the original
images during training and testing to simulate multi-
viewpoint inputs.
VISAPP 2025 - 20th International Conference on Computer Vision Theory and Applications
628
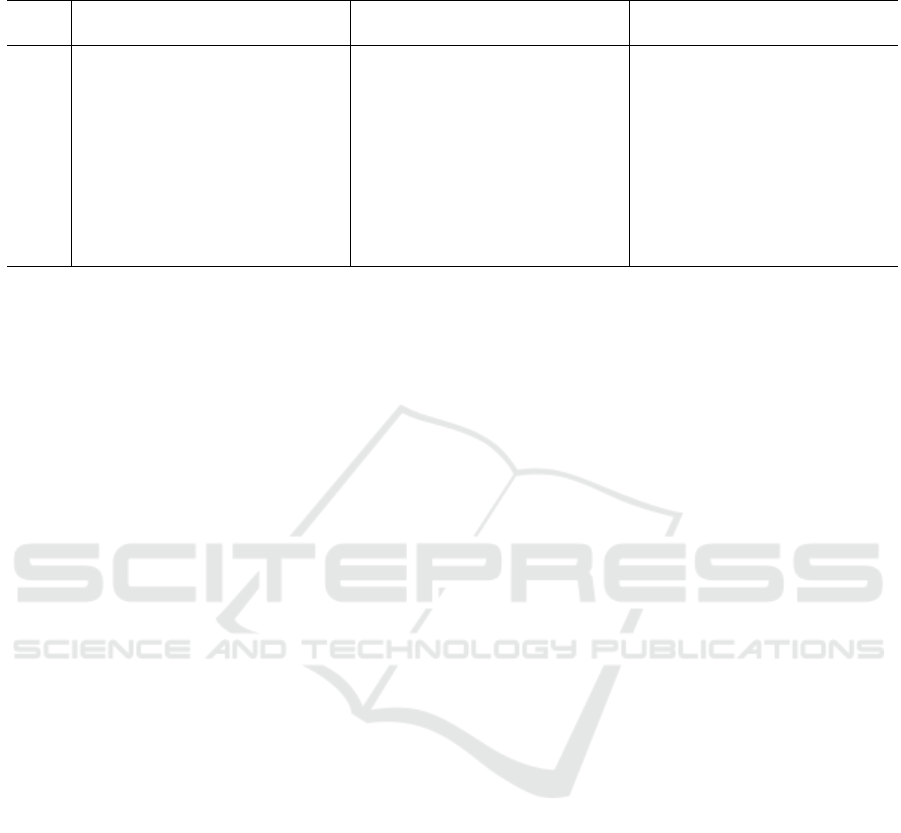
Table 1: Detailed evaluation results for each digit class in MNIST dataset. Mean ± std are shown for cosine similarity and L2
distance.
Class
Original Transformed Standardized
Cos.Sim. L2 Dist. PCA Cos.Sim. L2 Dist. PCA Cos.Sim. L2 Dist. PCA
0 0.31±0.14 13.49±1.75 185 0.38±0.16 11.75±1.94 59 0.69±0.15 8.86±2.20 26
1 0.22±0.20 9.44±1.62 154 0.25±0.22 8.34±1.68 47 0.75±0.13 4.96±1.47 23
2 0.30±0.13 12.58±1.59 207 0.39±0.16 10.25±1.77 65 0.62±0.13 8.68±1.86 39
3 0.29±0.14 12.25±1.57 205 0.38±0.16 9.76±1.68 68 0.62±0.14 8.15±1.74 38
4 0.30±0.13 11.36±1.46 202 0.39±0.16 8.97±1.54 61 0.65±0.13 6.92±1.49 35
5 0.27±0.12 11.91±1.52 203 0.37±0.14 9.38±1.59 65 0.58±0.15 7.79±1.68 35
6 0.32±0.14 12.11±1.60 188 0.41±0.16 10.19±1.78 62 0.65±0.15 8.17±1.91 32
7 0.26±0.15 11.22±1.56 187 0.32±0.17 9.44±1.67 56 0.64±0.16 7.14±1.72 31
8
0.35±0.13 12.21±1.56 210 0.46±0.16 9.58±1.77 69 0.69±0.10 7.33±1.64 40
9 0.31±0.14 11.35±1.45 194 0.39±0.16 9.39±1.52 68 0.66±0.13 7.42±1.56 33
4.2 Implementation Details
The encoder and decoder networks are implemented
using convolutional neural networks. We train our
model using the Adam optimizer with a learning rate
of 0.001. To stabilize the training, we employ cyclic
KL annealing (Fu et al., 2019) for mitigating KL col-
lapse and gradient clipping (Pascanu et al., 2013) with
a maximum norm of 1.0. During training and testing,
we randomly sample Homography transformation pa-
rameters within a predetermined range to generate di-
verse viewpoint variations. Specifically, we perturb
the four corner points of the input image with ran-
dom displacements to create the transformation ma-
trix. The input image is then warped using homogra-
phy transformation with the obtained transformation
matrix.
4.3 Evaluation Metrics
To quantitatively evaluate the effectiveness of our
model, we employ four metrics to assess the consis-
tency of the reconstructed images within each class.
First, we compute the mean pairwise cosine similar-
ity, measuring the average directional similarity be-
tween image pairs. Second, we calculate the mean
pairwise L2 distance to quantify pixel-level differ-
ences between images. Third, we analyze the num-
ber of principal components required to explain 95%
of the total variance in the PCA space, where fewer
components indicate more compact representations.
Finally, we evaluate the first principal component ra-
tio, which quantifies how much of the total variance
is captured by the most significant direction of varia-
tion. All metrics are computed separately for original,
transformed, and standardized images to enable com-
prehensive comparison.
4.4 Results and Analysis
Our experimental results on MNIST dataset demon-
strate that the standardized view reconstructions
achieve significantly higher consistency compared to
both original and transformed images, as shown in Ta-
ble 1 and 2. The comparison can be analyzed from
three perspectives. First, the cosine similarity met-
ric indicates that standardized view maintain higher
directional consistency across samples compared to
both original and transformed images. Second, the
lower L2 distance in standardized view suggests that
our model successfully reduces pixel-wise variations
while preserving essential image features. Third, the
analysis of PCA components reveals that standard-
ized view can be represented in a significantly lower-
dimensional space compared with original and trans-
formed images, indicating that our model success-
fully learns to generate consistent standardized view
reconstructions.
Notably, this improvement in consistency is ob-
served across all digit classes in the MNIST dataset,
as detailed in Table 2. The standardized view con-
sistently show better performance in all metrics, with
particularly strong results for simpler digits such as
”1”. Even for more complex digits with higher inher-
ent variability, our model maintains improved consis-
tency while preserving the distinctive features of each
class.
Furthermore, we evaluated our model on the syn-
thetic GRID dataset, which contains more structured
patterns than MNIST. As shown in Table 3, the re-
sults on GRID images demonstrate even more pro-
nounced improvements in the standardized view re-
constructions. While the performance on MNIST is
relatively lower compared to GRID dataset, this is
primarily because the MNIST model needs to han-
dle multiple digit classes simultaneously. This re-
quires the model to learn class-specific features along
with viewpoint transformations. In contrast, GRID
Homography VAE: Automatic Bird’s Eye View Image Reconstruction from Multi-Perspective Views
629
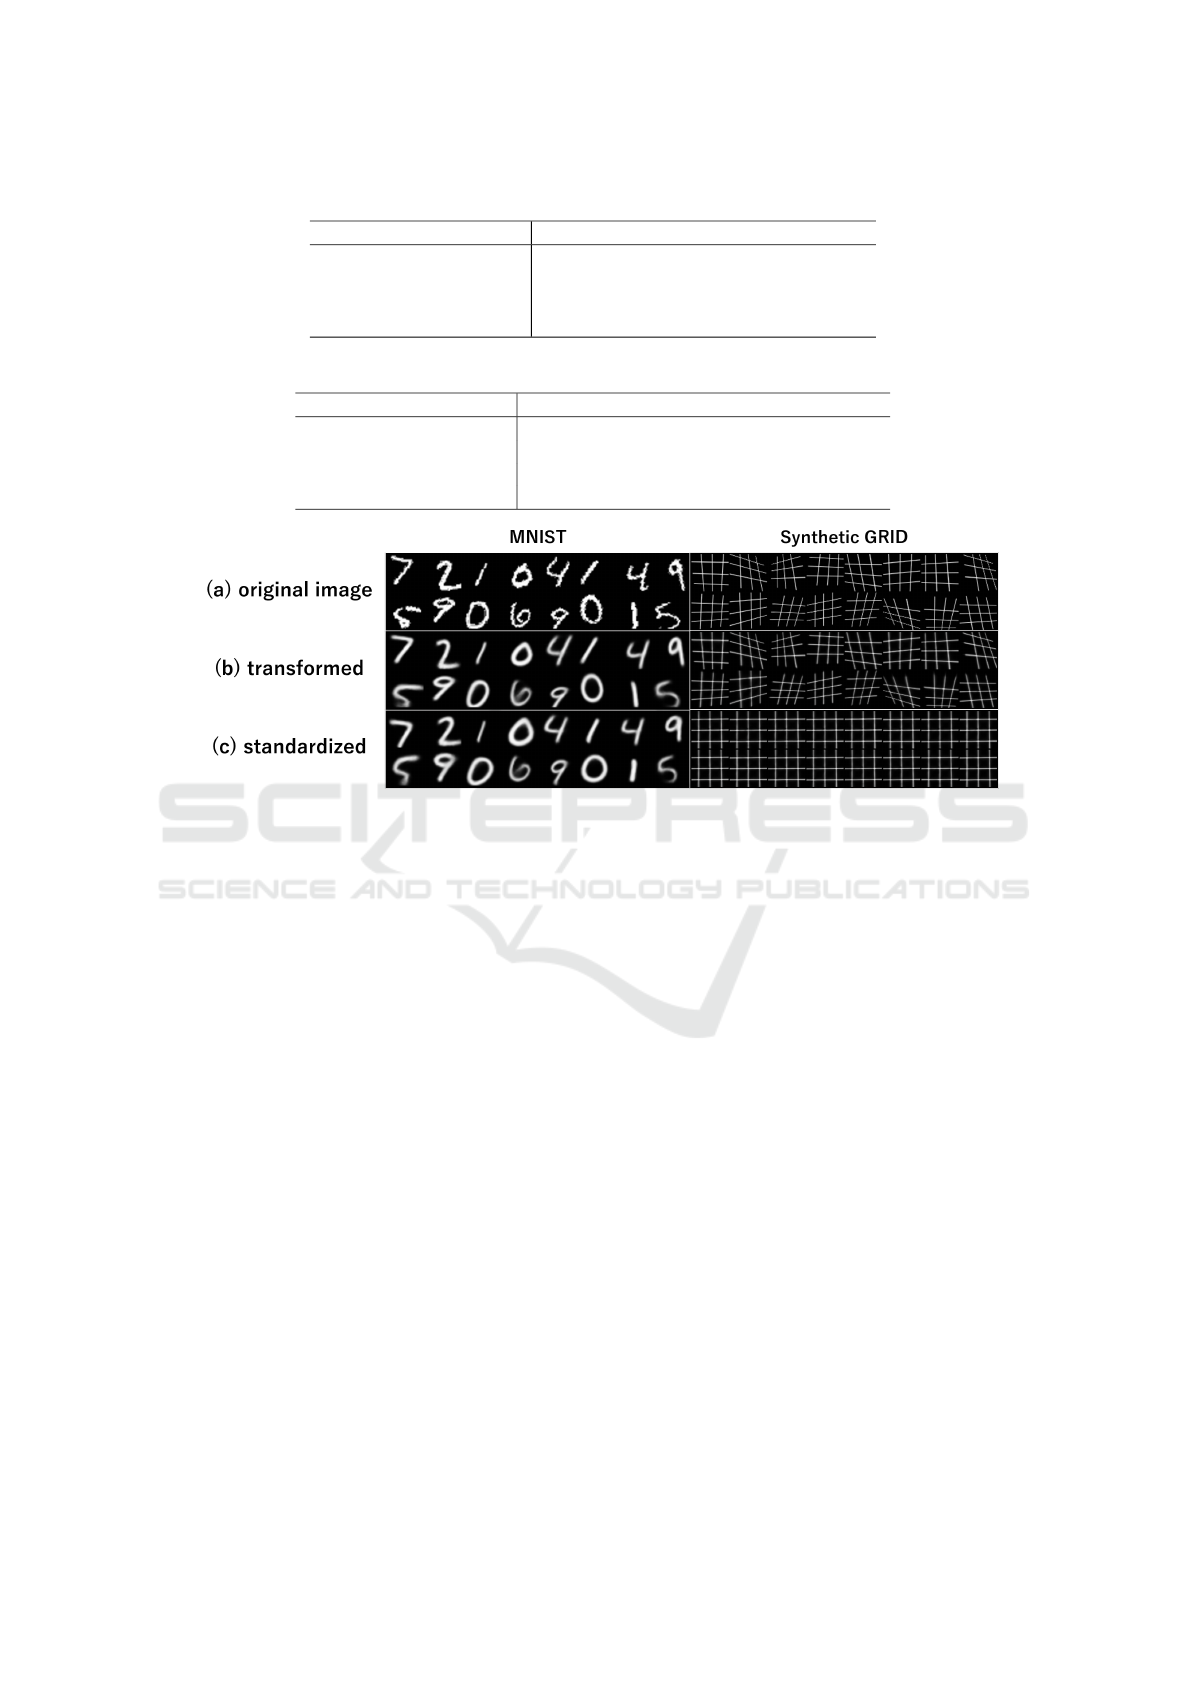
Table 2: Comparison of average metrics across different reconstruction types on MNIST dataset.
Metric Original Transformed Standardized
Cosine Similarity ↑ 0.29 0.37 0.66
L2 Distance ↓ 11.79 9.70 7.54
PCA Components ↓ 193.50 62.00 33.20
First Component Ratio ↑ 0.11 0.15 0.22
Table 3: Comparison of average metrics across different reconstruction types on GRID dataset.
Metric Original Transformed Standardized
Cosine Similarity ↑ 0.15±0.05 0.24±0.06 0.92±0.09
L2 Distance ↓ 19.86±1.05 16.53±1.10 5.78±2.99
PCA Components ↓ 167 156 7
First Component Ratio ↑ 0.03 0.04 0.71
Figure 2: Qualitative results of image reconstruction. For each dataset, we show (a) original input images with various
viewpoint transformations, (b) transformed view reconstructions that preserve the input perspective, and (c) standardized
view reconstructions that consistently align to a frontal viewpoint regardless of input variations. Left column shows the
results on MNIST dataset. Right column shows the results on GRID dataset. Our model successfully generates consistent
standardized view while maintaining the structural integrity of the patterns.
dataset contains only single-class patterns, allowing
the model to focus solely on learning viewpoint trans-
formations. Particularly notable is the dramatic re-
duction in required PCA components, indicating that
our model achieves remarkably consistent standard-
ized view reconstructions for structured grid patterns.
The high cosine similarity and low L2 distance of
standardized view further support this finding.
The qualitative results shown in Figure 2 demon-
strate our model’s ability to generate visually consis-
tent reconstructions. Although the transformed views
accurately preserve the perspective of input images,
the standardized view exhibit consistent frontal rep-
resentations regardless of the input viewpoint. Fig-
ure 3 shows the reconstruction results specifically
for MNIST digit ”4”. Despite its relatively complex
structure, our model successfully generates consis-
tent standardized view while preserving the features
of this digit class.
The consistency of these reconstructions is quan-
titatively validated through pairwise cosine similarity
analysis. Figure 4 visualizes the similarity matrices
computed for digit ”4”, where brighter colors indi-
cate higher similarity values. These matrices show
notably higher and more uniform similarity values
in standardized view compared to both original and
transformed views, as indicated by the consistently
brighter colors.
These results validate that our Homography VAE
successfully learns to generate consistent standard-
ized view representations without explicit supervision
of transformation parameters.
5 CONCLUSIONS
In this paper, we presented Homography VAE, a novel
unsupervised framework for standardized view image
reconstruction from multi-viewpoint input. Our main
contributions include a novel architecture that incor-
porates Homography transformation into the VAE
framework through coordinate transformation, en-
abling unsupervised learning of viewpoint transfor-
mations. We demonstrated that decomposing the la-
tent space into feature and transformation compo-
VISAPP 2025 - 20th International Conference on Computer Vision Theory and Applications
630
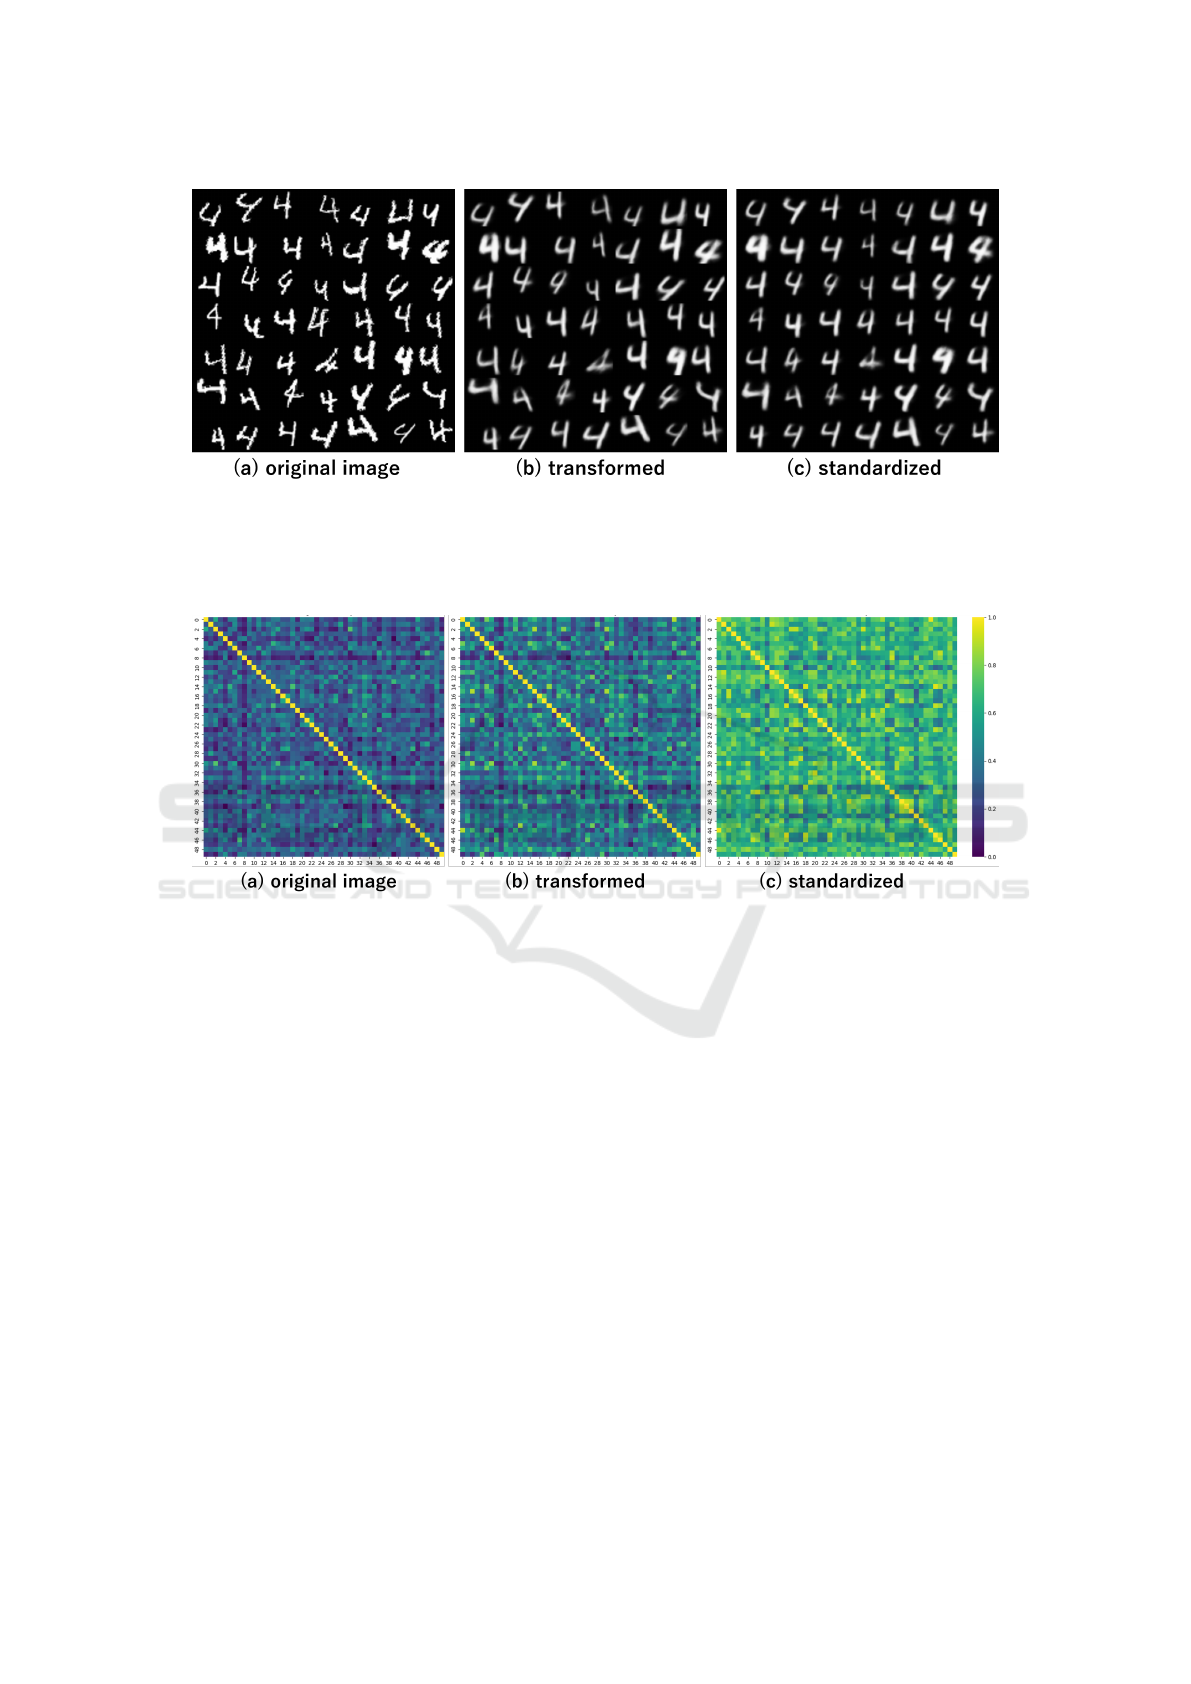
Figure 3: Reconstruction results for MNIST digit ”4”. Given original input images with various viewpoint transformations
(a), our model generates two types of reconstructions. (b) are transformed view reconstructions that preserve the original
perspective of each input. (c) are standardized view reconstructions that align all outputs to a consistent frontal viewpoint.
The results (c) demonstrate that our model successfully handles complex digit structures while maintaining consistent stan-
dardization of viewpoint.
Figure 4: Visualization of pairwise cosine similarity matrices computed from 50 samples within the same class. Results
shown are from MNIST digit ”4”. For each type of images ((a) original, (b) transformed reconstructions, and (c) standardized
reconstructions), we compute the cosine similarity between all pairs of images. The color intensity represents the similarity
value, where brighter colors indicate higher similarity. The more uniform and brighter patterns in (c) demonstrate that stan-
dardized reconstructions achieve consistently higher similarity across all pairs, validating the effectiveness of our approach in
generating consistent representations.
nents allows for effective generation of both input
and standardized view using a single framework. Fur-
thermore, experimental results show that our method
achieves significantly higher consistency in standard-
ized view reconstruction compared to input and trans-
formed views, without requiring ground truth Ho-
mography matrices.
For future work, extending our method to handle
real-world scenes with multiple objects, varying light-
ing conditions, and higher resolution images would
enhance its practical applications. Additionally, in-
vestigating more complex geometric transformations
beyond Homography would further expand the capa-
bility of our framework.
REFERENCES
Bidart, R. and Wong, A. (2019). Affine variational autoen-
coders. In Image Analysis and Recognition: 16th In-
ternational Conference, ICIAR 2019, Waterloo, ON,
Canada, August 27–29, 2019, Proceedings, Part I 16,
pages 461–472. Springer.
DeTone, D., Malisiewicz, T., and Rabinovich, A.
(2016). Deep image homography estimation. ArXiv,
abs/1606.03798.
Fu, H., Li, C., Liu, X., Gao, J., Celikyilmaz, A., and Carin,
L. (2019). Cyclical annealing schedule: A simple ap-
proach to mitigating KL vanishing. In Burstein, J.,
Doran, C., and Solorio, T., editors, Proceedings of
the 2019 Conference of the North American Chap-
ter of the Association for Computational Linguistics:
Human Language Technologies, Volume 1 (Long and
Homography VAE: Automatic Bird’s Eye View Image Reconstruction from Multi-Perspective Views
631

Short Papers), pages 240–250, Minneapolis, Min-
nesota. Association for Computational Linguistics.
Higgins, I., Matthey, L., Pal, A., Burgess, C. P., Glorot,
X., Botvinick, M. M., Mohamed, S., and Lerchner, A.
(2017). beta-vae: Learning basic visual concepts with
a constrained variational framework. ICLR (Poster),
3.
Jaderberg, M., Simonyan, K., Zisserman, A., et al. (2015).
Spatial transformer networks. Advances in neural in-
formation processing systems, 28.
Kingma, D. P. and Welling, M. (2014). Auto-Encoding
Variational Bayes. In 2nd International Conference
on Learning Representations, ICLR 2014, Banff, AB,
Canada, April 14-16, 2014, Conference Track Pro-
ceedings.
Le, H., Liu, F., Zhang, S., and Agarwala, A. (2020). Deep
homography estimation for dynamic scenes. In Pro-
ceedings of the IEEE/CVF conference on computer vi-
sion and pattern recognition, pages 7652–7661.
Pascanu, R., Mikolov, T., and Bengio, Y. (2013). On the dif-
ficulty of training recurrent neural networks. In Das-
gupta, S. and McAllester, D., editors, Proceedings of
the 30th International Conference on Machine Learn-
ing, volume 28 of Proceedings of Machine Learning
Research, pages 1310–1318, Atlanta, Georgia, USA.
PMLR.
Wang, C., Wang, X., Bai, X., Liu, Y., and Zhou, J. (2019).
Self-supervised deep homography estimation with in-
vertibility constraints. Pattern Recognition Letters,
128:355–360.
VISAPP 2025 - 20th International Conference on Computer Vision Theory and Applications
632
