
Microstructure, Extinction Coefficient, and Chlorophyll Content of
Philippine Bamboo Leaves by a Portable TD-OCT Scanner
Jumar Cadondon
1,2,3 a
, Edgar Vallar
1 b
, Maria Cecilia Galvez
1 c
and Tatsuo Shiina
3 d
1
Department of Physics, College of Science, De La Salle University, 1004 Taft Avenue, Manila 0922, Philippines
2
Division of Physical Sciences and Mathematics, College of Arts and Sciences-Miagao Campus, Miagao 5023,
Iloilo, Philippines
3
Graduate School of Engineering, Chiba University, Yayoi-cho, Chiba 263-8522, Japan
Keywords: Philippine Bamboo, Extinction Coefficient, Microstructure, Chlorophyll, TD-OCT.
Abstract: Bamboo is one of the most utilized non-timber forest products in the Philippines. Common bamboo leaf
infections are caused by sunlight, and nutrient deficiency. In this study, we have developed a portable time
domain-optical coherence tomography (TD-OCT) to study in vivo leaf microstructure changes in Philippine
bamboo (Bambusa spinosa). TD-OCT analysis shows unique features among different layers of the leaves
specifically on the epidermis and palisade layers when the unhealthy part is compared to the healthy part.
Extinction coefficient from the A-scan analysis showed significant difference from unhealthy part (1.03 ±
0.20 mm
-1
, N =12, p<0.05) and healthy part (0.72 ± 0.27 mm
-1
, N =12, p<0.05). In addition, RGB data was
compared for both unhealthy and healthy part of the bamboo leaves. A red shift is observed from the unhealthy
part of the leaves. It is also observed by a decrease of 60% in chlorophyll-a content of the unhealthy part as
compared to the healthy part. Same inverse correlation is also observed when the extinction coefficient is
compared with the chlorophyll content.
1 INTRODUCTION
Bamboo is a diverse group of perennials with emerging
use in food, handicrafts, chemical products, and
building materials (Cheng et al., 2023). The
microstructure of leaves is crucial in the overall
development of plants. Leaf growth depends on its
photosynthetic ability and leaf phenology. Visual
inspection shows unhealthy and healthy structure
within the leaves. Furthermore, the loss of the
photosynthetic ability of the plant is due to
environmental factors such as temperature, humidity,
nutrition, and oxidative stress (Liu et al., 2022). Several
methods have been introduced in leaf growth dynamics
and early detection of leaf diseases. Such inspection are
subjective, inefficient, time-consuming methods in
early detection of leaf diseases. Understanding such
relation between chlorophyll concentration and its
microstructures has not been further studied.
a
https://orcid.org/0000-0002-3933-0598
b
https://orcid.org/0000-0001-8236-7102
c
https://orcid.org/0000-0001-5505-1778
d
https://orcid.org/0000-0001-9292-4523
Traditional methods using biomedical techniques
have been commonly used to study photosyntheitc
ability in plants such as chlrophyll content, protein,
lipids, and fats (Cao et al., 2013). However, these
studies mostly focus on the cell components. In vivo
technique using microstructural patterns have been a
growing research on the leaf plant development.
Changes in the leaf microstructures are mostly
associated with its photosynthetic ability. Imaging
techniques such as scanning electron microscopy
(SEM), transmission electron microscopy (TEM)
(Wang et al., 2014; Yao et al., 2017), confocal and
fluorescence microscopy (Zhao et al., 2016) and
spectroscopic methods (Butler et al., 2015; Ivanova
and Singh, 2003) can provided cellular, molecular
data, however, are limited by penetration depth which
requires plant sectioning.
Optical coherence tomography (OCT), is a non-
invasive technique that can provide high-speed cross-
114
Cadondon, J., Vallar, E., Galvez, M. C. and Shiina, T.
Microstructure, Extinction Coefficient, and Chlorophyll Content of Philippine Bamboo Leaves by a Portable TD-OCT Scanner.
DOI: 10.5220/0013244900003902
In Proceedings of the 13th International Conference on Photonics, Optics and Laser Technology (PHOTOPTICS 2025), pages 114-119
ISBN: 978-989-758-736-8; ISSN: 2184-4364
Copyright © 2025 by Paper published under CC license (CC BY-NC-ND 4.0)
sectional imaging with micrometer resolution in
highly scattering samples. OCT has been widely used
for retinal imaging, dermatology, forensic studies
(Popescu, 2014; Meglinski et al., 2010). There are
increasing trends in using OCT in biomedical
applications in plant biology and agriculture (Goto et
al., 2023). In this study, we have developed a time
domain- OCT (TD-OCT) that shows deeper
penetration in leaves. In this study, TD-OCT has
been used to obtain cross-sectional images of
Bambusa sp. leaves to illustrate microstructural
differences in healthy and unhealthy part due to
environmental factors. Moreover, the extinction
coefficient measured from A-scan analysis was
compared for both healthy and unhealthy parts of the
bamboo leaves. The chlorophyll-a content was also
studied using absorbance spectroscopy. Correlation
between the exiction coefficient and chlrolophyll-a
content has been observed using the developed TD-
OCT. This is the first reported study on the use of TD-
OCT imaging in elucidating microstructural changes
in leaves which can be furthered explored for
agricultural growth and development.
2 TD-OCT DEVELOPMENT
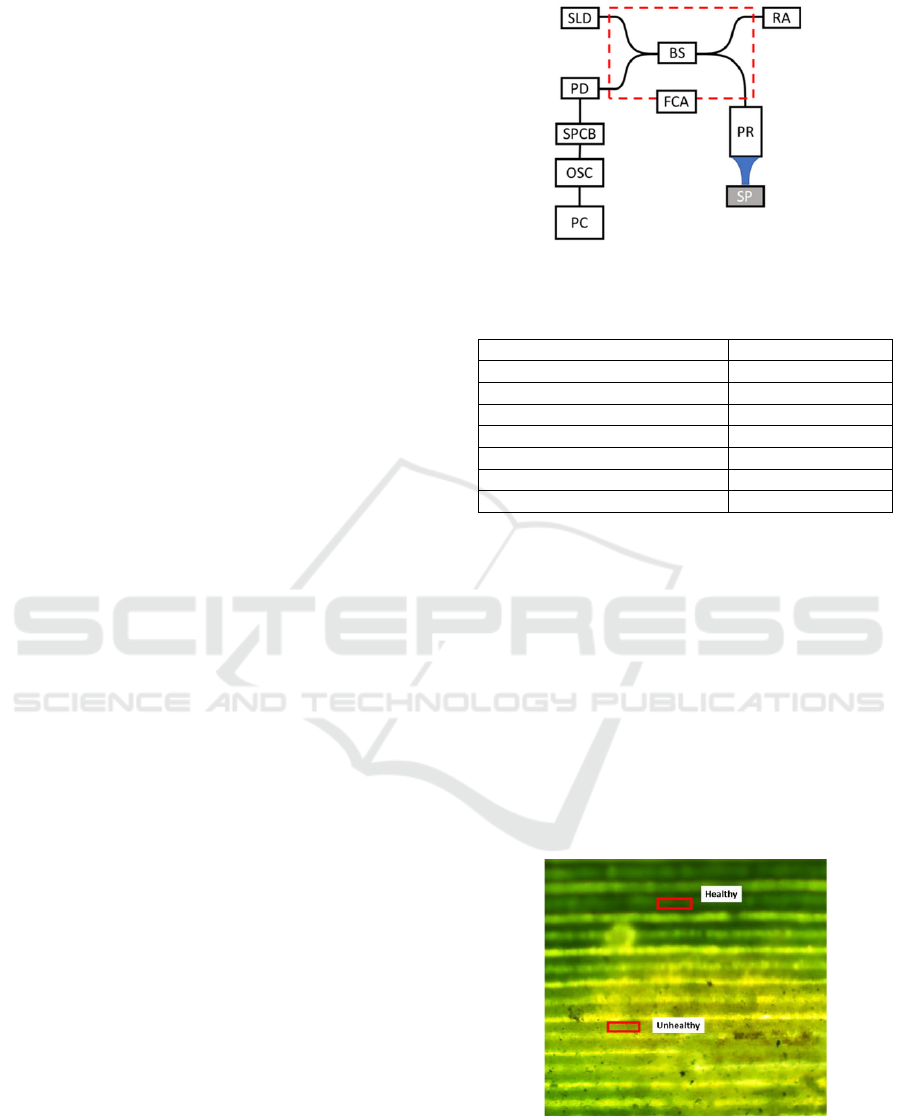
Our TD-OCT is based on the Michelson
interferometer as shown in Fig 1. Our OCT has
dimensions of 10 in. by 8 in. 5 in., which can be easily
used for in-situ plant monitoring. A rotating
retroreflector is designed using a reference arm (RA)
instead of moving in translation motion. It has more
scanning range which can be easily adjusted by
changing the retroreflector’s radius. A 1310 nm SLD
(Anritsu Co. Ltd., Kanagawa, Japan) with a spectral
width of 56 nm and average axial resolution of 14.2
μm in air was used (Shiina et al., 2003). It is
constructed to evaluate the microstructural changes of
the plant by acquiring A-scans as point measurement.
Table 1 shows the specifications of the developed
TD-OCT (Galvez et al., 2023). In this system, the
probe is designed to be small and can be position
easily on the surface of the leaves.
It includes super luminescent diode (SLD),
photodiode (PD), signal processing circuit board
(SPCB), oscilloscope (Osc), personal computer (PC),
beam splitter (BS), reference arm (RA), probe (PR),
sample (SP), and fiber coupler assembly (FCA).
Figure 1: The schematic diagram of the TD-OCT system.
Table 1: Specifications of the TD-OCT system.
Specification
Value
Center wavelength
1310 nm
Spectral width
56 nm
Axial resolution
14.2 μm
Lateral resolution, spot size
6 μm
Numerical aperture
0.14
Scanning rate
25 scans/s
Scanning depth in air
12-14 mm
2.1 Bamboo Collection
Bamboo has disadvantages like pest and fungal
susceptibility due to its small morphological
structure. It has also low survival rate for
micropropagation. On the other hand, growing
bamboo has the ability to mitigate flood and soil
erosion (DOST PCAARD, n.d.). The OCT
measurement was conducted using Philippine
bamboo collected from the Philippines’ Department
of Agriculture. Twenty-five (25) bamboo leaves were
collected based on visual inspection showing both
healthy and unhealthy part (Fig. 2).
Figure 2: The bamboo leaf (top view) collected with the
healthy and unhealthy part.
Microstructure, Extinction Coefficient, and Chlorophyll Content of Philippine Bamboo Leaves by a Portable TD-OCT Scanner
115

2.2 Microstructural Imaging, and
Extinction Coefficient
In this work, all bamboo leaves were imaged on
adaxial surface. The photographs (Fig. 2) emphasize
the topographical and color changes. Leaves are
multilayered structures which varies in absorption
coefficients in different layers. Hence, A-scan and B-
scan analysis was performed to obtain a detailed
microstructural information from the TD-OCT
images. A-scan is defined for depth scan which is also
related to longitudinal scan; while B-scan is referred
to the transverse sections. The thickness between two
layers of a leaf can be defined between corresponding
distance between the A-scan profile. With the
successive A-scan analysis, a 2D-cross sectional
image is created, called the B-scan.
Using the microstructural information collected,
these can be quantified in terms of intensity by
measuring the extinction coefficient. The extinction
coefficient is an intrinsic optical property of tissues
that is highly correlated with the TD-OCT signals. It
is defined as the amount of light scatter and
absorption per unit distance as light travels into the
plant tissue.
2.3 RGB Image and Chlorophyll-a
Measurement
An Olympus microscope with a high-resolution
camera attached was used to analyse the adaxial
information (Fig. 2) and RGB images. To measure
specific frequency distribution of the RGB intensity,
a region of interest (ROI) was chosen. This is also
designated as the region where OCT imaging was
conducted. In Fig. 2, the red rectangle represents the
ROI. The difference in the RGB frequency was
recorded for both healthy and unhealthy part of the
bamboo leaves.
Microstructural and morphological changes are
accompanied by the changes in the chlorophyll
content of the leaves. Thus, we also measured the
chlorophyll-a concentration by measuring the optical
density (OD) of the leaves at 680 nm (Cadondon et
al., 2023) and the estimated chlorophyll-a
concentration based on Sartory and Grobbelaar
(1984) as shown below.
Chl − a =
[
26.73
(
665a − 663b
)]
EF
VL
(1)
A detailed methodology is presented previously
(Cadondon et al., 2022). The optical density was
measured at 750 nm, 663 nm, and 630 nm
wavelengths. In the equation above, 665a is the
turbidity corrected absorbance at 665 nm, and 663b is
the turbidity corrected absorbance at 663 nm after
acidification, F is the dilution factor, E is the volume
of the solved used for the extraction (mL), V is the
volume of the filtered sample (mL), and L is the path
length (cm). Unsaturated samples are given with a
dilution factor of 1. On the other hand, dilution factor
of saturated samples is dependent on the number of
times the samples are diluted. In this case, the volume
of the solvent also increases.
2.4 Statistical Treatments
Using Pearson’s R correlation, the estimated
chlorophyll-a concentrations of the bamboo leaves
were correlated with the extinction coefficient
measured from the OCT signals.
3 MICROSTRUCTURE
ANALYSIS OF BAMBOO
LEAVES
Figure 3 (a) and (b) shows the microstructural
changes of the bamboo leaves on OCT images.
Corrections were made by subtracting the
background light, focal length correction, distance
squared correction, and logarithmic analysis to
obtained the B-scan signals. The broadening of the
second order peak in the unhealthy part of the leaves
is highly observed. This implies that the upper dermis
and palisade layers merged to form a thick layer. The
increase in the thickness and the changes in the
epidermis and palisade layers can be used to explain
the environmental factors affecting the color change
in the bamboo leaves. Hence, it is very useful to
identify microstructural changes on the leaves using
OCT images to further understand its morphological
changes.
This can be further verified by determining the
frequency distribution of the RGB color in the leaves.
Fig. 4 (a) and (b) provides the intensity-frequency
distribution of the RGB image of the healthy and
unhealthy part of the bamboo leaves. The x-axis is the
intensity and the y-axis is the frequency distribution
of the color.
PHOTOPTICS 2025 - 13th International Conference on Photonics, Optics and Laser Technology
116
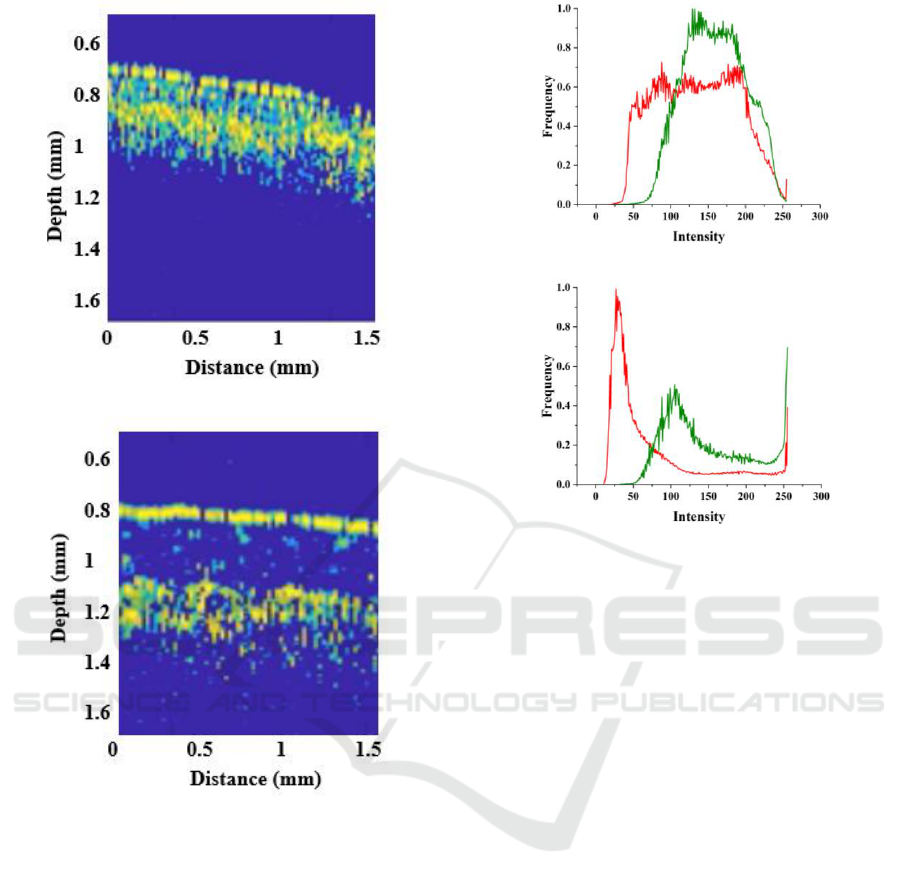
(a) Healthy part
(b) Unhealthy part
Figure 3: The OCT images of the bamboo leaves collected
with the healthy and unhealthy part.
The same intensity and frequency distribution is
observed in a healthy part of the bamboo leaves as
shown in Fig. 4(a). A decrease in the intensity profile
is observed in the unhealthy part of the bamboo
leaves. A shift in the red profile is also observed (Fig
4(b) (Li et al., 2012). This means that the absorption
of the bamboo leaves changes as the microstructure
changes (Zhang et al., 2022).
(a) Healthy
(b) Unhealthy
Figure 4: Normalized Intensity-Frequency profile of the
RGB of healthy and unhealthy part of the bamboo leaves.
4 EXTINCTION COEFFICIENT,
AND CHLOROPHYLL
CONTENT
As discussed, extinction coefficient is important to
quantitatively measure the microstructural changes in
terms of intensity. Figure 5 shows the extinction
coefficient estimated by OCT images. From the A-
scan measured, a lineal fitting model was structured
to obtain the slope of the extinction coefficient of
each. The calculated mean extinction coefficients ±
standard deviation for healthy and unhealthy part are:
0.72 ± 0.27 mm
-1
, and 1.03 ± 0.23 mm
-1
, respectively.
Our results statistically show that lower extinction
coefficient is observed for the healthy part as
compared to the unhealthy part. This explains the
broadening of first layer and the second layer with the
merging of the epidermis and the palisade layer
(Anna et al., 2018). The microstructural changes in
the upper dermis provides information on the
adapting ability to environmental factors.
Microstructure, Extinction Coefficient, and Chlorophyll Content of Philippine Bamboo Leaves by a Portable TD-OCT Scanner
117
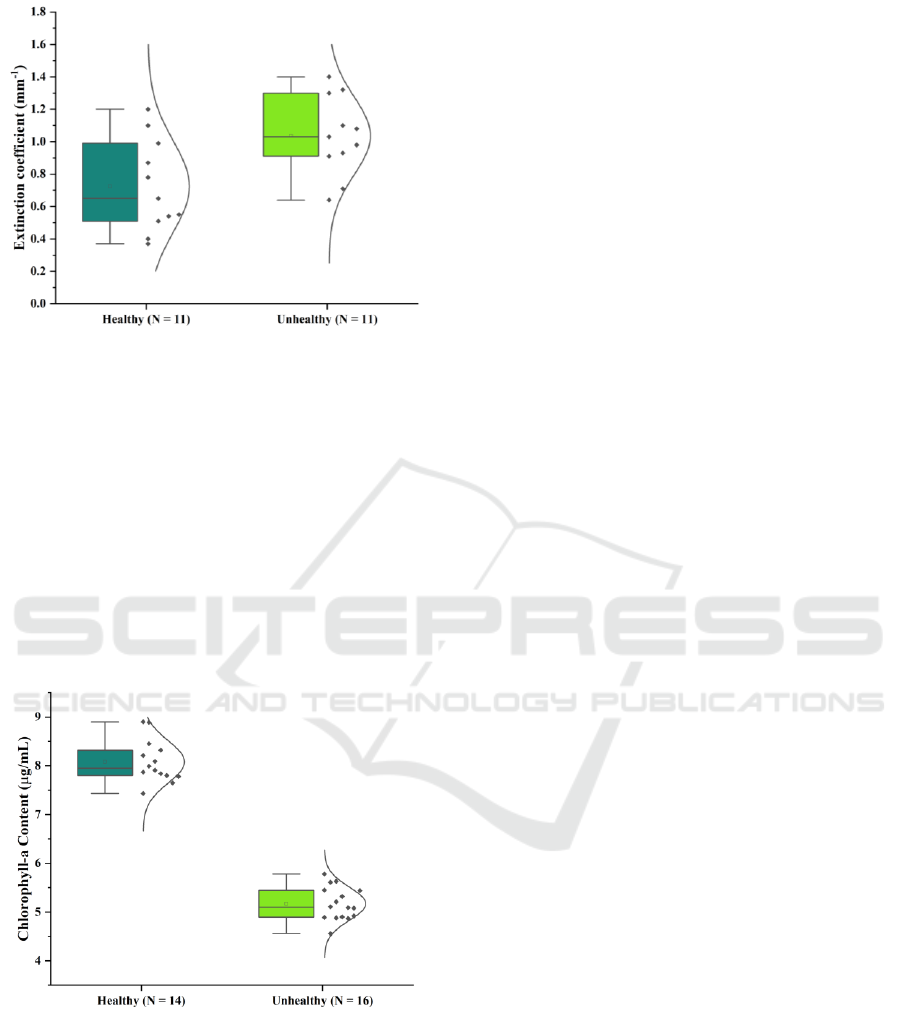
Figure 5: Mean extinction coefficient of the bamboo leaves.
To confirm the changes in the intensity and
frequency distribution from the RGB data along with
the morphological and microstructural changes in the
bamboo leaves, the chlorophyll-a content is measured
(Fig. 6). A significant decreased by 60 % was
observed from the unhealthy part of the bamboo
leaves when compared with the healthy part. These
findings show that the chlorophyll-a content varies on
the different parts of the leaves. This also confirms
that such decrease in affected by environmental
factors that lowers the ability of the plant to produce
its own chlorophyll.
Figure 6: Mean chlorophyll-a content of the bamboo leaves.
With the significant change, it can be observed
that there is an inverse correlation between the
extinction coefficient of bamboo leaves based on the
OCT image and the chlorophyll-a content (Inskeep
and Bloom, 1985). Visual inspection through
microscopy and cell analysis are commonly used in
understanding chlorophyll-a distribution in plants. In
this study, we were able to provide a different
approach in estimating chlorophyll-a distribution
using the estimated extinction coefficient from the
TD-OCT images. Our TD-OCT helps investigate in
the senescence of leaves without destroying the
structure of the plant.
5 CONCLUSIONS AND FUTURE
PLANS
We studied the microstructural changes of the healthy
and unhealthy part of the bamboo leaves using the
OCT images. Environmental factors such as sunlight,
nutrients, and oxygen deficiencies affect the
morphological structures and the ability of the leaves
to produce chlorophyll. A significant change in the
extinction coefficient of the unhealthy part as
compared to the healthy part. This means that the
penetration of the light is possible due to the change
in the color. This is verified by measuring the RGB
data from the same region of interest for both parts. It
can be observed that the intensity and frequency
distribution of red and green data are similar from the
healthy leaves; while a significant shift in the red
color is observed in the unhealthy part.
To understand the color changes, the chlorophyll-
a content is measured. A 60% decreased was
observed in the chlorophyll-a content from the
unhealthy to the healthy part of the bamboo leaves.
This supports the microstructural changes observed
by the OCT images. Overall, an inverse correlation
was observed between the extinction coefficient and
the chlorophyll-a content of the bamboo leaves. With
the on-going development of the portable TD-OCT
scanner, we plan to extend the understanding
microstructural changes associated with the
senescence of leaves using our system.
ACKNOWLEDGEMENTS
J. Cadondon acknowledges support through the
DOST ASTHRDP and Enrichment Program. This
research was funded by the Commission on Higher
Education (CHED) of the Philippine Government for
the project entitled “Development of a Portable
Optical Coherence Tomography System for the
Evaluation of Human Skin Analogues”.
PHOTOPTICS 2025 - 13th International Conference on Photonics, Optics and Laser Technology
118

REFERENCES
Anna, T., Chakraborty, S., Cheng, C-Y., Srivastava, V.,
Chiou, A., Kuo, W-C. (2019). Elucidation of
microstructural changes in leaves during senescence
using spectral domain optical coherence tomography.
Scientific Reports 9, 1167.
Butler, H.J., McAinsh, M.R., Adams, S., Marti, F.L. (2015).
Application of vibrational spectroscopy techniques to
non-destructively monitr plant health and development.
Analytical Methods 7, 4059-4070.
Cadondon, J., Lesidan, J.R., Bulan, J., Vallar, E., Shiina, T.,
Galvez, M.C. (2023). Algal Organic Matter
Fluorescence Analysis of Chlorella sp. for Biomass
Estimation. Engineering Proceedings 58(1), 80.
Cadondon, J.G., Ong, P.M. B., Vallar, E.A., Shiina, T.,
Galvez, M.C.D. (2022). Chlorophyll-a pigment
measurement of spirulina in algal growth monitoring
using portable pulsed LED fluorescence lidar system.
Sensors 22(8), 2940.
Cao, J. et al. (2016). Understanding studies on the natural
leaf senescence of Cinnamomum camphora. Scanning
35, 336-343.
Cheng, Y., Wan, S., Yao, S., et al. (2023). Bamboo leaf: A
review of traditional medicinal property,
phytochemistry, pharmacology, and purification
technology, J of Ethnopharmacology 306, 116166.
DOST PCAARD, n.d. Bamboo: Industry Strategic Science
and Technology Program, retrieved from
https://ispweb.pcaarrd.dost.gov.ph/bamboo/ (accessed
21 June 2024)
Galvez, M.C., Cadondon, J., Mandia, P., Macalalad, E.,
Vallar, E., Shiina, T. (2023). Characterization of
Porcine Skin Using a Portable Time-Domain Optical
Coherence Tomography System. Engineering
Proceedings 58(1), 89.
Goto, H., Lagrosas, N., Shiina, T. (2024). OCT Image
Analysis of Internal Changes in Leaves due to Ozone
Stresses. In Proceedings of the 12
th
International
Conference on Photonics, Optics and Laser Technology
– Volume 1: PHOTOPTICS; ISBN 978-989-758-686-6,
SciTePress, 65-71.
Inskeep, W., Bloom, P. (1985). Extinction coefficients of
chlorophll a and B in n,n-dimethylformamide and 80%
acetone. Plant Physiology 77(2), 483-5.
Ivanova, D. G., Singh, B.R. (2003). Nondestructive FTIR
monitoring of leaf senescence and elicitin-induced
changes in plant leaves. Biopolymers (Biospectroscopy)
72, 79-85.
Li, Y., Scales, N., Blankenship, R.E., Willows, R.D., Chen,
M. (2012). Extinction coefficient for red-shifted
chlorophylls: Chlorophyll d and chlorophyll f. BBA
Bioenergetics 1817(8), 1292-1298.
Liu, H., Xiao, C., Qiu, T., et al. (2023). Selenium Regulates
Antioxidant, Photosynthesis, and Cell Permeability in
Plants under Various Abiotic Stresses: A Review.
Plants, 12(1), 44.
Meglinski, I.V. Buranachai, C., Terry, L. A. (2010). Plant
photonics: application of optical coherence tomography
to monitor defects and rots in onion. Laser Physics
Letters 7, 307-310.
Popescu, D.P. et al. (2011). Optical coherence tomography:
fundamental principles, instrumental designs and
biomedical applications. Biophysical Review 3, 155-
169.
Shiina, T., Moritani, Y., Ito, M., Okamura, Y. (2003). Long
optical-path scanning mechanism for optical coherence
tomography. Applied Optics 42(19), 3795-3799.
Wang, S. et al., (2014). Maintenance of Chloroplast
Structure and Function by Overexpression of the Rice
Monogalactosyldiacylglycerol synthase Gene leads to
Enhance Salt Tolerance in Tobacco. Plant Physiology
165, 1144-1155.
Yao, X.Y., Liu, X.Y., Xu, Z.G., Jiao, X.L. (2017). Effects
of light intensity on leaf microstructure and growth of
rape seedlings cultivated under a combination of red
and blue LEDs. Journal of Integrative Agriculture 16,
97-105.
Zhang, H., Ge, Y., Xie, X., Atefi, A., Wijewardane, Thapa,
S. (2022). High throughput analysis of leaf chlorophyll
content in sorghum using RGB, hyperspectral, and
fluorescence imaging and sensor fusion. Plant Methods
18, 60.
Zhao, Y.R., Yu, K.Q., Li, X., He, Y. (2016). Detection of
Fungus Infection on Petals of Rapeseed (Brassica
napus L.) Using NIR Hyperspectral Imaging. Scientific
Reports 6, 38878.
Microstructure, Extinction Coefficient, and Chlorophyll Content of Philippine Bamboo Leaves by a Portable TD-OCT Scanner
119
