
A Two-Stage Approach for Wire Harness Cable Description Using 3D
Point Clouds for Robotic Manufacturing
Takumi Okuyama
1
, Pei-Chun Chien
2
, Hiroki Tsukida
2
,Yoichi Kato
3
and Jun Ohya
1
1
Department of Modern Mechanical Engineering, Waseda University, Tokyo, Japan
2
AI Digital Division, Yazaki Corporation, Tokyo, Japan
3
Global Center for Science and Engineering, Waseda University, Tokyo, Japan
Keywords:
Colored Point Cloud Registration, B-Spline, B
´
ezier Curve.
Abstract:
This paper proposes a two-stage methodology for accurately describing three-dimensional cable position aim-
ing to examine robot-based automated cable placement systems to work correctly in wire harness manufactur-
ing. The first stage is to extract 3D points on cables from point cloud acquired using a 3D stereo camera. For
extracting only the points on cables, we compare two sets of point clouds which are taken before laying cables
on an assembly board which holds the cables temporarily for taping and additional works, and after laying
cables. We propose a new method to eliminate unnecessary points such as points on the assembly board and
noises to get points only on cables from the two point cloud sets. In the second stage, cable positions are ap-
proximated as a mathematical function, B-Spline or B
´
ezier curve, by interpolating the extracted 3D points. We
use Smoothness, Curve Length, and Chamfer Distance as the evaluation criteria to assess the fitting quality to
the original cable geometry. Experiment results indicate that B-Spline provides smooth approximation, while
B
´
ezier curve can represent curve with rapid transition such as sharp bents. Measured Chamfer Distance is a
few times as large as the radius of the cables or shorter, demonstrating high fitting accuracy. This approach
offers a practical solution for cable recognition in automation contexts, with potential applications in automo-
tive and manufacturing industries.
1 INTRODUCTION
With the increasing use of electronic devices in au-
tomobiles, wire harnesses, which interconnect the
devices within an automobile, have become essen-
tial components. Traditionally, wire harnesses man-
ufacturing has been a highly labor-intensive process.
However, shortages of skilled workers, the demand
for high efficiency, and cost-saving pressures require
a new automated system for wire harness manufactur-
ing using robotics.
The manufacturing flow of wire harnesses consists
of designing the layout of wire harnesses, then rout-
ing the wire harnesses according to the layout, and
finally judging whether there are any abnormalities in
the wire harnesses.
Karlsson et al. presented an efficient solution to
automate the complex and time-consuming wire har-
ness design process within a customizable 3D envi-
ronment (Karlsson et al., 2024). Karlsson et al. en-
abled the automated generation of optimized wire har-
ness layouts, but did not deal with automatic routing
of wire harnesses.
Nguyen et al. proposed a novel vision-based rout-
ing method for 3D profile extraction of wire har-
nesses in a robotized assembly process, addressing
the complexities associated with deformable objects
like wire harnesses by integrating deep learning and
machine vision techniques (Nguyen and Yoon, 2021).
In Nguyen et al.’s study, the robot directly grasps and
manipulates the wire harnesses using a gripper and se-
cures them into clamps during the assembly process.
However, their system does not incorporate a process
to leverage the inherent flexibility of cables to repre-
sent their shape smoothly.
Nguyen et al. proposed a deep learning-based au-
tomated optical inspection (AOI) system for wiring
harness manufacturing, utilizing PointNet++ and syn-
thetic point cloud data generated from CAD models to
improve segmentation accuracy, address the domain
gap, and reduce dependence on extensive real-world
data collection (Nguyen et al., 2022). Nguyen et al.’s
study improved deep learning accuracy by leveraging
synthetic data for training. However, their system seg-
Okuyama, T., Chien, P.-C., Tsukida, H., Kato, Y. and Ohya, J.
A Two-Stage Approach for Wire Harness Cable Description Using 3D Point Clouds for Robotic Manufacturing.
DOI: 10.5220/0013246100003905
In Proceedings of the 14th International Conference on Pattern Recognition Applications and Methods (ICPRAM 2025), pages 689-695
ISBN: 978-989-758-730-6; ISSN: 2184-4313
Copyright © 2025 by Paper published under CC license (CC BY-NC-ND 4.0)
689

ments multiple cables as a single bundle, but did not
classify individual cables.
Nguyen et al. proposed a 3D vision-based method
for detecting multiple wire branches in robotized
wire harness assembly, utilizing Fixed Radius Near-
est Neighbor (FRNN) for wire color classification and
YOLO-v7 for terminal identification, enabling pre-
cise segmentation and automated handling of com-
plex wire structures (Nguyen et al., 2024). Nguyen
et al. utilized RGB-D camera color information to
classify multiple cables, but did not discuss handling
occlusions.
Chien et al. presented a study on classifying cable
tendency using semantic segmentation by leveraging
real and simulated RGB data to identify normal and
abnormal (tensioned, loose, twisted) cable configura-
tions, which is crucial for automating cable assembly
processes (Chien et al., 2024). However, Chien et al.
did not deal with 3D descriptions of routed cables.
These conventional studies enabled the design of
wire harnesses, automated robotic arrangement, or
anomaly detection. Therefore, we recognized that a
critical challenge in achieving full automation lies in
the ability to enable robots to identify the exact de-
scription of each cable in a 3D space.
Our approach to identify cable positions is as fol-
lows. First, using an inexpensive 3D stereo camera,
we capture the shape of a wire harness consisting of
multiple cables and connectors as point cloud. Then,
the exact place of each cable is described as a math-
ematical function by interpolating the points on a ca-
ble which are extracted from the captured point cloud.
Here, the challenges are to extract a set of 3D points
only on a cable from a captured point cloud which
includes points on other cables, connectors, assembly
board, background and a lot of noises, and to calculate
a set of parameters of the mathematical function out
of the dispersedly placed points. Note that there may
be unseen parts of a cable which are hidden behind
other cables.
For the first problem, we capture two sets of point
clouds; one is taken before laying cable on the as-
sembly board and the other is taken after that. By
evaluating the difference of the two, points only on
cables can be extracted. For the second problem, we
use B-spline and B
´
ezier curve functions and evaluate
the result. The accuracy of the approximation is eval-
uated using criteria of smoothness, curve length and
Chamfer Distances.
Experimental result shows that our approach
worked well and measured approximation accuracy
was a few times as large as the radius of the cables or
shorter.
2 RELATED WORK
2.1 Research on Cable Recognition
In the field of cable recognition, some studies focused
on depth information.
Nguyen et al. proposed a deep learning-based
data processing pipeline for automated optical inspec-
tion of wiring harnesses in automotive manufactur-
ing, addressing challenges such as high customization
and manual labor intensity by utilizing real and syn-
thetic point cloud data (Nguyen et al., 2022). The
developed pipeline employs PointNet++ for segmen-
tation, integrating synthetic data generated through
CAD and simulations to reduce reliance on real data.
The results demonstrate that combining real and syn-
thetic data enhances model accuracy, with the best-
performing configuration achieving a mean IoU of
94.62% and enabling precise quality assessment of
wiring harness assembly states. This approach marks
a significant step toward scalable, efficient automation
in wiring harness manufacturing.
Nguyen et al. presented a novel 3D vision-based
method for detecting and extracting the profiles of
multiple wire branches in wire harnesses to address
the challenges of robotized assembly of flexible and
deformable objects (Nguyen et al., 2024). By utiliz-
ing point cloud data from high-quality RGB-Depth
cameras and combining techniques like YOLO-v7
for terminal identification, RANSAC for background
elimination, and FRNN for color-based classification,
the method efficiently detects wire terminals and re-
constructs 3D wire profiles. Validated in a robotic
system, this approach enabled robots to perform pre-
cise wire harness assembly tasks, including manipu-
lation and sequential placement of wire branches in
clamps, significantly reducing manual labor and en-
hancing assembly efficiency. This research marks a
substantial advancement in automating complex as-
sembly processes for deformable components.
Although these studies utilized 3D data to rec-
ognize cables, they did not take into account funda-
mental cable characteristics, such as a constant radius
and smoothness, nor did they consider handling oc-
clusions.
2.2 Point Cloud Registration
Point cloud registration is a technique used to align a
reference point cloud with a target point cloud. It-
erative Closest Point (ICP) is a fundamental algo-
rithm in this field of study (Besl and McKay, 1992).
ICP works by calculating the distances between the
nearest neighbor points in the reference and target
ICPRAM 2025 - 14th International Conference on Pattern Recognition Applications and Methods
690
point clouds, then identifying the transformation ma-
trix that minimizes these distances. However, because
ICP relies solely on positional information, its accu-
racy can decline in cases where the geometries does
not include enough unevenness or contain multiple
similar regions.
To address this limitation, Colored Point Cloud
Registration was introduced, incorporating both po-
sitional and color information (Park et al., 2017). By
combining the two data sources, this approach finds
a transformation matrix that minimizes the objective
function, providing more accurate registration than
that conventional ICP does.
3 3D STEREO IMAGE
CAPTURING
A typical wire harness assembly process in the au-
tomobile industry is as follows. Cables are cut to
the designed length and both ends are contained in
connectors. Then a worker places each connector to
a designated receptor on a board called “assembly
board”. After checking that the route of the cable
is as designed and there is no kink or too much ten-
sion, the cables are taped thoroughly to complete the
work. Our target for automation is the process of ca-
ble and connector placement on an assembly board.
This study focuses on the cable placement examina-
tion process.
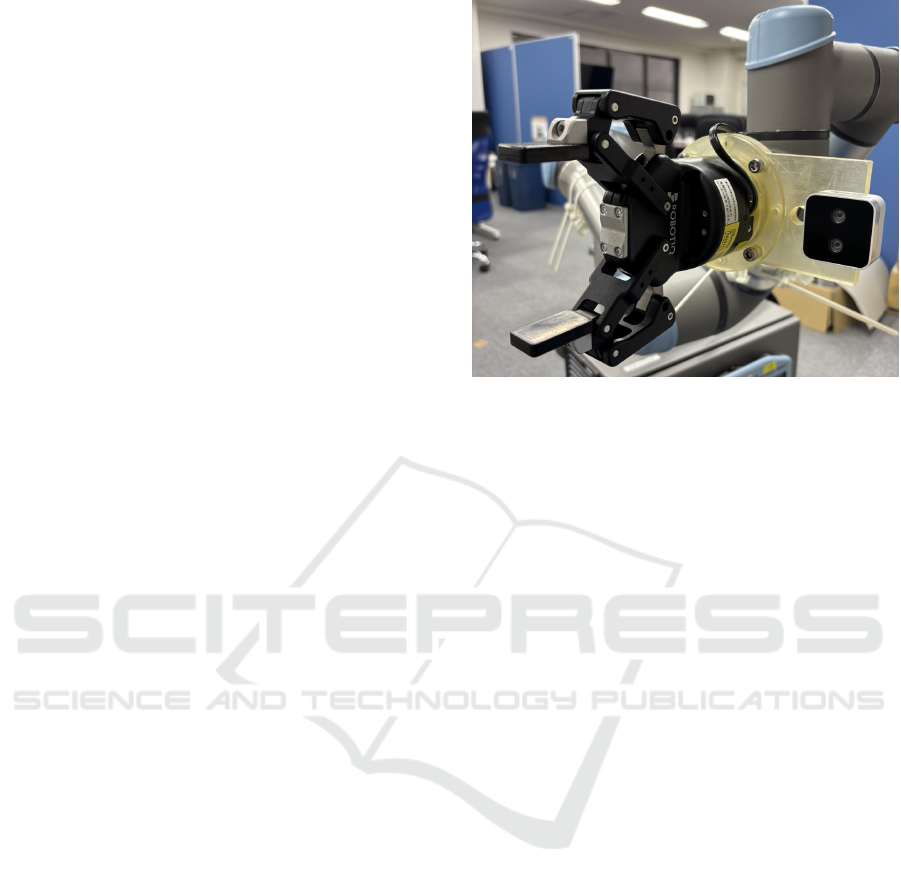
Among 3D shape measuring devices, we chose 3D
stereo camera because it captures color and is rela-
tively inexpensive and easy to handle. In this study, a
RealSense D405 stereo camera, as shown in Figure 1,
was used.
We captured 3D stereo images from 13 different
points which are equally distributed between the left
end and right end of an assembly board. From each
camera position, we captured images both before and
after the cable arrangement, as illustrated in Figure 2.
The assembly board includes connector receptors and
cable holders, through which the blue cable (1.30 mm
radius) and green cable (1.15 mm radius) are routed
to the receptor at right hand side. As shown in Figure
2, two patterns of cable routing were used. We used
the camera’s default application program to calculate
point clouds from the original stereo images.
4 DATA PROCESSING
This study proposes a two-stage methodology for
mathematically describing the place of each cable in
Figure 1: RealSense D405 camera mounted on UR5e robot.
wire harness as illustrated in Figure 3.
The first phase, which extracts point cloud on ca-
bles, begins with applying Colored Point Cloud Reg-
istration (CPCR) to align point clouds captured before
and after cable routing, CPCR produce a transforma-
tion matrix T. This matrix is applied to point cloud
P
after
to be aligned with point cloud P
before
. Here,
P
before
and P
after
are point cloud captured before the
routing and after the routing, respectively. Applying
T to P
after
produces the transformed point cloud, P
′
after
which is defined as:
P
′
after
= T q
j
| q
j
∈ P
after
(1)
where each q
j
represents a point in P
after
. Next, we
calculate the distance between each point p
i
in P
before
and the closest point in P
′
after
using a nearest neigh-
bor search. If the distance d(p
i
, P
′
after
) between p
i
and
the nearest point in P
′
after
exceeds a threshold θ, then
the point q
i
is considered to be a part of a cable and
included in new point cloud P
cables
.
d(p
i
, P
′
after
) = min
q
′
∈P
′
after
|p
i
− q
′
| > θ (2)
The extracted cable point cloud P
cables
is then defined
as:
P
cables
= q
i
∈ P
′
after
| d(p
i
, P
′
after
) > θ (3)
The threshold θ will be determined by evaluating how
well P
cables
represents the actual cables by experi-
ments.
The first step of the second phase is to classify
points in P
cables
to points on individual cable based on
color similarity. We use Euclidean distance between
the color of each point and the target color for clas-
sification. Let c
i
= (R
i
, G
i
, B
i
) be the color of point
i, and t = (R
t
, G
t
, B
t
) the target color. The Euclidean
A Two-Stage Approach for Wire Harness Cable Description Using 3D Point Clouds for Robotic Manufacturing
691
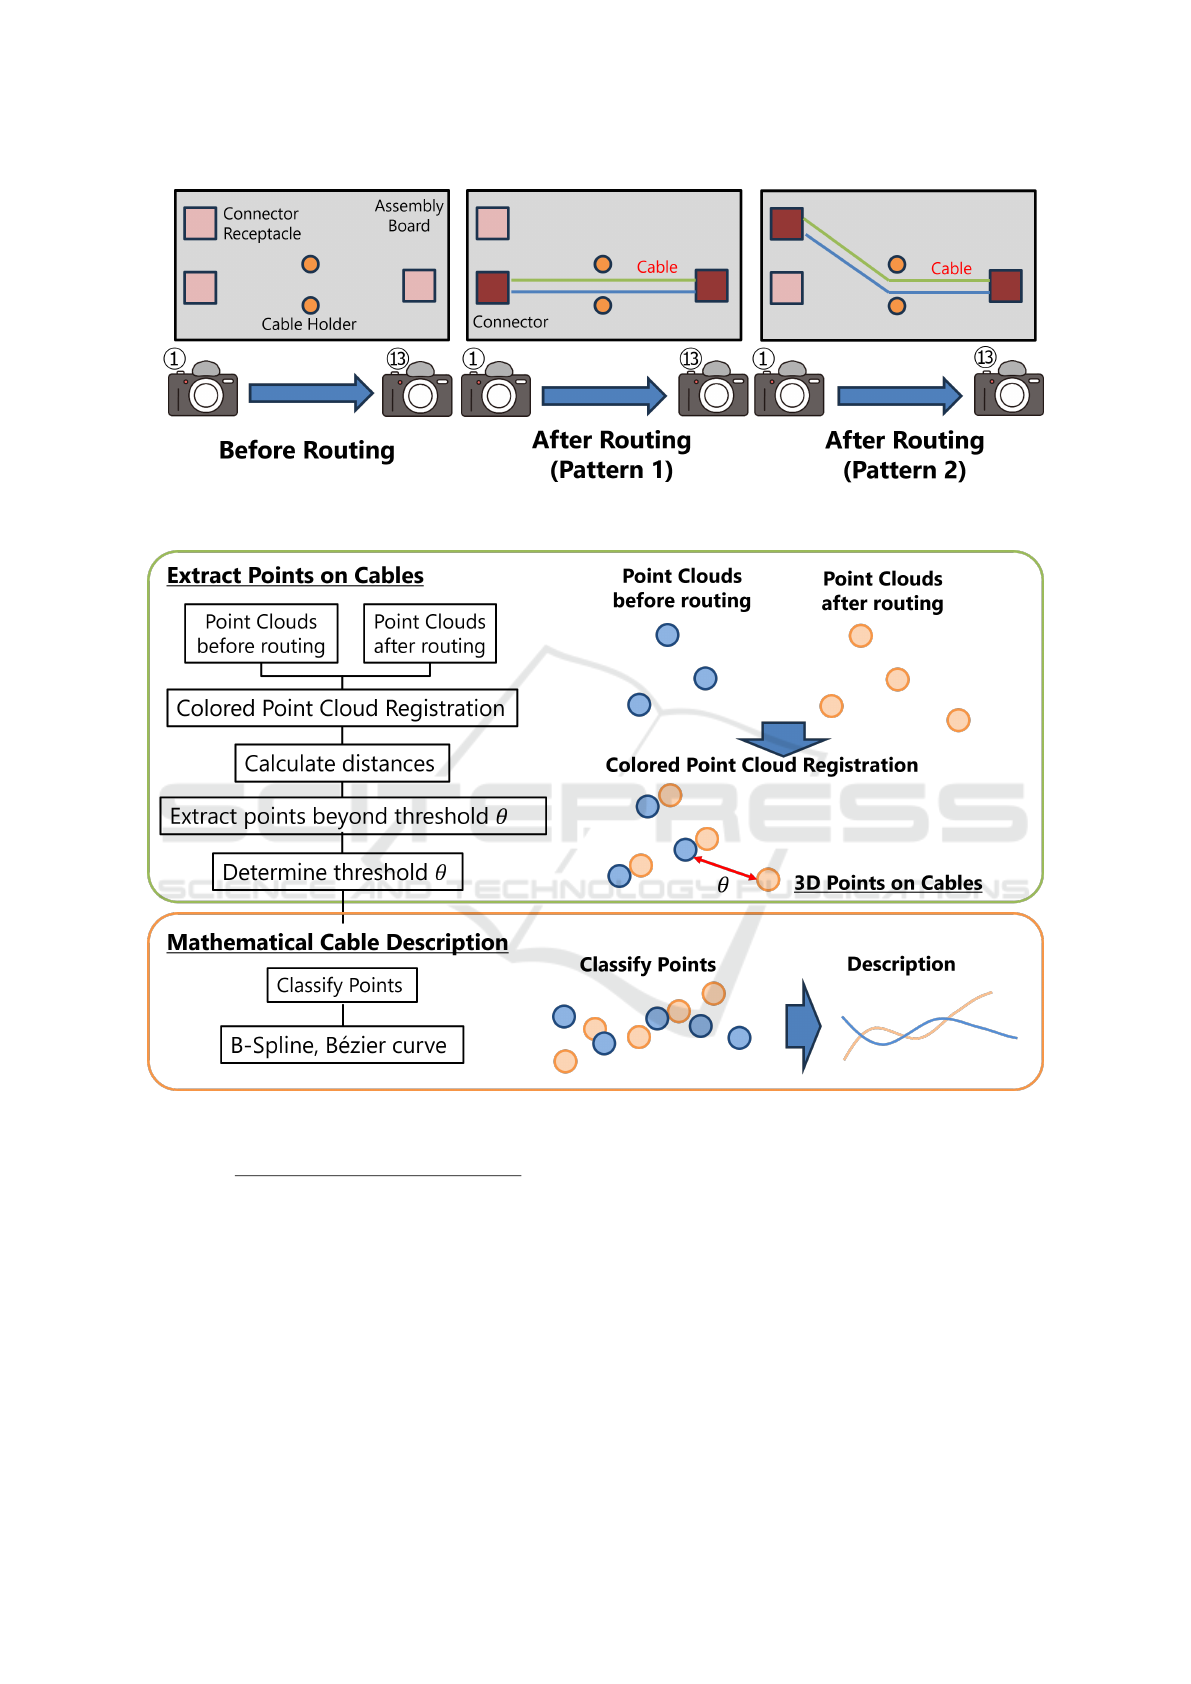
Figure 2: Overview of the assembly board.
Figure 3: Illustration of our methodology.
distance d
i
is given by
d
i
=
q
(R
i
− R
t
)
2
+ (G
i
− G
t
)
2
+ (B
i
− B
t
)
2
(4)
If d
i
is less than a specified tolerance, the point is
selected for further processing. While selecting the
color of the cable, statistical outlier removal is ap-
plied to eliminate noises. Here the points having the
same color together are considered to represent the
3D shape of a cable. However, there may be portions
where there is no point produced on the cable, for ex-
ample portions hidden by other cables. To interpolate
the obtained points and get a smooth and continuous
representation of a cable, we apply a 3D spline curve
using cubic B-spline interpolation. Given a sequence
of points {(x
i
, y
i
, z
i
)}, the spline curve S(t) is repre-
sented as
S(t) = (x(t),y(t),z(t)) =
n
∑
k=0
N
k,3
(t) · P
k
(5)
where:
• P
k
= (x
k
, y
k
, z
k
) are the points on a cable,
• N
k,3
(t) is the B-spline basis function of degree 3,
• t is the curve parameter within the range [0, 1].
The spline curve minimizes overall curvature, provid-
ing a smooth and continuous representation of the ca-
ble. As an alternative smooth curve-fitting method,
ICPRAM 2025 - 14th International Conference on Pattern Recognition Applications and Methods
692

Figure 4: Results of extracting points on cables.
Figure 5: Results of mathematical cable description.
we use a B
´
ezier curve, generated from a set of points.
For a set of n + 1 control points, the B
´
ezier curve B(t)
is defined by the Bernstein polynomials as follows:
B(t) =
n
∑
i=0
n
i
(1 −t)
n−i
t
i
P
i
(6)
where:
• P
i
= (x
i
, y
i
, z
i
) are points on a cable,
• t is the parameter of the curve, ranging from 0 to
1,
•
n
i
represents the binomial coefficient.
The resulting B
´
ezier curve provides a smooth path be-
tween points, with each point influencing the curve
shape based on its position and the binomial weight.
A Two-Stage Approach for Wire Harness Cable Description Using 3D Point Clouds for Robotic Manufacturing
693
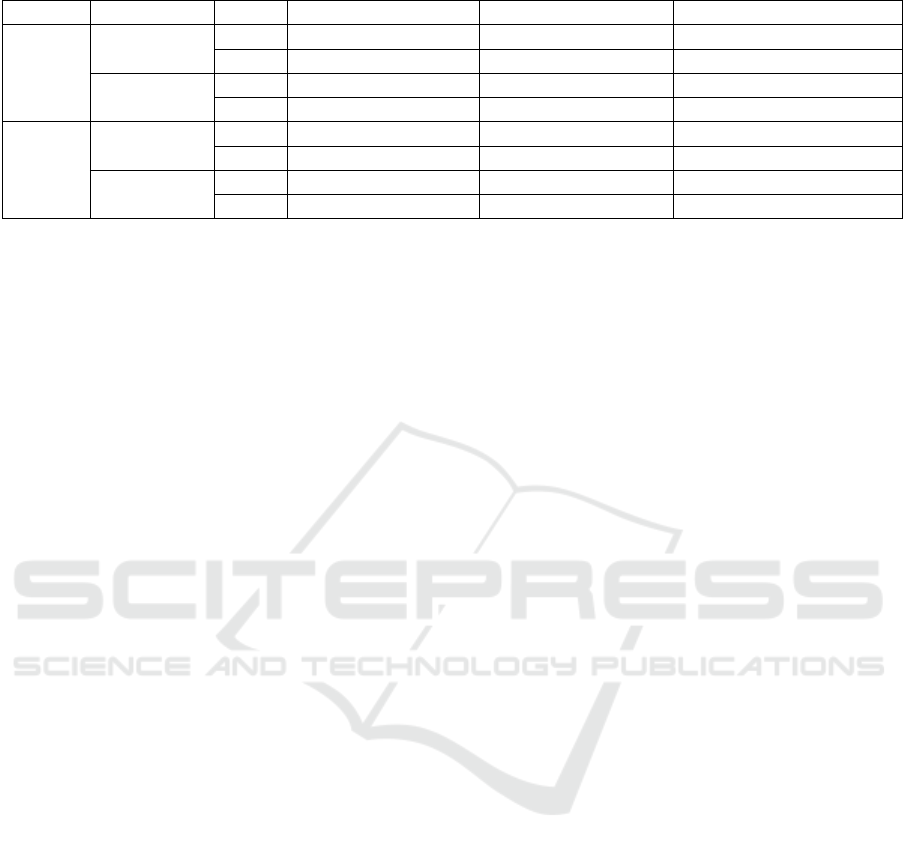
Table 1: Evaluation metrics for B-Spline and B
´
ezier curve fitting on blue and green cables.
Pattern Method Color Smoothness [1/mm] Curve Length [mm] Chamfer Distance [mm]
1 B-Spline Blue 3.29 × 10
−7
3.10 × 10
2
3.012
Green 1.16 × 10
−6
3.74 × 10
2
3.498
B
´
ezier curve Blue 1.44 × 10
−6
3.15 × 10
2
1.530
Green 2.35 × 10
−6
3.80 × 10
2
2.146
2 B-Spline Blue 2.21 × 10
−7
2.89 × 10
2
2.245
Green 8.29 × 10
−7
3.50 × 10
2
3.389
B
´
ezier curve Blue 9.08 × 10
−7
2.92 × 10
2
0.989
Green 1.90 × 10
−6
3.51 × 10
2
2.156
5 EXPERIMENTS
5.1 Extracting Points on Cables from
Acquired Point Cloud
Figure 4 shows experimental results of the point cloud
extraction phase, highlighting the differences in point
clouds completeness at varying thresholds. As shown
in the Figure, the threshold θ controls the trade-off
between the noise level and the coverage of points on
cables. Ideally, the point clouds of connectors and
cables should be extracted in this phase. Based on
the observations, we chose 20 as the value of θ for
optimal cable extraction.
5.2 Mathematical Cable Description
Figure 5 shows experimental results of the Mathemat-
ical Cable Description phase, illustrating how both B-
Spline and B
´
ezier curve describe the cable shapes cor-
rectly. As shown in the Figure 5, curves effectively
interpolate missing sections to describe the cables. In
a close observation, B-Spline provides a smoothed
curve that does not strictly adhere to each selected
point, while the B
´
ezier curve aligns exactly with the
selected points, creating a more precise but poten-
tially complex curve.
To evaluate the accuracy of cable approximations,
we employ three metrics: Smoothness, Curve Length,
and Chamfer Distance. These metrics provide a quan-
titative assessments of curve quality and alignment
accuracy to the original cable geometry. Each met-
ric is calculated as an average of the values at the 13
locations for each wire routing pattern.
Smoothness quantifies the continuity and fluidity
of a curve, calculated as the sum of the second deriva-
tive (curvature) along its length. Lower smoothness
values indicate a smoother transition. We calculate
the second derivative in each axis (x, y, and z), then
sum up the curvature across all points and axes.
Curve length is calculated by summing up the Eu-
clidean distances between consecutive points along
the curve. This metric is valuable for assessing how
well the B-Spline or B
´
ezier curve fits the original ca-
ble length, providing an indication of how accurately
a curve represents the real cable’s path.
Chamfer Distance evaluates the fitting accuracy
between the original and approximated point clouds,
calculating the average squared distance from each
point in the original point cloud to its nearest neighbor
point on the approximated curve. A lower Chamfer
Distance indicates a closer match between the origi-
nal and approximated point clouds, reflecting a higher
quality of approximation.
These metrics provide a comprehensive evaluation
of the approximation accuracy and quality of the fitted
curves. By averaging these metrics at the 13 locations
for each wire routing pattern, we obtained a robust
assessment of the fitting performance of the proposed
method.
Table 1 summarizes the calculated values of met-
rics to compare the performance of B-Spline and
B
´
ezier curve fittings. B-Spline consistently demon-
strates smaller values for both smoothness and curve
length, indicating that a smoother and simpler curves
were obtained. In contrast, the B
´
ezier curve, which
exactly traces the given control points, may be better
suited for representing more complex or highly de-
tailed curves. The obtained Chamfer Distance values,
ranging from 0.989 mm to 3.498 mm across all pat-
terns, reflect a close match between the original and
the approximated point clouds. These values were
about a few times as large as the cables radius (1.30
mm for blue and 1.15 mm for green ones) or shorter,
indicating a high level of fitting accuracy. Also these
values are much smaller than the width of the robot
hand (92mm), indicating that it has no practical prob-
lem when in use. In addition, the case of four-color
cables was also experimented, and the prospect of
good results was obtained.
ICPRAM 2025 - 14th International Conference on Pattern Recognition Applications and Methods
694

6 CONCLUSIONS
This paper has proposed a novel two-stage method-
ology for accurately describing cable geometry us-
ing a 3D stereo camera. Through extracting point
cloud which only contains points on the target ca-
bles from the two sets of point clouds captured be-
fore and after cable arrangement and employing ad-
vanced curve fitting techniques to the obtained cable-
only point cloud, the methodology produces a contin-
uous and accurate representation of cable geometry.
Using the proposed methodology, the observed ap-
proximation accuracy was about a few times as large
as the radius of the cables or shorter. Future research
could focus on adapting the approach to handle var-
ious cable types and exploring alternative algorithms
to improve fitting accuracy further and computational
efficiency. Overall, this study contributes a founda-
tional approach to accurately modeling cable geome-
try in 3D, which may significantly aid in the develop-
ment of automated solutions for complex wire harness
routing in the automotive and manufacturing indus-
tries.
ACKNOWLEDGEMENTS
We would like to express our heartfelt gratitude to
Chen Yuchuan, who received BS degree from Waseda
University in March 2024, for his bachelor thesis re-
search that forms a foundation of this paper’s work.
REFERENCES
Besl, P. and McKay, N. D. (1992). A method for registration
of 3-d shapes. IEEE Transactions on Pattern Analysis
and Machine Intelligence, 14(2):239–256.
Chien, P.-C., Liao, P., Fukuzawa, E., and Ohya, J. (2024).
Classifying cable tendency with semantic segmenta-
tion by utilizing real and simulated rgb data. In Pro-
ceedings of the IEEE/CVF Winter Conference on Ap-
plications of Computer Vision, pages 8430–8438.
Karlsson, T.,
˚
Ablad, E., Hermansson, T., Carlson, J., and
Tenf
¨
alt, G. (2024). Automatic cable harness layout
routing in a customizable 3d environment. Computer-
Aided Design, 169:103671.
Nguyen, H. G., Habiboglu, R., and Franke, J. (2022). En-
abling deep learning using synthetic data: A case
study for the automotive wiring harness manufactur-
ing. Procedia CIRP, 107:1263–1268. Leading man-
ufacturing systems transformation – Proceedings of
the 55th CIRP Conference on Manufacturing Systems
2022.
Nguyen, T. P., Kim, D., Lim, H.-K., and Yoon, J. (2024).
Revolutionizing robotized assembly for wire harness:
A 3d vision-based method for multiple wire-branch
detection. Journal of Manufacturing Systems, 72:360–
372.
Nguyen, T. P. and Yoon, J. (2021). A novel vision-based
method for 3d profile extraction of wire harness in
robotized assembly process. Journal of Manufactur-
ing Systems, 61:365–374.
Park, J., Zhou, Q.-Y., and Koltun, V. (2017). Colored
point cloud registration revisited. In Proceedings of
the IEEE international conference on computer vi-
sion, pages 143–152.
A Two-Stage Approach for Wire Harness Cable Description Using 3D Point Clouds for Robotic Manufacturing
695
