
Evaluation of OCT Image Synthesis for Choroidal and Retinal Layer
Segmentation Using Denoising Diffusion Probabilistic Models
Yudai Yamauchi
1,2 a
, Yuli Wu
2 b
and Eiji Okada
1 c
1
Keio University, Department of Electronics and Electrical Engineering, Japan
2
Institute of Imaging and Computer Vision, RWTH Aachen University, Germany
Keywords:
Retinal OCT Image, Denoising Diffusion Probabilistic Models, Image Synthesis.
Abstract:
Machine learning can automatically conduct the layer segmentation task of retinal optical coherence tomog-
raphy (OCT) image, but annotated data is required to train these models. Synthetic retinal OCT images are
generated using denoising diffusion probabilistic models (DDPMs), which can be used to train segmentation
models effectively and automatically create annotated data. However, the extent to which these synthetic im-
ages contribute to segmentation accuracy compared to real data has not been investigated. In this study, we
synthesized retinal OCT images from sketch images using DDPMs, trained a segmentation model using syn-
thetic and real images, and evaluated how the use of synthetic images influenced the accuracy of choroidal
and retinal layer segmentation compared to results using only real images. Through a comparison of the Dice
score, we confirmed that training with both synthetic and real OCT images led to higher Dice scores than train-
ing with only real OCT images. These findings suggest that using synthetic images can enhance segmentation
accuracy, offering a promising approach to improving model performance in situations with limited annotated
real data.
1 INTRODUCTION
The human retina is a collection of thin layers that
line the inner wall of the eye, and it is a vital or-
gan that receives light information from outside and
converts it into visual information. It is widely rec-
ognized that the thickness of retinal layers is associ-
ated with various diseases. For instance, the thick-
ness of the choroid, which underlies the retina, is
also associated with certain diseases and increases
the likelihood of early-atrophic age-related macular
degeneration (Sigler et al., 2014). Tomographic im-
ages essential for diagnosing retinal diseases are ob-
tained through optical coherence tomography (OCT),
a technology widely applied in ophthalmology and
other fields. OCT is a non-invasive technique used
to obtain information about the refractive index struc-
ture within biological tissues. OCT can capture high-
resolution internal tissue structures without the need
for complex algorithms (Schmitt, 1999).
Usually, the retinal layers in an OCT image are
a
https://orcid.org/0009-0008-5579-8116
b
https://orcid.org/0000-0002-6216-4911
c
https://orcid.org/0000-0002-7846-7677
manually segmented by an ophthalmologist to mea-
sure the thickness of the layers. However, manual seg-
mentation is highly complex and time-consuming (Ye
et al., 2023). Therefore, automatic segmentation us-
ing machine learning has been widely studied in re-
cent years (He, 2021). Machine learning models
for segmentation are usually supervised learning, and
the supervised learning model requires an annotated
dataset. For this reason, annotated datasets such as the
COCO dataset (Lin et al., 2014), which contains over
200k labelled images for segmentation tasks, and the
Open Images v4 Dataset (Kuznetsova et al., 2020),
which contains 9.2M images, are publicly available
and are widely used for training models. Therefore,
automatic segmentation using machine learning re-
quires a sufficiently annotated dataset for training,
but annotated medical image datasets are usually very
limited (Wang et al., 2021). Hence, research has been
carried out to generate synthetic images correspond-
ing to the ground-truth label using generative models.
Generative adversarial networks (GANs) (Good-
fellow et al., 2014) have shown remarkable results in
various generative tasks and have been used in various
settings. It is used for various medical imaging tasks,
such as synthesizing retinal OCT images (Zheng
340
Yamauchi, Y., Wu, Y. and Okada, E.
Evaluation of OCT Image Synthesis for Choroidal and Retinal Layer Segmentation Using Denoising Diffusion Probabilistic Models.
DOI: 10.5220/0013246600003911
In Proceedings of the 18th International Joint Conference on Biomedical Engineering Systems and Technologies (BIOSTEC 2025) - Volume 1, pages 340-347
ISBN: 978-989-758-731-3; ISSN: 2184-4305
Copyright © 2025 by Paper published under CC license (CC BY-NC-ND 4.0)

et al., 2020) and brain tumor MR images (Mukherk-
jee et al., 2022). The flow-based model (Rezende and
Mohamed, 2015) can directly learn the data distribu-
tion of the training data, enabling the rapid generation
of many images. It has been used in applications such
as the reconstruction of CT and MR images (Denker
et al., 2021), as well as synthesizing of chest X-ray
images (Hajij et al., 2022). While GAN can synthe-
size high-quality images, it is known to suffer from
”mode collapse,” in which the model becomes unsta-
ble during training and synthesizes images only sim-
ilar to those in the input data. The flow-based model
demonstrates stable training, but the quality of the
generated images is low (Xiao et al., 2021).
Most recently, denoising diffusion probabilistic
models (DDPMs) (Ho et al., 2020) have emerged
as one of the most promising generative models,
known for their stability during training and their
ability to produce high-quality data. Unlike GAN
and the flow-based model, DDPMs demonstrate sta-
ble learning and consistently generate higher-quality
images, while also being capable of generating di-
verse data without causing ”mode collapse” (Dhari-
wal and Nichol, 2021; M
¨
uller-Franzes et al., 2023;
Xiao et al., 2021). DDPMs have successfully syn-
thesised high-quality microscopy images from simple
structural sketches for cell tracking tasks (Eschweiler
et al., 2024; Yilmaz et al., 2024). Previous studies
have also used DDPMs to generate annotated datasets
to train segmentation models, improving the accuracy
of automatic layer segmentation in retinal OCT im-
ages (Wu et al., 2024). As suggested in (Eschweiler
et al., 2024; Yilmaz et al., 2024; Wu et al., 2024),
it is important to evaluate the generated biomedical
images directly with the downstream task, such as
segmentation and tracking. However, since synthetic
data is not real data but artificially generated, it is nec-
essary to evaluate the extent to which synthetic data
can substitute for real data. In this study, we assess the
quality of DDPM-generated images by evaluating the
performance of a layer segmentation model trained on
synthetic retinal OCT images and comparing it with a
model trained on real retinal OCT images.
2 METHODS
2.1 Denoising Diffusion Probabilistic
Models
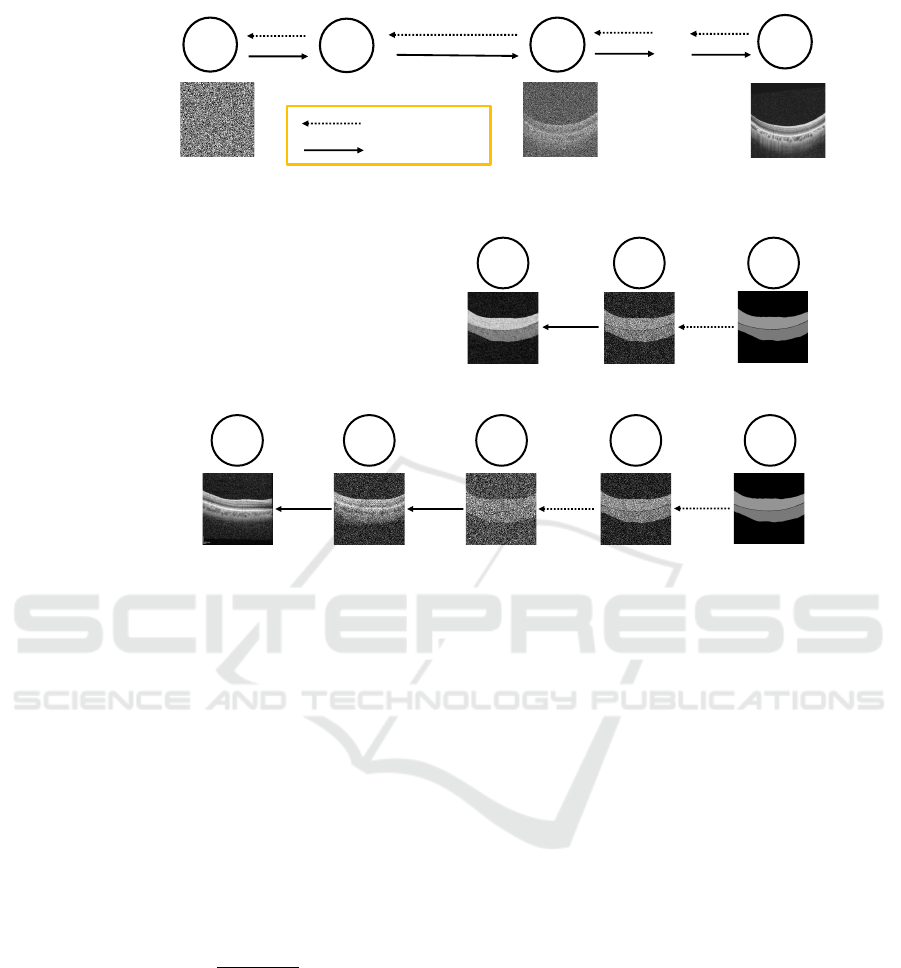
There are two processes in the DDPMs training phase.
The first is the diffusion process, which progressively
adds noise to the original image—the image we want
to train—until it becomes “pure noise,” meaning it no
longer retains any information about the original im-
age. The second is the reverse process, which reverses
the diffusion process by removing noise to reconstruct
the original image. Figure 1a illustrates the training
pipeline, where X
0
represents the retinal OCT image,
and T denotes the total number of time steps during
which noise accumulates. The noise is determined at
each time according to the following equation 1.
q(x
t
|x
t−1
) := N
x
t
;
p
1 − β
t
x
t−1
, β
t
I
(1)
where t is 1 < t < T . Moreover, β
t
is a variable
that determines the amount of noise added. At each
time step, β
t
is incrementally adjusted, being set to
{β
1
, β
2
, .. . , β
T
}.
Next, the reverse process is described. In this pro-
cess, a neural network is used to denoise the origi-
nal OCT image from pure noise. p
θ
, the diffusion
process that generates the data x
t−1
from x
t
to the
previous time step can be expressed as follows. The
learning process starts with the pure noise distribution
p(x
T
) = N (x
T
;0, I), and proceeds through Gaussian
transitions as described in Equation 2:
p
θ
(x
t−1
|x
t
) := N (x
t−1
;µ
θ
(x
t
,t), Σ
θ
(x
t
,t)). (2)
After the training phase, we move to the synthe-
sis phase. Figure 1b illustrates the synthetic pipeline.
Retinal OCT image is input in the training phase.
However, in the synthesis phase, we use an image that
has a rough texture and structure of the retinas: the
sketch image. Assuming the total time step is trained
at 1000, the number of time steps can be changed to
obtain images with different modalities. The upper
part of Figure 1b shows an example with time step
100 and the lower part with time step 900. The syn-
thetic image not only retains many of the characteris-
tics of the sketch image but also fails to capture the
characteristic qualities inherent to the OCT image. In
contrast, in the case of time step 900, the amount of
noise added is large, so the synthetic image captures
the characteristic qualities inherent to the OCT im-
age. However, due to too much noise being added, the
synthetic image doesn’t retain the shape of the sketch
image. Therefore, optimization is needed to identify
the ideal time step with the OCT image’s features and
preserve the sketch image’s shape.
2.2 Choroidal and Retinal Layer
Segmentation
Segmentation was performed using U-Net (Ron-
neberger et al., 2015), widely used in medical image
segmentation tasks. U-Net is constructed by encoder
Evaluation of OCT Image Synthesis for Choroidal and Retinal Layer Segmentation Using Denoising Diffusion Probabilistic Models
341
Training phase :
!
!
!
"
!
!"#
!
#
$
!
%&
"#$
'&
"
(
)%&
"#$
'&
"
(
…
Real OCT image
: Adding noise
: Denoising
(a)
Synthesis phase :
!
!
Sketch image
!
!
Synthetic image
!
!""
!
!
Sketch image
!
!""
…
!
!""
!
#""
!
!
…
…
…
Synthetic image
(b)
Figure 1: (a) Training pipeline. This workflow illustrates the DDPMs training using real OCT Image. (b) Synthesis pipeline.
The upper workflow illustrates image synthesis with time step 100. The lower workflow illustrates image synthesis with time
step 900.
and decoder. The encoder converts the input image
into a low-dimensional feature representation, which
extracts local and global features of the image by pro-
gressively reducing the image’s resolution. The de-
coder uses the output of the encoder to restore the
low-dimensional feature map to the resolution of the
original input image. Dice score is often used to quan-
tify the result of segmentation and is defined as fol-
lows Equation 3.
Dice(c) =
2|A
c
∩ B
c
|
|A
c
| + |B
c
|
(3)
Here, |A
c
| is the number of pixels of class c in the
ground truth for the input image, |B
c
| is the number of
pixels of class c in the predicted image for output, and
|A
c
∩ B
c
| denotes the number of overlapping pixels of
class c between the ground truth and the predicted im-
age.
3 EXPERIMENTS AND RESULTS
3.1 Dataset
We used the OIMHS dataset, an open-source retinal
OCT image dataset. This dataset was used by Ye’s
research group (Ye et al., 2023) using the Spectral-
domain OCT (SD-OCT) system (Spectralis HRA
OCT, Heidelberg Engineering, Heidelberg, Germany)
to obtain retinal OCT images of patients with macu-
lar holes. This dataset contains 3859 retinal OCT im-
ages of 119 patients with macular holes and a set of
four segmentation labels provided by a skilled oph-
thalmologist: retinal layer, macular hole, intraretinal
cysts, and choroidal layer. The image set also contains
an image quality assessment based on an objective
assessment (low signal strength) and two subjective
perspectives (i.e. signal shield and image blur). This
study targets pure retina layer segmentation. Thus,
we used OCT images containing only the retinal and
choroidal layers. Additionally, to avoid differences in
the images used for training, we employed a set of
1,179 images that were not classified as having any
BIOIMAGING 2025 - 12th International Conference on Bioimaging
342
Sketch image T = 200 T = 400
Type 1
Type 2
Type 3
Sketch type
Time step
T = 600
T = 800
Ground truth
(OCT image)
Segmentation
label
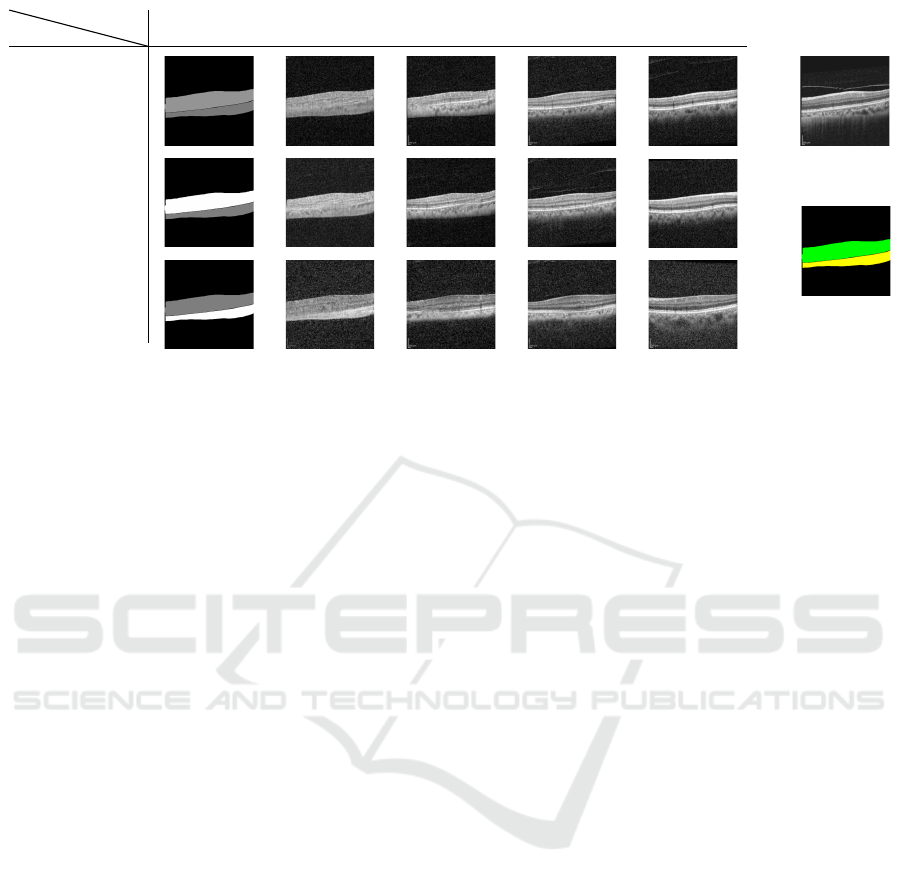
Figure 2: Example of synthetic OCT images generated using three types sketch image. The row shows the type of sketch.
The column shows the input sketch image and each time step. sketch image represents the segmentation label(right below the
image) in grey scale. Type 1: The sketch image uses the same pixel values as the OCT image in the dataset. Types 2 and
3: sketch images with the highest contrast between layers. Specifically, the pixel values in each type of sketch image are as
follows: in Type 1, the retinal layer is set to 149, and the choroidal layer is set to 122; in Type 2, the retinal layer is 255, and
the choroidal layer is 127; in Type 3, the retinal layer is 127, and the choroidal layer is 255.
problems based on quality assessment. The original
image size of 512 x 512 was downsampled to 256 x
256 to reduce computer memory. 79 images were also
allocated for segmentation testing and 1100 images
for training the segmentation model. Finally, 550 im-
ages from the segmentation training images were al-
located for training the DDPMs and 550 images for
synthesising images using the DDPMs.
3.2 Image Synthesis
We set the total time step: T = 1000 for DDPMs
training and cosine-based scheduling of the variance
β
t
(β
1
= 10
−4
to β
T
= 0.02). The sketch image was
created by grayscaling the segmentation label of the
dataset. Three types of sketches were created because
there are three possible pixel values for grayscaling.
The average pixel value in the retinal layer is 149, and
the choroidal layer is 122, which are pixel values of
the OCT image in the dataset. Therefore, we set the
same pixel value to the sketch image, the input image
to DDPMs in the synthesis phase. This sketch image
was defined as Type 1.
On the other hand, as the synthetic image is used
for segmentation training, it is considered more effec-
tive during segmentation if the contrast between the
layers is emphasized. Therefore, the OCT pixel val-
ues are ignored, and the sketch image with the highest
contrast between layers is used. In this case, the pixel
value range is from 0 to 255, so the background is set
to 0, and 127 and 255 are allocated to the two layers.
The sketch image with 255 allocated to the reti-
nal layer and 127 to the choroidal layer is defined as
sketch image Type 2, whereas a sketch image with
255 allocated to the choroidal layer and 127 to the
retinal layer is defined as sketch image Type 3.
We trained the DDPMs on 550 retinal OCT im-
ages and synthesized 550 images of three different
sketch images with different time steps t starting from
{100 to 900, interval 100}. An example of this image
synthesis is shown in Figure 2.
Moreover, sketch images as input to DDPMs have
unnatural changes in pixel values between layers.
Gaussian blur was added to create natural boundaries
and perturb the pixel intensity of the image. It has
been reported that applying this makes the composite
image more closely resemble the original OCT image
(Wu et al., 2024).
We evaluated the image accuracy of the synthetic
image using the quantitative evaluation methods Peak
signal-to-noise ratio (PSNR), Structural similarity in-
dex measure (SSIM) (Wang and Bovik, 2009) and
Fr
´
echet inception distance (FID) (Heusel et al., 2017).
The PSNR represents the ratio between the maximum
possible power of a signal and its noise. A higher
PSNR value indicates less distortion or error, mean-
ing the signal retains more of its original quality;
SSIM evaluates the similarity between two images by
considering changes in structural information, lumi-
nance, and contrast. A higher SSIM value indicates
more similarity, meaning the compared images retain
similar structural and perceptual qualities; FID evalu-
ates how close the generated image is to the real im-
age by comparing the mean and variance, with lower
Evaluation of OCT Image Synthesis for Choroidal and Retinal Layer Segmentation Using Denoising Diffusion Probabilistic Models
343
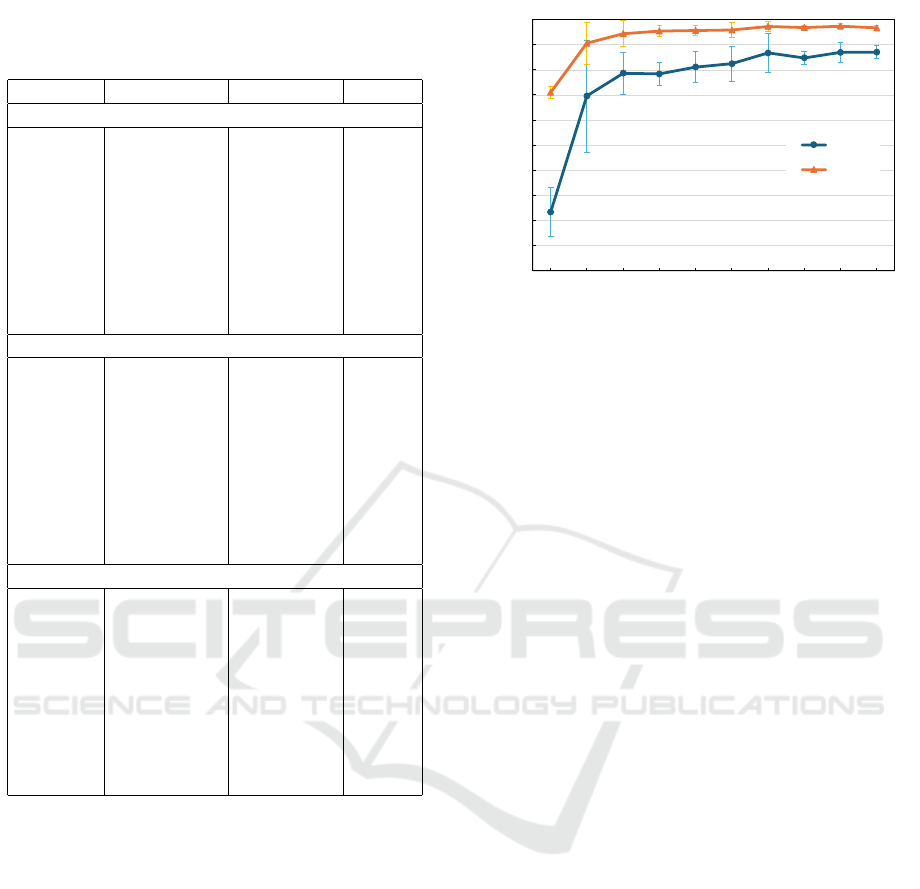
Table 1: Evaluate image quality. Image quality metrics are
Peak signal-to-noise ratio (PSNR), Structural similarity in-
dex measure (SSIM) and Fr
´
echet inception distance (FID).
time step PSNR ↑ SSIM ↑ FID ↓
Type 1
100 16.59 ± 0.66 0.29 ± 0.06 268.32
200 16.71 ± 0.62 0.30 ± 0.06 189.20
300 16.85 ± 0.61 0.30 ± 0.05 148.04
400 17.06 ± 0.64 0.31 ± 0.05 115.54
500 17.20 ± 0.66 0.31 ± 0.05 98.90
600 17.40 ± 0.72 0.31 ± 0.05 86.09
700 17.60 ± 0.80 0.31 ± 0.06 75.21
800 17.55 ± 0.97 0.31 ± 0.06 72.36
900 16.77 ± 1.11 0.31 ± 0.06 74.89
Type 2
100 16.56 ± 0.66 0.29 ± 0.06 266.24
200 16.70 ± 0.62 0.30 ± 0.06 190.01
300 16.83 ± 0.60 0.30 ± 0.05 145.95
400 16.96 ± 0.61 0.31 ± 0.05 120.05
500 17.18 ± 0.69 0.31 ± 0.05 96.56
600 17.43 ± 0.73 0.31 ± 0.05 86.35
700 17.57 ± 0.75 0.31 ± 0.06 76.28
800 17.53 ± 0.95 0.31 ± 0.06 71.02
900 16.83 ± 1.06 0.31 ± 0.06 77.53
Type 3
100 16.47 ± 0.82 0.23 ± 0.06 284.65
200 16.71 ± 0.78 0.24 ± 0.05 214.99
300 16.91 ± 0.79 0.25 ± 0.05 163.79
400 17.09 ± 0.81 0.26 ± 0.06 132.98
500 17.21 ± 0.91 0.26 ± 0.06 115.62
600 17.25 ± 0.97 0.26 ± 0.06 110.35
700 17.18 ± 1.06 0.25 ± 0.06 108.37
800 16.88 ± 1.14 0.26 ± 0.06 106.87
900 15.98 ± 1.09 0.27 ± 0.05 109.95
FID indicating more significant similarity to the real
image. For this work, we adopted the sentence in-
forming about using Clean-FID (Parmar et al., 2022)
that improved the reliability and consistency com-
pared with a usual FID. Table 1 compares the origi-
nal images and synthesized images at time steps 100
to 900 and sketch image Types 1 to 3, using PSNR,
SSIM, and FID as evaluation metrics. The results
show that the quality of both images improves as time
step increases. However, it can be seen that the ac-
curacy of PSNR and SSIM decreases after time step
700. A possible explanation for this may be the mis-
matching of composite images, as mentioned in Sec-
tion 3.1; it is known that if too much noise is added,
the original image shape cannot be preserved. There-
fore, when the total time step is 1000, it can be seen
that image mismatching occurs after time step 700.
In addition, the FID of Type 1 and Type 2 decrease
almost the same way, but only for Type 3 the FID does
0.50
0.55
0.60
0.65
0.70
0.75
0.80
0.85
0.90
0.95
1.00
100 200 300 400 500 600 700 800 900 1000
Dice score
Number of images
Choroid
Retina
Figure 3: Mean dice score (y axis) trained with retinal OCT
images among a number of training image (x axis), orange
line shows result of retinal layer, dark blue line shows result
of choroidal layer.
not fall below 100 even if the time step is increased. In
OCT images, the average pixel intensity is higher in
the retinal layer and lower in the choroidal layer. The
results in Table 1 indicate that in both cases—when
the pixel values in the sketch image are close to those
in the OCT image and when the contrast between lay-
ers in the sketch image is clear—aligning the pixel
value order with the original image leads to a more
accurate synthesized image.
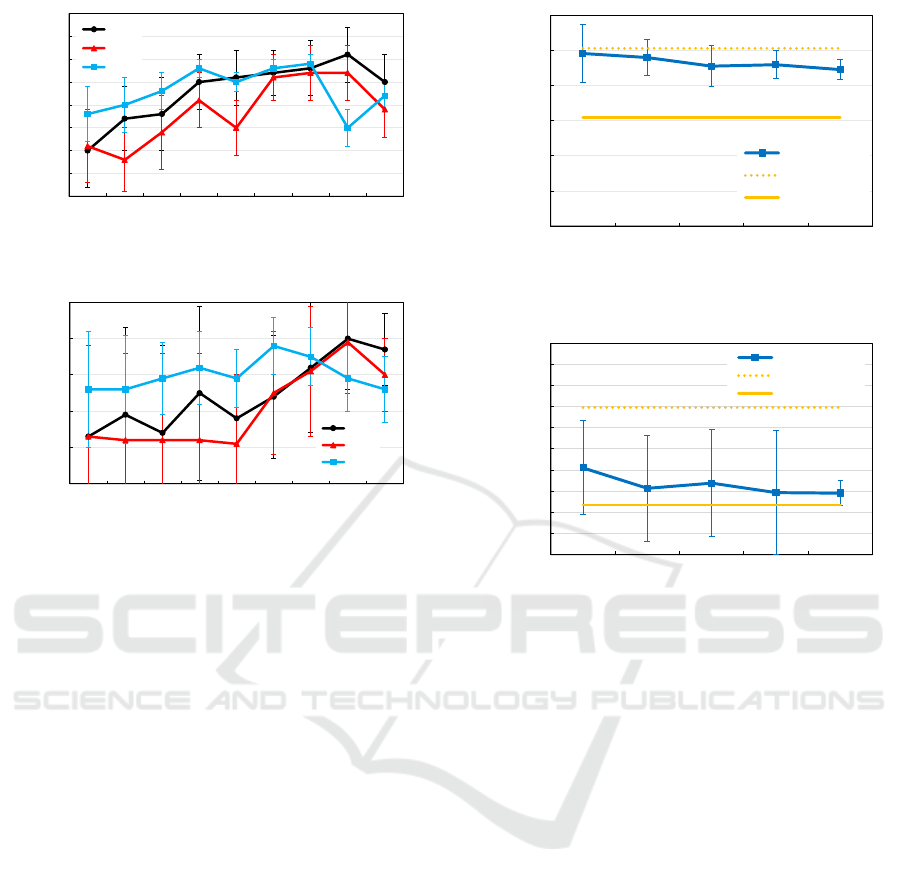
The subsequent step involves evaluating the types
of synthetic images optimal for training a segmenta-
tion model. For the segmentation evaluation, 500 of
the 550 synthetic images were used for training, 50
for validation and 79 test OCT images were used for
segmentation during testing. Figure 4 shows the Dice
score when synthetic images at each time step were
used for training. The results of Dice score show that
Type 2 has a better Dice score than Types 1 and 3
when the time step is below 600. However, for time
steps higher than Time 700, the Dice score is reversed
between Types 1,3, and 2. Type 2 was created to
emphasize the contrast between layers in sketch im-
ages, which may have facilitated segmentation when
the time step was low; as the time step improved, the
pixel values in Type 1 converged and were closer to
those in the original OCT images. Therefore, it is
considered that the best Dice score was produced.
3.3 Evaluating Synthesis with Layer
Segmentation
The number of training samples significantly influ-
ences segmentation performance when training a seg-
mentation model solely with OCT images.
Figure 3 illustrates the model’s performance as the
BIOIMAGING 2025 - 12th International Conference on Bioimaging
344
0.60
0.65
0.70
0.75
0.80
0.85
0.90
0.95
1.00
100 200 300 400 500 600 700 800 900
Dice score
Time step
Type 1
Type 2
Type 3
(a) Retinal Layer
0.25
0.35
0.45
0.55
0.65
0.75
100 200 300 400 500 600 700 800 900
Dice score
Time step
Type 1
Type 2
Type 3
(b) Choroidal Layer
Figure 4: Mean Dice score (y axis) trained with 500 syn-
thesized image among each time step (x axis), types of 3
sketch images that are input to DDPMs synthesis. (a) Re-
sults of the retinal layer. (b) Results of the choroidal Layer.
number of OCT images used for training increases in-
crementally from 100 to 1000 images in steps of 100
images. As shown in Figure 3, the Dice score remains
notably lower when the model is trained on only 100
images, compared to the performance achieved with
200 or more training images. This observation sug-
gests that a dataset of less than 100 images may need
to be sufficient for the model to adequately learn seg-
mentation features, indicating a threshold in sample
size necessary to achieve stable segmentation perfor-
mance.
Secondly, we evaluate how much effect the Seg-
mentation predicted is using synthetic images. We
calculate a Dice score from a segmentation model that
is trained with 100 OCT images and synthetic images.
Figure 5 shows the Dice score of layer segmentation
when training with 100-500 synthetic images for 100
OCT images.
Based on the findings in Section 3.2, we selected
synthetic images of Sketch Type 1 as input for the
DDPM, specifically choosing those generated at time
step 800 as training data for the segmentation model.
Our results show a clear improvement in Dice score
accuracy when these synthetic images are added to
0.70
0.75
0.80
0.85
0.90
0.95
1.00
100/100 100/200 100/300 100/400 100/500
Dice score
Training image (OCT image/synthetic image)
Mean Dice score
OCT Image 200
OCT Image 100
(a) Retinal Layer
0.50
0.55
0.60
0.65
0.70
0.75
0.80
0.85
0.90
0.95
1.00
100/100 100/200 100/300 100/400 100/500
Dice Score
Training image (OCT image/synthetic image)
Mean Dice score
OCT Image 200
OCT Image 100
(b) Choroidal Layer
Figure 5: Mean Dice score (y axis) trained with 100 OCT
and 100 to 500 synthesized image. The blue line is the av-
erage Dice score; the yellow line is the average Dice score
trained on 100 OCT images; the yellow dotted line is the
average Dice score trained on 200 OCT images. (a) Results
of the retinal layer. (b) Results of the choroidal layer.
a training set of 100 OCT images. This suggests
that synthetic images contribute positively to model
performance, helping to alleviate some of the limi-
tations posed by a smaller dataset of real OCT im-
ages. However, it is important to note that while
the addition of synthetic images enhances segmenta-
tion performance, it does not fully match the accuracy
achieved when training with 200 OCT images alone
for both the retinal and choroidal layers. A likely rea-
son for this is a structural mismatch within the syn-
thetic images. Specifically, although synthetic images
generated at time step 800 share properties with the
OCT modality on which the DDPM was trained, they
do not entirely replicate the detailed layer structures
present in real OCT images or those outlined in the
input sketch images. As a result, when the segmen-
tation model is trained using a combination of syn-
thetic and real OCT images, its performance remains
slightly lower than when trained with an equivalent
Evaluation of OCT Image Synthesis for Choroidal and Retinal Layer Segmentation Using Denoising Diffusion Probabilistic Models
345
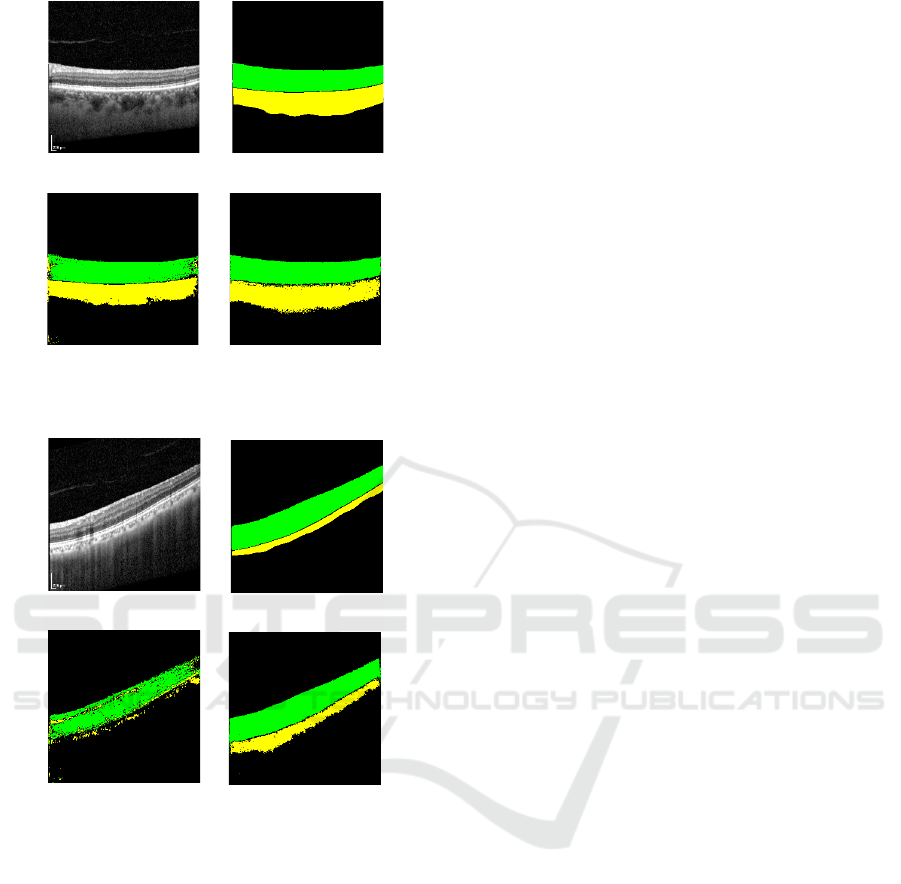
(a) OCT image (b) Ground truth
(c) 100 OCT images
(d) 100 synthetic images
with 100 OCT images
I. Best examples.
(a) OCT image (b) Ground truth
(c) 100 OCT images
(d) 100 synthetic images
with 100 OCT images
II. Worst examples.
Figure 6: Input OCT images predicted each layer when the
segmentation model is trained with 100 OCT images and
the best Dice score (I) and the worst Dice score (II). The
green region shows the layer, and The yellow region shows
the choroidal layer. (a) Input OCT image. (b) Ground truth.
(c) Segmentation predicted from the segmentation model
trained on 100 OCT images. (d) Segmentation predicted
from the segmentation model trained on synthetic 100 im-
ages and 100 OCT images.
number of only real OCT images. Nevertheless, the
addition of synthetic images led to a notable improve-
ment in the Dice score for retinal layer segmentation,
with an increase of nearly 0.1. This result is compara-
ble to the performance achieved when training on 200
real OCT images, highlighting synthetic images’ po-
tential to effectively augment training datasets when
real data is limited. However, it was observed that the
segmentation accuracy did not improve when more
than 200 synthetic images were added. This is likely
because the contribution of real images diminishes as
the absolute quantity of synthetic images increases.
We also discuss the results of individual segmen-
tations. Figure 6-I show the segmentation results with
the highest Dice score, achieved by training with only
100 OCT images, Figure 6-II shows the segmentation
results with the lowest Dice score In Figure 6-I, train-
ing with 100 OCT images, shows that the model mis-
classified a region that should be the retinal layer (as
per the ground truth) as the choroidal layer. However,
when trained with an additional 100 synthetic images,
the model correctly identified this region as the reti-
nal layer. Similarly, Figure 6-II highlights a signifi-
cant improvement in the accuracy of choroidal layer
segmentation when synthetic images were added. Ex-
amining Dice scores, we see that training with only
100 OCT images yields scores of 0.88 for the retinal
layer and 0.75 for the choroidal layer in Figure 6-II.
Adding 100 synthetic images improves these scores
to 0.92 and 0.83, respectively. Likewise, in Figure 6-
I, training with only 100 OCT images produces Dice
scores of 0.78 for the retinal layer and 0.21 for the
choroidal layer, which increases to 0.93 and 0.68, re-
spectively, when synthetic images are included. No-
tably, in Figure 6-II, the Dice score for the choroidal
layer improves by 0.47. In supervised learning, lim-
ited training data often hinders model performance on
new data. This limitation is evident in Figure 6-II,
where segmentation performance is suboptimal with
only OCT images. By supplementing the dataset with
synthetic images, we effectively increased the train-
ing data, resulting in a marked improvement in Dice
scores.
4 CONCLUSIONS
In this study, we synthesized retinal OCT images and
compared the predicted segmentation results obtained
by using both the synthetic and real OCT images
against those obtained by using only the real OCT im-
ages. The results showed that in the retinal layer, the
segmentation predicted were comparable to those ob-
tained when only OCT images were used for train-
ing. It was also found that the pixel values of the
sketch image used as input to DDPMs during image
synthesis should be based on the pixel values of the
training images of DDPMs to achieve higher-quality
synthesized images. This study demonstrates that in-
corporating images synthesized through DDPMs can
effectively enhance segmentation model training, par-
BIOIMAGING 2025 - 12th International Conference on Bioimaging
346

ticularly in cases with limited real images. Notably,
segmentation accuracy improved markedly in cases
where initial segmentation accuracy was lower, un-
derscoring the value of synthetic images for segmen-
tation model training in achieving robust model per-
formance.
REFERENCES
Denker, A., Schmidt, M., Leuschner, J., and Maass, P.
(2021). Conditional invertible neural networks for
medical imaging.
Dhariwal, P. and Nichol, A. (2021). Diffusion models beat
gans on image synthesis. Advances in Neural Infor-
mation Processing Systems, 34:8780–8794.
Eschweiler, D., Yilmaz, R., Baumann, M., Laube, I.,
Roy, R., Jose, A., Br
¨
uckner, D., and Stegmaier,
J. (2024). Denoising diffusion probabilistic mod-
els for generation of realistic fully-annotated mi-
croscopy image datasets. PLOS Computational Biol-
ogy, 20(2):e1011890.
Goodfellow, I., Pouget-Abadie, J., Mirza, M., Xu, B.,
Warde-Farley, D., Ozair, S., Courville, A., and Ben-
gio, Y. (2014). Generative adversarial nets. Advances
in Neural Information Processing Systems, 27.
Hajij, M., Zamzmi, G., Paul, R., and Thukar, L. (2022).
Normalizing flow for synthetic medical images gener-
ation. In 2022 IEEE Healthcare Innovations and Point
of Care Technologies (HI-POCT), pages 46–49.
He, Y. (2021). Retinal OCT image analysis using deep
learning. PhD thesis, Johns Hopkins University.
Heusel, M., Ramsauer, H., Unterthiner, T., Nessler, B., and
Hochreiter, S. (2017). Gans trained by a two time-
scale update rule converge to a local nash equilibrium.
Advances in neural information processing systems,
30.
Ho, J., Jain, A., and Abbeel, P. (2020). Denoising diffusion
probabilistic models. Advances in neural information
processing systems, 33:6840–6851.
Kuznetsova, A., Rom, H., Alldrin, N., Uijlings, J., Krasin,
I., Pont-Tuset, J., Kamali, S., Popov, S., Malloci, M.,
Kolesnikov, A., et al. (2020). The open images dataset
v4: Unified image classification, object detection, and
visual relationship detection at scale. International
Journal of Computer Vision, 128(7):1956–1981.
Lin, T.-Y., Maire, M., Belongie, S., Hays, J., Perona, P.,
Ramanan, D., Doll
´
ar, P., and Zitnick, C. L. (2014).
Microsoft coco: Common objects in context. In Com-
puter Vision–ECCV 2014: 13th European Confer-
ence, Zurich, Switzerland, September 6-12, 2014, Pro-
ceedings, Part V 13, pages 740–755. Springer.
Mukherkjee, D., Saha, P., Kaplun, D., Sinitca, A., and
Sarkar, R. (2022). Brain tumor image generation us-
ing an aggregation of gan models with style transfer.
Scientific reports, 12(1):9141.
M
¨
uller-Franzes, G., Niehues, J. M., Khader, F., Arasteh,
S. T., Haarburger, C., Kuhl, C., Wang, T., Han, T.,
Nolte, T., Nebelung, S., et al. (2023). A multimodal
comparison of latent denoising diffusion probabilistic
models and generative adversarial networks for medi-
cal image synthesis. Scientific Reports, 13(1):12098.
Parmar, G., Zhang, R., and Zhu, J.-Y. (2022). On aliased
resizing and surprising subtleties in gan evaluation. In
Proceedings of the IEEE/CVF Conference on Com-
puter Vision and Pattern Recognition, pages 11410–
11420.
Rezende, D. and Mohamed, S. (2015). Variational inference
with normalizing flows. In International conference
on machine learning, pages 1530–1538. PMLR.
Ronneberger, O., Fischer, P., and Brox, T. (2015). U-
net: Convolutional networks for biomedical image
segmentation. In Medical image computing and
computer-assisted intervention–MICCAI 2015: 18th
international conference, Munich, Germany, October
5-9, 2015, proceedings, part III 18, pages 234–241.
Springer.
Schmitt, J. M. (1999). Optical coherence tomography (oct):
a review. IEEE Journal of selected topics in quantum
electronics, 5(4):1205–1215.
Sigler, E., Randolph, J., Calzada, J., and Charles, S. (2014).
Smoking and choroidal thickness in patients over 65
with early-atrophic age-related macular degeneration
and normals. Eye, 28(7):838–846.
Wang, S., Li, C., Wang, R., Liu, Z., Wang, M., Tan, H.,
Wu, Y., Liu, X., Sun, H., Yang, R., et al. (2021).
Annotation-efficient deep learning for automatic med-
ical image segmentation. Nature communications,
12(1):5915.
Wang, Z. and Bovik, A. C. (2009). Mean squared error:
Love it or leave it? a new look at signal fidelity mea-
sures. IEEE signal processing magazine, 26(1):98–
117.
Wu, Y., He, W., Eschweiler, D., Dou, N., Fan, Z., Mi, S.,
Walter, P., and Stegmaier, J. (2024). Retinal oct syn-
thesis with denoising diffusion probabilistic models
for layer segmentation. In 2024 IEEE International
Symposium on Biomedical Imaging (ISBI), pages 1–5.
IEEE.
Xiao, Z., Kreis, K., and Vahdat, A. (2021). Tackling the
generative learning trilemma with denoising diffusion
gans. arXiv preprint arXiv:2112.07804.
Ye, X., He, S., Zhong, X., Yu, J., Yang, S., Shen, Y., Chen,
Y., Wang, Y., Huang, X., and Shen, L. (2023). Oimhs:
An optical coherence tomography image dataset based
on macular hole manual segmentation. Scientific
Data, 10(1):769.
Yilmaz, R., Eschweiler, D., and Stegmaier, J. (2024). An-
notated biomedical video generation using denoising
diffusion probabilistic models and flow fields. In In-
ternational Workshop on Simulation and Synthesis in
Medical Imaging, pages 197–207.
Zheng, C., Xie, X., Zhou, K., Chen, B., Chen, J., Ye, H.,
Li, W., Qiao, T., Gao, S., Yang, J., et al. (2020).
Assessment of generative adversarial networks model
for synthetic optical coherence tomography images
of retinal disorders. Translational Vision Science &
Technology, 9(2):29–29.
Evaluation of OCT Image Synthesis for Choroidal and Retinal Layer Segmentation Using Denoising Diffusion Probabilistic Models
347
