
Satellite Images and Spectral Vegetation Indices as Auxiliary Tools
to Monitoring Fuel Availability in Areas Prone to Wildfire:
Study Case in the Northern Region of Portugal
Bárbara Pavani-Biju
1,2,3 a
, José G. Borges
4b
Susete Marques
4c
and Ana C. Teodoro
1,2 d
1
Department of Geosciences, Environment and Land Planning, University of Porto,
Rua Campo Alegre, 687, 4169-007, Porto, Portugal
2
Earth Sciences Institute (ICT), Pole of the FCUP, University of Porto, 4169-007 Porto, Portugal
3
Forest Research Centre, School of Agriculture, University of Lisbon, Tapada da Ajuda, 1349-017 Lisbon, Portugal
4
Forest Research Centre, Associate Laboratory TERRA, School of Agriculture, University of Lisbon, Tapada da Ajuda,
1349-017 Lisbon, Portugal
Keywords: Remote Sensing, Wildfire, Spectral Vegetation Indices, Sentinel-2, Wildfire Fuels.
Abstract: Remote sensing data has led to the development of spectral indices for monitoring ecosystems, land surface
changes, and water quality. These indices are used in various applications, including agricultural and wildfire
monitoring, to understand vegetation cycles and disturbances. Wildfire research focuses on the effects of
extreme occurrences, and understanding forest ecology after severe events is crucial for evaluating forest
health. Vegetation Indices (VIs) are frequently used in forest and wildfire monitoring studies to account for
plant biophysical, biochemical, and physiological characteristics. Normalized Difference Vegetation Index
(NDVI), Normalized Burn Ratio (NBR), Normalized Difference Infrared Index (NDII), and Plant Senescence
Reflectance Index (PSRI) are indices used to assess vegetation conditions. VIs are valuable resources for
monitoring post-wildfire occurrences, as they measure biophysical changes and provide comprehensive
monitoring of the affected area, playing a crucial role in assessing the health of forests. Pre-wildfire vegetation
conditions monitoring is also important for implementing preventative measures in critical regions to increase
wildfire defense and identifying wildland fuels is crucial for improving fuel management actions. This
research aims to demonstrate the effectiveness of chosen VIs and fuel models as tools to assess pre-fire
conditions, enabling decision-makers to increase wildfire surveillance and landscape resilience in Vale do
Sousa, Portugal's northern area. Despite limitations, this approach is valuable, especially in terms of financial
or logistical constraints. Moreover, combining VIs with fuel hazard models can improve fuel reduction efforts.
1 INTRODUCTION
With the rapid development and accessibility of
remote sensing data, several spectral indices have
been developed to monitor ecosystems, land surface
changes, and water quality (Chughtai et al., 2021; Ma
et al., 2019). Spectral indices have been used in a
variety of applications, including agricultural and
wildfire monitoring, to better understand vegetation
cycles or disturbances (Zeng et al., 2022).
a
https://orcid.org/0000-0001-7721-008X
b
https://orcid.org/0000-0002-0608-5784
c
https://orcid.org/0000-0001-7922-5680
d
https://orcid.org/0000-0002-8043-6431
A significant percentage of wildfire research
focuses on the effects of extreme occurrences (Dos
Santos et al., 2020). Understanding the forest ecology
after severe events is crucial for evaluating forest
health (Avetisyan et al., 2023). The information
acquired may help stakeholders make key decisions
about post-fire restoration, management, and actions.
Most post wildfire assessments rely on field surveys,
which are expensive, time-consuming, and limited to
specific regions of the affected area (Fernandes et al.,
2006).
Pavani-Biju, B., Borges, J. G., Marques, S. and Teodoro, A. C.
Satellite Images and Spectral Vegetation Indices as Auxiliary Tools to Monitoring Fuel Availability in Areas Prone to Wildfire: Study Case in the Northern Region of Portugal.
DOI: 10.5220/0013249400003935
Paper published under CC license (CC BY-NC-ND 4.0)
In Proceedings of the 11th International Conference on Geographical Information Systems Theory, Applications and Management (GISTAM 2025), pages 51-60
ISBN: 978-989-758-741-2; ISSN: 2184-500X
Proceedings Copyright © 2025 by SCITEPRESS – Science and Technology Publications, Lda.
51

Vegetation indices (VIs) are frequently used in
forest and wildfire monitoring studies to account for
plant biophysical (detecting vegetation structure and
changes), biochemical (e.g., pigments, water), and
physiological (photosynthetic light use efficiency)
characteristics (Zeng et al., 2022). The Normalized
Difference Vegetation Index (NDVI) is one method
for assessing vegetation conditions (Rouse et al.,
1973). The Normalized Burn Ratio (NBR) and
Differenced Normalized Burn Ratio (dNBR) are used
to evaluate damage to vegetation and regeneration
(Roy et al., 2006). The Plant Senescence Reflectance
Index (PSRI) is used to measure chlorophyll
concentration (Merzlyak et al., 1999).
VIs are a valuable resource for monitoring post-
wildfire occurrences since they can measure
biophysical changes, allowing for comprehensive
monitoring of the affected area (Avetisyan et al.,
2023). Most common VIs products are easily
accessible through frameworks like Copernicus
Browser, which produces NDVI, Moisture Index, and
other metrics from Sentinel-2 data (ESA, 2024).
For example, NDVI can also be calculated from
Landsat imagery using Google Earth Engine
(Gorelick et al., 2017) or obtained as a product
directly from the United States Geological Survey
(U.S. Geological Survey, 2024). Other VIs can be
computed using Geographic Information System
(GIS) tools like QGIS, ArcGIS®, and SNAP (ESA,
2024; Esri & Environmental Systems Research
Institute, 2015; QGIS Association, 2024).
VIs are calculated as a ratio of certain bands,
differences, or derivatives of reflectance from sensor
imagery at specific spectral wavelengths (de Almeida
et al., 2020). Sentinel-2 constellation provides high-
resolution images for monitoring vegetation at visible
and infrared wavelengths, such as NDVI, which is
calculated by combining the Near Infrared (NIR) and
red bands.
With a rising rate of severe weather events
associated with climate change, VIs also play an
important role as reliable tools for assessing the
health of forests (Lee et al., 2024). As an example, the
forest in Portugal's northern region is particularly
vulnerable to severe wildfires, which are becoming
increasingly regular in this region (Marques et al.,
2017; San-Miguel-Ayanz et al., 2017; Teodoro &
Duarte, 2013).
As mentioned before, post-wildfire event
monitoring is crucial for forest management and
decision-making processes. However, studying
vegetation before a fire occurs is just as important as
assessing post-fire conditions, physical features, and
climate data for the affected area (Lee et al., 2024).
When stakeholders monitor pre-wildfire vegetation
conditions, they can implement preventative
measures in critical regions to increase wildfire
defense. VIs are helpful to evaluate the condition of
vegetation in terms of greenness (NDVI), humidity
(Normalized Difference Formulation Index - NDII),
and senescence (PSRI) (Bento-Gonçalves et al.,
2019b; Hardisky et al., 1983; Merzlyak et al., 1999).
Wildfire behavior and impacts have a connection
to the type of vegetation and its attributes; in the
words of Fernandes et al., (2006), describing wildland
fuels is crucial in order to improve fuel management
actions. This means that it is essential to classify the
study area's land use and land cover (LULC) in order
to identify vegetation cover type and structure, as well
as classify them according to their fire hazard
potential. When combined NDVI, PSRI and NDII to
identify fuel availability, with other information, such
as fuel hazard potential, they may assist in identifying
areas where fuel management should be prioritized
(Bento-Gonçalves et al., 2017).
The main objective of the present research is to
demonstrate the effectiveness of the chosen VIs as a
tool to assess pre-fire vegetation conditions. To assess
fuel availability, a vegetation fuel hazard model
developed for Portugal by Fernandes et al., (2006)
was considered. Enabling decision-makers to take
action to increase wildfire surveillance and landscape
resilience in Vale do Sousa, Portugal's northern area,
principally in critical areas such as the Wildland
Urban Interface.
2 MATERIALS AND METHODS
2.1 Study Area
The research area (Figure 1), a forested area with
about 29k ha, Vale do Sousa, which is situated in
northern Portugal, encompasses two Forest
Intervention Zones (ZIFs): Entre-Douro-e-Sousa and
Castelo de Paiva. Extreme fires have taking place in
the Vale do Sousa woodland area over the past few
years (Pavani-Biju et al., 2024). Large wildfires
occurred in 2017, burning more than 5000 hectares
and causing major environmental and financial
impacts (ICNF, 2017).
Vale do Sousa has also a large rural area, with
Eucalyptus (Eucalyptus globulus Labill) as the
dominating tree species, followed by Maritime Pine
(Pinus pinaster A.), small areas of other deciduous
oak such as cork oak (Quercus suber L.), and
pedunculate oak (Quercus robur L.), and riparian
areas.
GISTAM 2025 - 11th International Conference on Geographical Information Systems Theory, Applications and Management
52
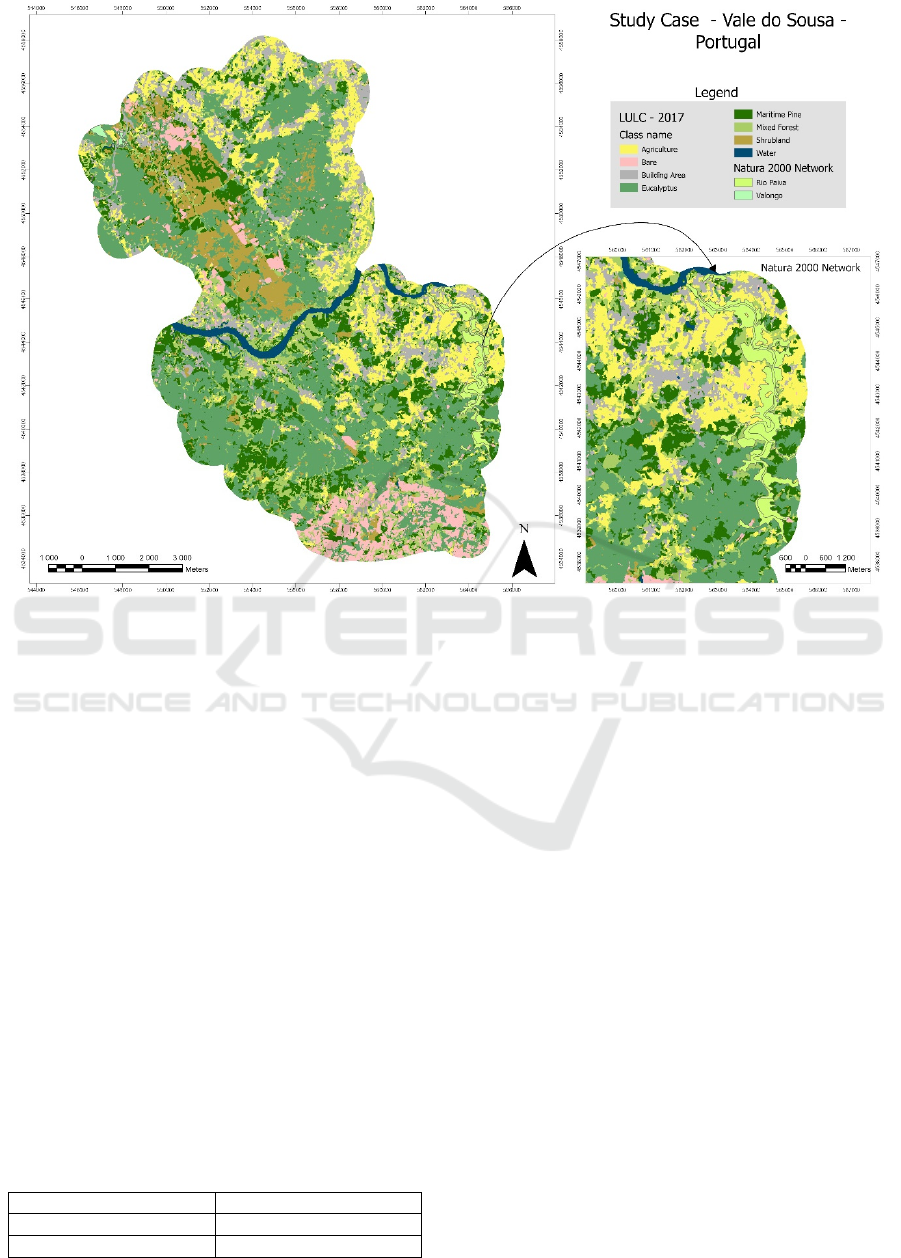
Figure 1: Study area Vale do Sousa.
However, the study area includes small portions of
the NATURA 2000 Network, a network of protected
areas that covers Europe's most valuable and
vulnerable landscapes and spans 27 European Union
Member States and in order to protect this area,
crucial actions need to be taken to mitigate large
wildfires harmful effects (CEE, 1992).
2.2 Data Acquisition and Analysis
For this study, images from Sentinel-2 between 2017
and 2018 were obtained at Copernicus Browser (table
1), based on the closest date the wildfire started, with
less than 5% cloud cover. First, images were pre-
processed from Level-1C (Top of Atmosphere –
TOA) to Level-2A (Bottom of Atmosphere - BOA)
resulting in orthorectified surface reflectance images,
at SNAP using the algorithm SEN2COR (ESA,
2024). After, VIs were produced for September and
October of 2017 in order to evaluate pre-fire
vegetation conditions.
Table 1: Sentinel-2 images collected for 2017 and 2018.
Sentinel Ima
g
es Date Wildfire started
Se
p
tember 02
nd
, 2017 Se
p
tember 02
nd
, 2017
October 12
th
, 2017 October 15
th,
of 2017
Furthermore, leaf-on multispectral images from
July 2017 and July 2018 were classified using
Machine Learning (ML)
, Support Vector Machine in
ArcGIS Pro® to determine changes between 2017
and 2018. To train the classifier 200 samples were
collected for each class were collected from the
thematic map of Land Use and Occupation (COS) of
Portugal, from 2015 and 2018. The same spatial
information were adapted to establish the accuracy
assessment points.
The COS is the most widely used national
reference cartography for land use issues. It is a
vector product updated every three years that
represents 83 thematic classes with a minimum
cartographic unit of 1 hectare based on the visual
interpretation of orthophoto maps. There are five
temporally consistent editions available (1995, 2007,
2010, 2015, and 2018), with an accuracy higher than
85% (SNIG, 2022).The sampling approach used was
random points. Approximately 500 points were
generated from the image. Further, the confusion
matrix and accuracy assessment were calculated.
Accuracy ranges from 0 to 1, with 1 representing
100% accuracy, and the Kappa statistic indicate the
overall accuracy of the classification. (McCoy &
Johnston, 2001).The landscape classes chosen to
Satellite Images and Spectral Vegetation Indices as Auxiliary Tools to Monitoring Fuel Availability in Areas Prone to Wildfire: Study Case
in the Northern Region of Portugal
53

perform the classification comprised agriculture, bare
land, building area, eucalyptus, maritime pine, mixed
forest (which includes riparian and non-riparian), and
shrubland. Additionally, the classified data from 2017
was utilized to classify fuel types and hazards (Table
2). According to the Portuguese custom fuel
model(Fernandes et al., 2006; Fernandes & Loureiro,
2021), fuel hazard values range from 1 (very low) to
5 (very high). Vegetated areas were classified on a
scale of 2 to 5 because the fuel model runs from 1 to
4. To encompass additional land cover types in the
classification, such as water, barren land, houses, and
agriculture, were assigned 1 because they are not
considered wildfire fuel.
Table 2: Sentinel-2 images collected for 2017 and 2018.
Fuel Types –
LULC classes
Fuel Models Fire Hazard
Building; Water;
Agriculture;
Bare
1 Very Low
Mixed Forest –
Riparian and
Non-Riparian
2 Low
Maritime Pine
Stands
3 Moderate
Shrubland –
Small
Vegetation
4 High
Eucalyptus
Stands
5 Very High
The VIs were estimated using the ArcGIS Pro®
indices tool, using pre-fire satellite images. In this
case, only the largest forest fires that occurred in
2017, designated as Burned Area 1 (BA1), which
occurred in September and Burned Area 2 (BA2),
which occurred in October (Table 1), were considered
in this analysis. Since both events are classified as
extreme wildfires because they covered more than
100 hectares, BA1 has 5,433 hectares, while BA2 has
666,3 hectares.
First, the NDVI was computed (1). Its values vary
from -1 to 1. Values near 0 represent bare, rocks,
sand, and snow. Low positive scores (0.2-0.4) are
associated with shrubs and grassland. Values greater
than 0.4 imply live green vegetation (Rouse et al.,
1973).
𝑁𝐷𝑉𝐼 =
( )
( )
(1)
The NDII (2) is sensitive to variations in the water
content of the plant canopy (Hardisky et al., 1983).
The value rises as water content rises. NDII
measurements can range from -1 to 1, with green
vegetation often falling between 0.02 and 0.6.
𝑁𝐷𝐼𝐼 =
( )
( )
(2)
The PSRI (3) assesses plant senescence
(Merzlyak et al., 1999). PSRI values, like NDVI,
range from -1 to 1. Although values ranging from -
0.1 to 0.2 suggest healthy vegetation, values greater
than 0.2 imply senescence and values less than -0.1
are associated with other landscape characteristics
such as water and buildings.
𝑃𝑆𝑅𝐼 =
( )
( )
(3)
While higher NDVI values suggest greater
greenness, PSRI indicates significant senescence. To
measure fuel availability, a composite using ArcGIS
Pro® composite band tool, of the three VIs was used.
To use PSRI in conjunction with NDVI and NDII, it
was multiplied by -1. Converting positive senescence
numbers to negative values. The compositions were
then sliced based on wildfire fuel availability, which
ranged from 1 to 5, based on what was reported by
Bento-Gonçalves et al., (2019a). Where 1 represents
very low, 2 represents low, 3 represents moderate, 4
represents high, and 5 represents extremely high
wildfire fuel source.
Vector data containing polygons from burned
regions BA1 and BA2 were obtained from the
Portuguese National Authority for Nature
Conservation (ICNF) and compared to VIs and
wildfire fuels data. This was conducted to see if the
spatial information generated corresponds to the
perimeter of the burned regions in official data. The
classified image from 2017 was then compared to
2018 data to determine the percentage change
following the occurrence of these extreme events.
3 RESULTS AND DISCUSSION
VIs were estimated for the two greatest burned areas
(BA1 and BA2) in Vale do Sousa before wildfire
occurrence. In terms of vegetation conditions for
BA1, the NDVI values (figure 2) range from -0.06 to
0.60, with a mean of 0.16 and a standard deviation of
±0.11. It is considered healthy vegetation when NDVI
values are higher than 0.40, and the average value
likely implies that the area is probably primarily
covered by shrubland. This class covers roughly
318,84 ha, accounting for 48% of the total area.
GISTAM 2025 - 11th International Conference on Geographical Information Systems Theory, Applications and Management
54
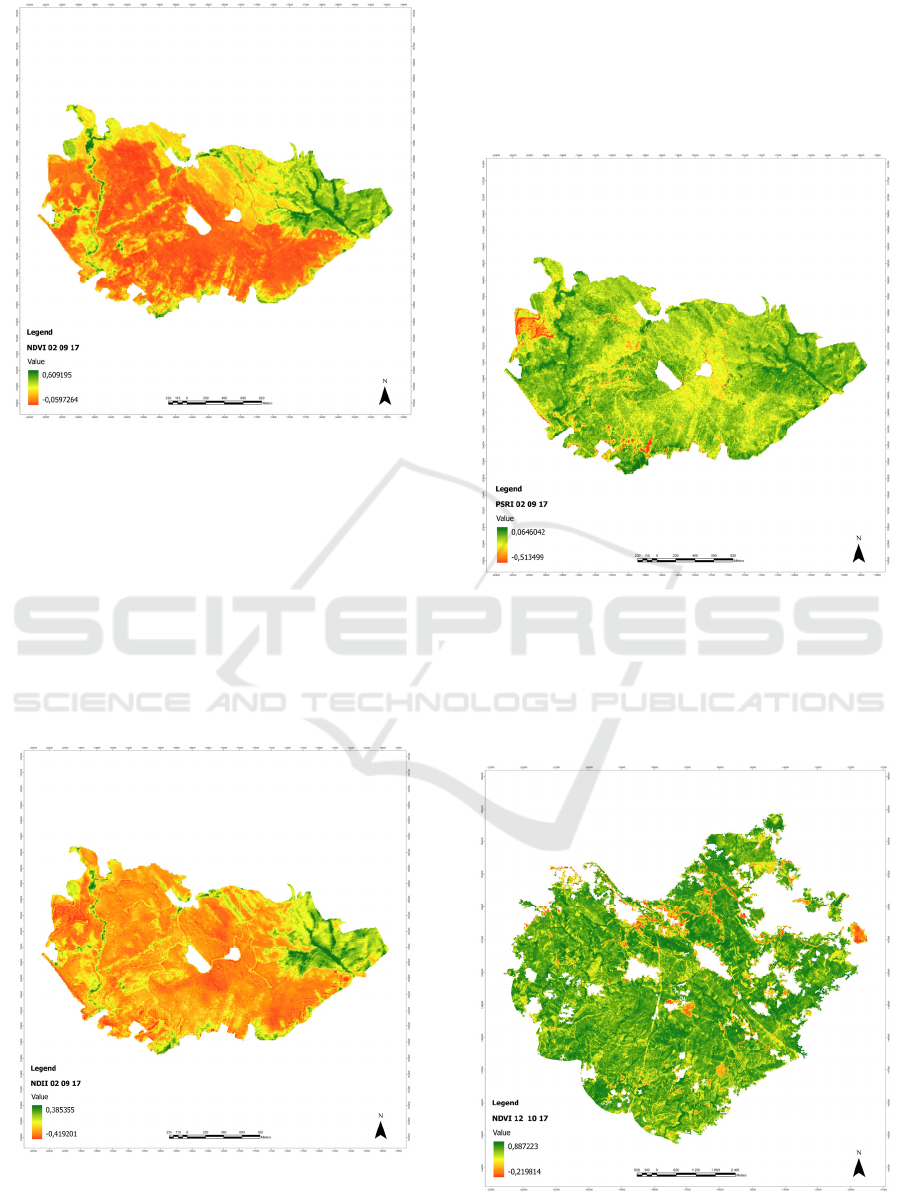
Figure 2: NDVI of BA1.
However, the area contains Eucalyptus, Maritime
Pine, and Mixed Forest stands, which is why the
NDVI maximum value is 0.60.
The humidity index, NDII (figure 3), ranges from
0.41 to 0.38, with a mean of -0.07 and a standard
deviation of ±0.09. As can be observed, moisture
content in September had a negative mean, and the
lowest values are below what is considered healthy
green vegetation (between 0.02 and 0.6), showing
that the vegetation of area BA1 was suffering from
water stress.
Figure 3: NDII of BA1
Regarding PSRI (figure 4), which was multiplied by
-1 as described in Bento-Gonçalves et al., (2019a),
negative values now signify senescence, and positive
values represent healthy vegetation. This was done to
create a composition that would evaluate wildfire fuel
availability for both areas of interest. PSRI scores
vary from -0.51 to 0.06, with an average of -0.08 and
a standard deviation of ±0.034.
Figure 4: PSRI of BA1.
This indicates that the majority of the vegetation
in region BA1 falls between the values considered as
healthy green vegetation. While a minor portion
exceeds the threshold for healthy vegetation, ranging
from -0.21 to -0.51.
Figure 5: NDVI of BA2.
Satellite Images and Spectral Vegetation Indices as Auxiliary Tools to Monitoring Fuel Availability in Areas Prone to Wildfire: Study Case
in the Northern Region of Portugal
55
Area BA2 is substantially larger than BA1,
covering around 5,433 hectares. The NDVI (Figure 5)
suggests that the vegetation is photosynthetically
active, as the values range from -0.21 to 0.88, with a
mean of 0.68 and a standard deviation of ±0.12. The
forested impacted area is mostly covered by
Eucalyptus, followed by Maritime Pine stands, and
small regions of mixed forest. The high average value
is most likely owing to the region's substantial
forested land.
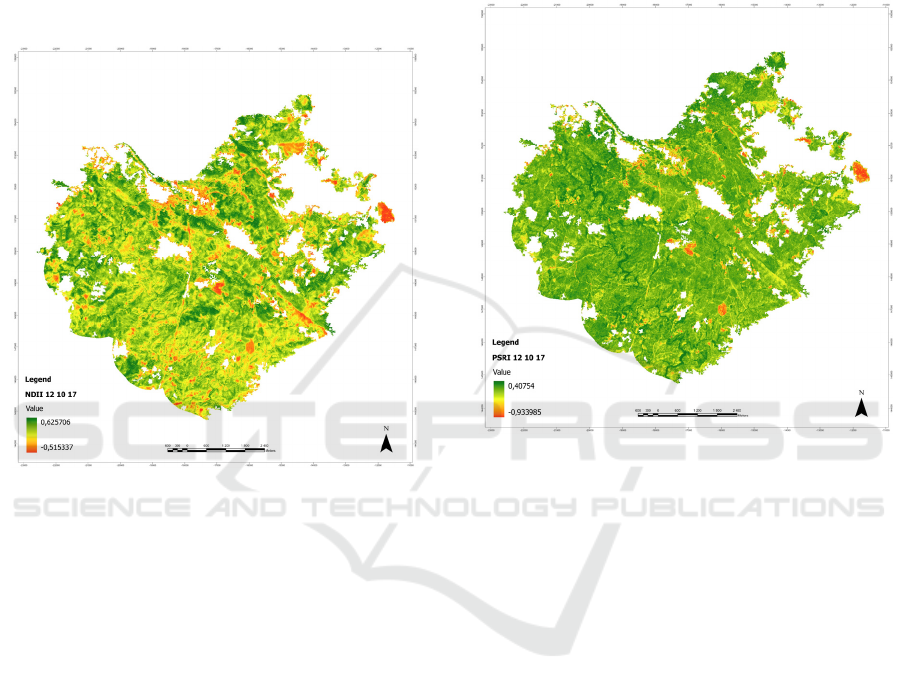
Figure 6: NDII of BA2.
The NDII (figure 6) minimum value is -0.51, and
the maximum value is 0.62, with a mean of 0.22 and
a standard deviation of ±0.14. This indicates that most
of the vegetation's humidity was closer to the
threshold of what is considered water stress than
healthy vegetation. Furthermore, a wildfire occurred
in October of 2017, when the weather was dry and
hot, which is unusual for this month (IPMA, 2017).
All of these elements most likely contributed to the
escalation of these events, which had ramifications
for Vale do Sousa's social, economic, and
environmental conditions.
Regarding the VI senescence (figure 7), the
PSRI's minimum value is -0.93, indicating extreme
senescence in some portion of the wooded area, the
highest value, which indicates healthy vegetation of
0.40. Although the negative mean value of -0.12 with
a standard deviation of ±0.06, is within what is
considered healthy vegetation, demonstrates the
effect of the high negative values on the mean,
changing the distribution of the data.
With this information, it was possible to compute
the fuel availability for both areas (Bento-Gonçalves
et al., 2019a). As shown in Figure 7, the fuel ranges
from very low to moderate in BA1 and very low to
very high in BA2. Nonetheless, only classes above 2
were considered wildfire fuel, implying that, while
both areas are primarily covered by class 1, there are
small patches of class 2 and 3 in BA1, and areas
classified from 2 to 5 in BA2, indicating that fuel was
available in both areas.
Figure 7: PSRI of BA2.
The ML method used to perform the classification of
the selected scenes of 2017 and 2018 was Support
Vector Machine, followed by the computation of a
confusion matrix and accuracy assessment. The
classification was evaluated using the Kappa Index,
which is greater than 0,8, indicating high accuracy of
the classification. Image from 2017 was classified to
identify the fuel type (Fernandes et al., 2006) and, as
a result, fuel hazards maps were created for both
areas, is also shown in Figure 7.
Aside from water stress, senescence, and
vegetation health, wildfires are also affected by
climate, slope and fuel hazards. Because fuel hazard
influences fire spread and magnitude. As can be seen,
a large section of BA1 is classified as 4 (High), with
214 ha classified as 5 (very high). Demonstrating how
forest cover types can have an important influence on
these events. It is worth mentioning that for this study,
the vegetation structure was not evaluated. Classes 3–
5 are related to Maritime Pine, shrubland, and
Eucalyptus. Maritime Pine was classified as 3
(moderate) because it has fewer stands than
Eucalyptus. Shrub was classed as 4 (High) because
the area with this classification is quite close to the
GISTAM 2025 - 11th International Conference on Geographical Information Systems Theory, Applications and Management
56
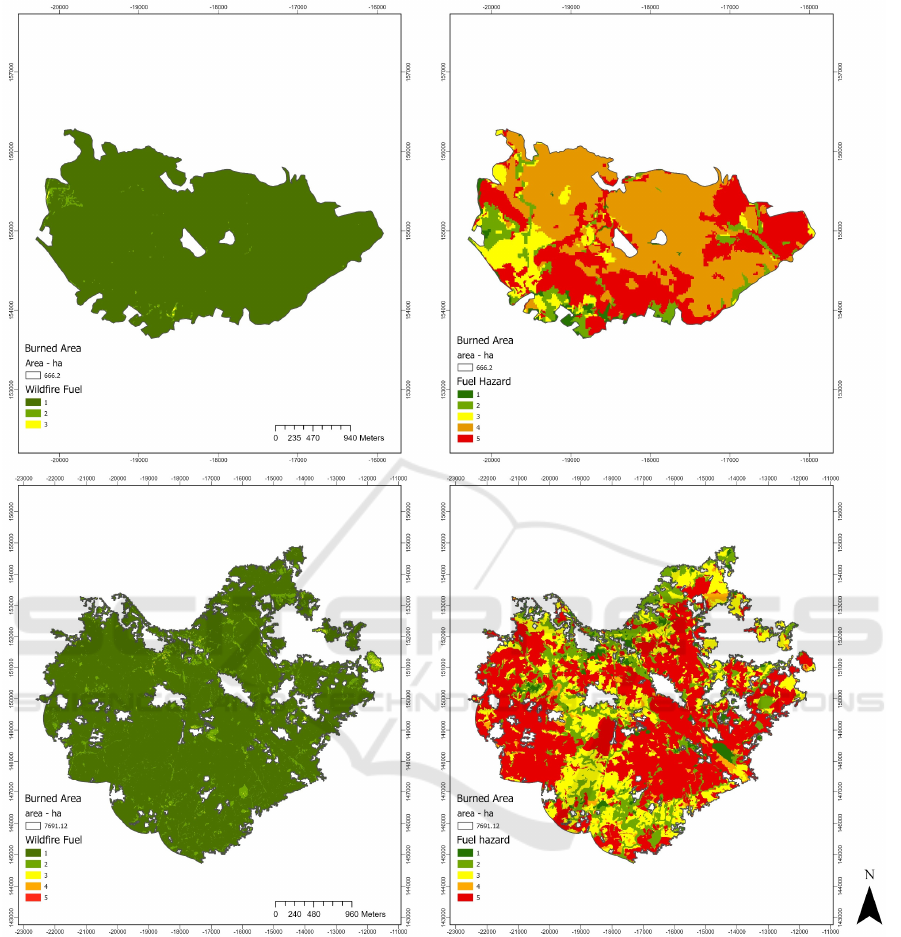
Figure 8: Wildfire fuel and Fuel hazard maps of 2017.
above-listed tree species' stands. According to
(Fernandes et al., 2006), the subcover can affect the
spread and fire hazard. Eucalyptus covers a larger
area in BA2, accounting for 52% of the entire area.
Maritime pine represents 23.4% of the total area.
When looking at VIs, it is easy to see lower or
extreme values of the forest's biophysical state. The
significant fuel availability and hazards in the study
area most likely contributed to the large fire. From
2017 to 2018, the change in landcover type of BA1
reveals a 35% decline in Eucalyptus and 52.5% in
maritime pine stands. These percentages reflect the
conversion of those categories to bare and shrubland
cover types in 2018.
There were no eucalyptus losses in the case of
BA2, but the same did not occur to maritime pine
stands. According to the changes observed between
2017 and 2018, the eucalyptus area had an increase of
1%. Whereas maritime pine lost nearly 90% of its
area. However, this loss may be due not only to
wildfire effects but also to harvesting, as Eucalyptus
plantations have increased in recent years in the study
Satellite Images and Spectral Vegetation Indices as Auxiliary Tools to Monitoring Fuel Availability in Areas Prone to Wildfire: Study Case
in the Northern Region of Portugal
57

area. It is worth noting that bare land and shrubland
cover types have also increased. They accounted for
barely 3% in 2017, but almost 30% in 2018.
As illustrated, all of these factors may influence
extreme wildfire outbreaks. Although fuel
availability with extreme value only accounts for a
small percentage of the region of interest, when
combined with VIs and fuel hazard score, it revealed
that those locations were prone to wildfires before
they occurred, both PSRI and fuel hazard classes had
higher values. When these remote sensing products
are combined, they can be valuable in pre-fire
management actions by identifying where
precautions should be taken to reduce losses caused
by wildfires, as shown in the change analysis.
One weakness of this study is the classification of
fuel hazards. Because forest structure was not
included in this study. In this manner, the Portuguese
fuel model was modified to be used with the classified
image. Classes were clustered, which could affect
hazardous classification, as the structure becomes
more important to fire behavior than tree species
(Fernandes et al., 2006). It is critical to determine the
structural types of the stands (closed, low, or tall;
open, low, or tall) if the objective is to develop a fuel
hazard model alongside VIs and fuel availability.
Despite this limitation, the primary goal of this
study was to identify available remote sensing-
derived products as support tools for fuel monitoring
and management throughout the wildfire season.
Since both wildfires occurred in areas where VIs
indicated great senescence, low water content and
less greenness, fuel availability could be identified in
the study region. With fuel availability classified as
low to medium in BA1, and low to very high in BA2.
The modified fuel hazards model for both
locations identified vast areas classified as high or
extremely high. It was possible to demonstrate that
the remote sensing-derived data information is
reliable in detecting alterations in forest biophysical
properties. Furthermore, this information could
potentially be employed as an auxiliary tool or as
information when carrying out the most effective fire
control measures in order to manage fuel loading
while decreasing fire severity and fulfil forest fire
management objectives.
4 CONCLUSIONS
Monitoring forest fire fuels is critical for
implementing best practices management approaches
to mitigate wildfire threats to forest ecosystems,
population health, and financial losses. With the
availability of a variety of satellite constellations,
such as Sentinel-2, VIs may be used as additional
tools to monitor fuel loading and hazards, hence
reducing the severity of wildfires.
Data is available and accessible across a variety
of platforms, and VIs resulting from remote sensing
imagery can be computed through different GIS tools.
Furthermore, decision-makers could employ these
spatial data to support forest fire prevention activities.
Despite its limitations, this approach remains a
significant resource, particularly in locations where
fieldwork is not feasible owing to financial or
logistical constraints. The attempts to reduce wildfire
fuel could be improved by looking at VIs along with
fuel hazard models and other management actions,
suggesting which regions need to be investigated
when selecting where the efforts to reduce fuels
should be invested.
Further studies should be performed to verify
additional burned areas from previous years utilizing
alternative satellite constellations such as Landsat. In
addition, other VIs should be explored to verify the
forest's biophysical composition. Although LiDAR
data was not used in this study, it is still an important
remote sensing data as it may provide information
about the structure of the forest in less time and assess
understory fuels.
ACKNOWLEDGEMENTS
Bárbara Pavani-Biju was financially supported by
Portuguese national funds through the Foundation for
Science and Technology I.P. (grant reference
number: 2022.13033.BD), Decision Support for the
Supply of Ecosystem Services under Global Change
(DecisionES) (grant agreement number:
101007950—H2020-MSCA-RISE-2020), and
through FCT – Fundação para a Ciência e Tecnologia,
I.P., in the framework of the ICT project with the
references UIDB/04683/2020 and UIDP/04683/2020.
José G. Borges and Susete Marques were
financially supported by Portuguese national funds
through the Foundation for Science and Technology
I.P. (project references UIDB/00239/2020 and
UIDP/00239/2020 of the Forest Research Centre and
DOI identifier 10.54499/UIDB/00239/2020 and
10.54499/UIDP/00239/2020 and the Associate
Laboratory Terra (TERRA LA/P/0092/2020. Susete
Marques was also funded by national funds through
the FCT, in the scope of Norma Transitória –
DL57/2016/CP13827CT15.
GISTAM 2025 - 11th International Conference on Geographical Information Systems Theory, Applications and Management
58

REFERENCES
Avetisyan, D., Stankova, N., & Dimitrov, Z. (2023).
Assessment of Spectral Vegetation Indices
Performance for Post-Fire Monitoring of Different
Forest Environments. Fire, 6(8). https://doi.org/10.33
90/fire6080290
Bento-Gonçalves, A., Vieira, A. A. B., Costa, M. R. M., &
Aranha, J. T. M. (2017). Wildfires Perspectives, Issues
And Challenges Of The 21st Century (1st ed., Vol. 1).
Nova Science Publisher.
Bento-Gonçalves, A., Vieira, A., Baptista, G., Rocha, J., &
Moura, S. (2019a). The 2017 Large Wildfire of Braga -
Evaluation of the Different Conditions of the Burned
Vegetation. Geo-Eco-Trop, 43, 627–640. chrome-
extension://efaidnbmnnnibpcajpcglclefindmkaj/https://
www.geoecotrop.be/uploads/publications/pub_434_13
.pdf
Bento-Gonçalves, A., Vieira, A., Baptista, G., Rocha, J., &
Moura, S. (2019b). The 2017 Large Wildfire of Braga -
Evaluation of the Different Conditions of the Burned
Vegetation. International Journal of Tropical Geology,
Geography and Ecology, 4(43), 627–640. chrome-
extension://efaidnbmnnnibpcajpcglclefindmkaj/https://
www.geoecotrop.be/uploads/publications/pub_434_13
.pdf
Chughtai, A. H., Abbasi, H., & Karas, I. R. (2021). A
review on change detection method and accuracy
assessment for land use land cover. Remote Sensing
Applications: Society and Environment, 22, 100482.
https://doi.org/10.1016/j.rsase.2021.100482
de Almeida, D. R. A., Stark, S. C., Valbuena, R., Broadbent,
E. N., Silva, T. S. F., de Resende, A. F., Ferreira, M. P.,
Cardil, A., Silva, C. A., Amazonas, N., Zambrano, A.
M. A., & Brancalion, P. H. S. (2020). A new era in
forest restoration monitoring. Restoration Ecology,
28(1), 8–11. https://doi.org/10.1111/rec.13067
DIRECTIVA 92/43/CEE DO CONSELHO Relativa à
Preservação Dos Habitats Naturais e Da Fauna e Da
Flora Selvagens (1992). https://eur-lex.europa.eu/Lex
UriServ/LexUriServ.do?uri=CONSLEG:1992L0043:2
0070101:PT:HTML#tocId6
Dos Santos, S. M. B., Bento-Gonçalves, A., Franca-Rocha,
W., & Baptista, G. (2020). Assessment of burned forest
area severity and postfire regrowth in chapada
diamantina national park (Bahia, brazil) using dnbr and
rdnbr spectral indices. Geosciences (Switzerland),
10(3). https://doi.org/10.3390/geosciences10030106
ESA. (2024). Copernicus Data Space Ecosystem Browser.
https://browser.dataspace.copernicus.eu/
ESA Sentinel Application Platform. (2024). SNAP (11.0.0).
http://step.esa.int/
Esri, & Environmental Systems Research Institute, I.
(2015). ArcGIS Resources. ArcGIS 10.3 Help.
http://resources.arcgis.com/en/help/
Fernandes, P., & Loureiro, C. (2021). Modelos de
combustível florestal para Portugal. https://www.
researchgate.net/publication/357812218
Fernandes, P., Luz, A., Loureiro, C., Ferreira-Godinho, P.,
& Botelho, H. (2006). Fuel modelling and fire hazard
assessment based on data from the Portuguese National
Forest Inventory. Forest Ecology and Management
,
234, S229. https://doi.org/10.1016/j.foreco.2006.08.2
56
Gorelick, N., Hancher, M., Dixon, M., Ilyushchenko, S.,
Thau, D., & Moore, R. (2017). Google Earth Engine:
Planetary-scale geospatial analysis for everyone.
Remote Sensing of Environment, 202, 18–27.
https://doi.org/10.1016/j.rse.2017.06.031
Hardisky, M. A., Klemas, V., & Smart, R. M. (1983). The
Influence of Soil Salinity, Growth Form, and Leaf
Moisture on-the Spectral Radiance of partina
alterniflora Canopies. Photogrammetric Engineering &
Remote Sensin, 49, 77–83.
ICNF. (2017). Relatório Extraordinário Provisório de
incêndios Florestais–2017.
IPMA. (2017). Resumo Climático. www.ipma.pt
Lee, K., van Leeuwen, W. J. D., Gillan, J. K., & Falk, D. A.
(2024). Examining the Impacts of Pre-Fire Forest
Conditions on Burn Severity Using Multiple Remote
Sensing Platforms. Remote Sensing, 16(10).
https://doi.org/10.3390/rs16101803
Ma, S., Zhou, Y., Gowda, P. H., Dong, J., Zhang, G.,
Kakani, V. G., Wagle, P., Chen, L., Flynn, K. C., &
Jiang, W. (2019). Application of the water-related
spectral reflectance indices: A review. In Ecological
Indicators (Vol. 98, pp. 68–79). Elsevier B.V.
https://doi.org/10.1016/j.ecolind.2018.10.049
Marques, S., Marto, M., Bushenkov, V., Mcdill, M., &
Borges, J. G. (2017). Addressing Wildfire Risk in Forest
Management Planning with Multiple Criteria Decision
Making Methods. https://doi.org/10.3390/su9020298
McCoy, Jill., & Johnston, K. (2001). Using ArcGIS Spatial
Analyst. In GIS by ESRI.
Merzlyak, M. N., Gitelson, A. A., Chivkunova, O. B., &
Rakitin, V. Y. (1999). Non-destructive optical detection
of pigment changes during leaf senescence and fruit
ripening.
Pavani-Biju, B., Borges, J. G., Marques, S., & Teodoro, A.
C. (2024). Enhancing Forest Site Classification in
Northwest Portugal: A Geostatistical Approach
Employing Cokriging. Sustainability (Switzerland),
16(15). https://doi.org/10.3390/su16156423
QGIS Association. (2024). QGIS.org. https://www.qgis.
org/
Rouse, J. W., Haas, R. H., & Deering, D. W. (1973).
Monitoring Vegetation Systems In The Great Plains
With Erts.
Roy, M., David, N. K., Danao, J. V., Baribault, H., Tian,
H., & Giorgetti, M. (2006). Remote Sensing of Fire
Severity: Assessing the Performance of the Normalized
Burn Ratio. IEEE Geoscience and Remote Sensing
Letters ·, 31(1), 112–120.
San-Miguel-Ayanz, J., Oom, D., Artes, T., Viegas, D. X.,
Fernandes, P., Faivre, N., Freire, S., Moore, P., Rego,
F., & Castellnou, M. (2017). Forest Fires in Portugal in
2017. In A. Casajus Valles, M. Marin Ferrer, K.
Poljanšek, & I. Clark (Eds.), Science for Disaster Risk
Management 2020: acting today, protecting tomorrow,
Satellite Images and Spectral Vegetation Indices as Auxiliary Tools to Monitoring Fuel Availability in Areas Prone to Wildfire: Study Case
in the Northern Region of Portugal
59

(1st ed., Vol. 1). Publications Office of the European
Union. https://doi.org/10.2760/571085
SNIG. (2022). Carta de Uso e Ocupação do Solo . Carta de
Uso e Ocupação Do Solo .
Teodoro, A. C., & Duarte, L. (2013). Forest fire risk maps:
A GIS open source application - a case study in Norwest
of Portugal. International Journal of Geographical
Information Science, 27(4), 699–720. https://doi.org/
10.1080/13658816.2012.721554
U.S. Geological Survey. (2024). Landsat Data Access.
https://www.usgs.gov/landsat-missions/landsat-data-
access
Zeng, Y., Hao, D., Huete, A., Dechant, B., Berry, J., Chen,
J. M., Joiner, J., Frankenberg, C., Bond-Lamberty, B.,
Ryu, Y., Xiao, J., Asrar, G. R., & Chen, M. (2022).
Optical vegetation indices for monitoring terrestrial
ecosystems globally. Nature Reviews Earth and
Environment, 3(7), 477–493. https://doi.org/10.1038/s4
3017-022-00298-5
GISTAM 2025 - 11th International Conference on Geographical Information Systems Theory, Applications and Management
60
