
EK-Means: Towards Making Ensemble K-Means Work for Image-Based
Data Analysis Without Prior Knowledge of K
Danping Niu
1,2,3
, Yuan Ping
2,3a
, Yujian Liu
2,3
, Fanxi Wei
1,3
and Wenhong Wu
1
1
School of Information Engineering, North China University of Water Resources and Electric Power, Zhengzhou, China
2
School of Information Engineering, Xuchang University, Xuchang, China
3
Henan Province Engineering Technology Research Center of Big Data Security and Applications, Xuchang, China
Keywords:
K-Means, DCAS, Clustering, Cluster Number, Malware Detection.
Abstract:
Despite its widespread application, K-means is significantly constrained by its dependence on the prior knowl-
edge and its limitations in handling irregular data patterns, which restrict its performance in practical scenarios
such as malware detection. To address these shortcomings, a novel EK-means algorithm is proposed. It in-
troduces a dynamic cluster adaptation strategy (DCAS) to leverage similarity and separation measures in the
pre-clustering phase to enable adaptive splitting and merging of clusters. The continuous refinement of cluster
compactness and centroid representativeness in this approach facilitates the discovery of clusters with arbitrary
shapes and the automatic discovery of the true number of clusters. Experimental results show that EK-means
achieves high clustering accuracy across multiple datasets, including Fashion-MNIST, Virus MNIST, BIG
2015, and Malimg. It notably excels in malware detection tasks, outperforming some existing mainstream
K-means enhancement methods.
1 INTRODUCTION
Cluster analysis groups data points to maximize intra-
cluster similarity and minimize inter-cluster similar-
ity. Traditional methods like K-means and its ex-
tensions are popular for their simplicity and effi-
ciency (Liu et al., 2023). However, they struggle with
determining the optimal number of clusters, K, and
assume spherical, evenly distributed clusters, which
limits their performance on non-spherical or irregular
data distributions (Ikotun et al., 2023).
Current methods address these limitations with
various strategies. Heuristic approaches, based on
empirical rules, are computationally efficient but of-
ten lack consistency and objectivity. Evaluation met-
rics, such as the Silhouette Coefficient (Bagirov et al.,
2023), Dunn Index (Sary et al., 2024), and Davies-
Bouldin Index (Sowan et al., 2023), assess cluster-
ing quality but are sensitive to initial conditions, often
yielding inconsistent results, especially with noisy or
complex data. Hypothesis testing methods, relying
on distributional assumptions (e.g., Gaussian), strug-
gle with data that deviates from these assumptions or
contains mixed structures (Zhao et al., 2008). Com-
mon techniques like the Silhouette Coefficient, and
information criteria (e.g., AIC/BIC) (Hajihosseinlou
a
Corresponding author: pingyuan@xcu.edu.cn
et al., 2024) perform well with spherical distributions
but fail to capture the complexities of non-spherical
or irregular data.
To address these challenges, we propose EK-
means, an ensemble K-means method that automat-
ically identifies the optimal number of clusters, en-
hancing performance on non-spherical and irregularly
distributed data. We also introduce DCAS, a strategy
that adapts the clustering process to the data’s dis-
tribution, improving flexibility and robustness. The
main contributions are as follows.
• The DCAS is designed to enable the automatic
discovery of the actual number of clusters through
splitting and merging operations.
• A similarity measure called the Local Compact-
ness Measure (LCM) is proposed, which is de-
signed to assess intra-cluster similarity and effec-
tively reduce computational complexity.
• By conducting a series of experiments, we
demonstrate that EK-means prove exceptional
accuracy and robustness across multiple image
datasets. Furthermore, it effectively discovers
the true number of clusters in malware detection,
achieving a high accuracy rate.
The paper is structured as follows: Section 2 re-
views advancements in K-means extensions to ad-
dress its limitations; Section 3 presents the EK-means
Niu, D., Ping, Y., Liu, Y., Wei, F. and Wu, W.
EK-Means: Towards Making Ensemble K-Means Work for Image-Based Data Analysis Without Prior Knowledge of K.
DOI: 10.5220/0013250100003899
In Proceedings of the 11th International Conference on Information Systems Security and Privacy (ICISSP 2025) - Volume 2, pages 575-584
ISBN: 978-989-758-735-1; ISSN: 2184-4356
Copyright © 2025 by Paper published under CC license (CC BY-NC-ND 4.0)
575

approach and its implementation; Section 4 provides
experimental results and compares EK-means with
other methods; Section 5 concludes with key findings.
2 RELATED WORK
K-means is a widely used unsupervised clustering
method valued for its efficiency and simplicity. How-
ever, it has several limitations: (1) the number of clus-
ters K must be predefined, which is often difficult in
real-world datasets (Jos
´
e-Garc
´
ıa and G
´
omez-Flores,
2016); (2) it assumes spherical clusters, limiting its
performance on irregular or non-spherical data (Daud
et al., 2024); (3) it is sensitive to outliers and noise,
which can distort results (Gan and Ng, 2017); and
(4) its sensitivity to initial centroid placement can
lead to local optima (Ahmed et al., 2020). To over-
come these challenges, various improvements have
been proposed to eliminate the need for predefined K
and to handle non-spherical clusters. The following
sections outline key advancements in these areas.
2.1 Addressing the Pre-Specified
Cluster Number Problem
In K-means clustering, determining the optimal num-
ber of clusters has been a key research challenge.
Early approaches used evaluation metrics like silhou-
ette scores and the elbow method to estimate cluster
counts. Teklehaymanot et al.(Teklehaymanot et al.,
2018) proposed a two-step method that estimates the
number of clusters while analyzing data structure, im-
proving model selection accuracy. However, these
methods are often limited by subjective thresholds
and specific data distributions, reducing their appli-
cability. Later, algorithms were developed to dynam-
ically adjust the number of clusters. For example, X-
means (Pelleg and Moore, 2000) uses BIC to evalu-
ate models with different K values, optimizing cluster
count. Fahim and Ahmed (Fahim, 2021) introduced
a DBSCAN-K-means hybrid, where DBSCAN esti-
mates cluster count and K-means refines intra-cluster
consistency. Yang et al. (Yang and Hussain, 2023) de-
veloped a K-means variant that autonomously identi-
fies the number of clusters. Rykov et al. (Rykov et al.,
2024) extended the elbow method with inertia-based
techniques for better cluster selection. However, these
methods still struggle with highly mixed datasets, re-
vealing room for improvement. Despite these ad-
vances, these methods often assume normality, incur
high computational costs in high-dimensional data,
and lack scalability, pointing to the need for further
optimization.
2.2 Strategies for Addressing
Non-Spherical Clusters
In K-means clustering, the assumption of spherical
clusters with equal variance limits its performance on
non-spherical or irregular data. Several approaches
have been proposed to improve K-means’ adaptabil-
ity to complex data distributions. Early methods like
DBSCAN (Deng, 2020) use density-based clustering
to detect irregular clusters and remove noise. How-
ever, DBSCAN struggles with varying cluster den-
sities and is sensitive to parameter settings. To ad-
dress this, GriT-DBSCAN (Huang et al., 2023) intro-
duces grid-based partitioning, improving efficiency
for high-dimensional datasets. Morii et al. (Morii and
Kurahashi, 2006) enhanced K-means by splitting and
merging decision regions to improve clustering ac-
curacy. However, these methods incur high compu-
tational costs and rely on selecting appropriate ker-
nels. G-means dynamically adjusts cluster bound-
aries based on Gaussian distribution assumptions and
statistical tests, enabling effective handling of irreg-
ular shapes and automatic determination of the clus-
ter count. The K-Multiple-Means method (Nie et al.,
2019) addresses non-convex clusters by introducing
multiple centroids, but it remains computationally ex-
pensive and sensitive to parameter settings. Despite
these advancements, these methods still struggle with
high-dimensional data and parameter sensitivity, indi-
cating the need for further optimization.
To overcome these limitations, EK-means has un-
dergone several key optimizations:
• EK-means automatically determines the cluster
count using an ensemble approach, removing the
need for a pre-specified K. It dynamically refines
the final number of clusters without assuming nor-
mality.
• EK-means enhances clustering performance on
complex data distributions without assuming
spherical clusters. By combining similarity and
dissimilarity metrics, it adaptively optimizes the
cluster structure, achieving high accuracy and ro-
bustness on non-spherical datasets.
3 EK-MEANS
In this section, we present the EK-means algorithm.
The process begins with an initial clustering step,
where the data is partitioned into multiple clusters
based on a predefined K value. Next, each cluster
undergoes decomposition using the DCAS strategy
to evaluate whether sub-clusters should be retained.
ICISSP 2025 - 11th International Conference on Information Systems Security and Privacy
576

After completing the decomposition phase, the al-
gorithm enters the merging stage, where DCAS is
again applied to determine whether clusters should
be merged. This iterative process of decomposition
and merging continues until no further changes are
needed. We first describe the adaptive strategy for
cluster handling, then provide a detailed explanation
of the decomposition and merging steps, followed by
an overview of the entire EK-means implementation.
3.1 DCAS
This section introduces the DCAS, focusing on how it
enables adaptive clustering by optimizing both intra-
cluster structure and inter-cluster relationships. As
shown in Figure 1, the algorithm evaluates the prox-
imity between clusters based on the similarity of data
points within them, determining whether to perform
splitting or merging operations. EK-means facilitates
the dynamic decomposition and merging of clusters
by incorporating inter-cluster compactness. The pri-
mary objective is to identify sparse regions within the
dataset and partition the data accordingly. This ap-
proach eliminates the reliance on initial parameters,
enabling real-time adjustments for a more accurate
representation of the data structure.
In our adaptive clustering strategy Algorithm 1,
we consider two clusters with centroids C
1
and C
2
,
and corresponding data point sets P
1
and P
2
. To
evaluate cluster compactness, we randomly sample
nn data points from each cluster, forming subsets
S
t
= {x
t1
, x
t2
, . . . , x
tn
}, where t ∈ {1, 2} is the cluster
index. The set T = {n, n
n
, n
s
} represents the hyperpa-
rameters used in EK-means. Here, n is the number of
randomly selected data points from a cluster, n
n
is the
number of nearest neighbors for each point, and n
s
is
the number of segments between the centroids of the
two clusters.
Definition 3.1 (Euclidean Distance). The Ed(·, ·) de-
notes the Euclidean distance. For two data points x
and y, their Euclidean distance Ed(x, y) is computed
as:
Ed(x, y) =
s
nu
∑
k=1
(x
k
− y
k
)
2
(1)
where x
k
and y
k
are the coordinates of x and y in the
k-th dimension, and nu is the number of dimensions.
Definition 3.2 (Nearest Neighbor). NN
b
(x
tj
) denotes
the b-th nearest neighbor of x
tj
, where x
tj
represents
the j-th randomly selected sample from cluster t.
For each randomly sampled data point x
tj
∈ S
t
in
cluster C
t
, we compute the average distance to its
nearest neighbors, denoted as D-ANND(t, j), as de-
fined below:
Definition 3.3 (Average Nearest Neighbor Distance).
Given a data point x
tj
and its nearest neighbors, the
average nearest neighbor distance D-ANND(t, j) is:
D-ANND(t, j) =
1
n
n
n
n
∑
b=1
Ed(x
tj
, NN
b
(x
tj
)) (2)
where x
tj
represents the j-th randomly selected sam-
ple from cluster t.
Definition 3.4 (LCM). The LCM(·) is the mean of
the average distances to the nearest neighbors of ran-
domly sampled points within a cluster, calculated as:
LCM(t) =
1
n
n
∑
j=1
D-ANND(t, j) (3)
where t is the cluster index, and j is the j-th randomly
selected point in that cluster.
The LCM captures the local density of points
within a cluster, providing a better reflection of re-
gional structure compared to global metrics like the
within-cluster sum of squares (WCSS). By evaluat-
ing the neighborhood distances of randomly sampled
points, we reduce computational complexity, ensur-
ing efficiency for large datasets. The sample size is
typically set to 5 points based on the total number of
data points in the cluster. This measure is key to un-
derstanding the local structure within each cluster and
evaluating the connectivity between clusters. After
calculating the compactness measure LCM, we divide
the line segment between the centroids C
1
and C
2
into
n
s
equally spaced points.
Definition 3.5 (Position of P
a
for Cluster Separation).
The position P
a
of a point along the line segment be-
tween the centroids C
1
and C
2
is defined as:
P
a
= C
1
+ a ·
|
C
1
−C
2
|
n
s
, a = 1, 2, . . . , n
s
− 1 (4)
where a denotes the index of the point along the seg-
ment, n
s
is the total number of segments, and |C
1
−C
2
|
is the distance between the centroids C
1
and C
2
.
For each point P
a
, a circle with radius d is drawn.
If all circles contain a data point, the clusters are con-
nected and merged; if any circle is empty, the clusters
remain separate.
3.2 Adaptive Decomposition and
Merging
We propose a clustering strategy based on inter-
cluster similarity and separability, designed to better
explore cluster structures and data point distribution.
This approach improves clustering accuracy and data
representation effectiveness.
EK-Means: Towards Making Ensemble K-Means Work for Image-Based Data Analysis Without Prior Knowledge of K
577
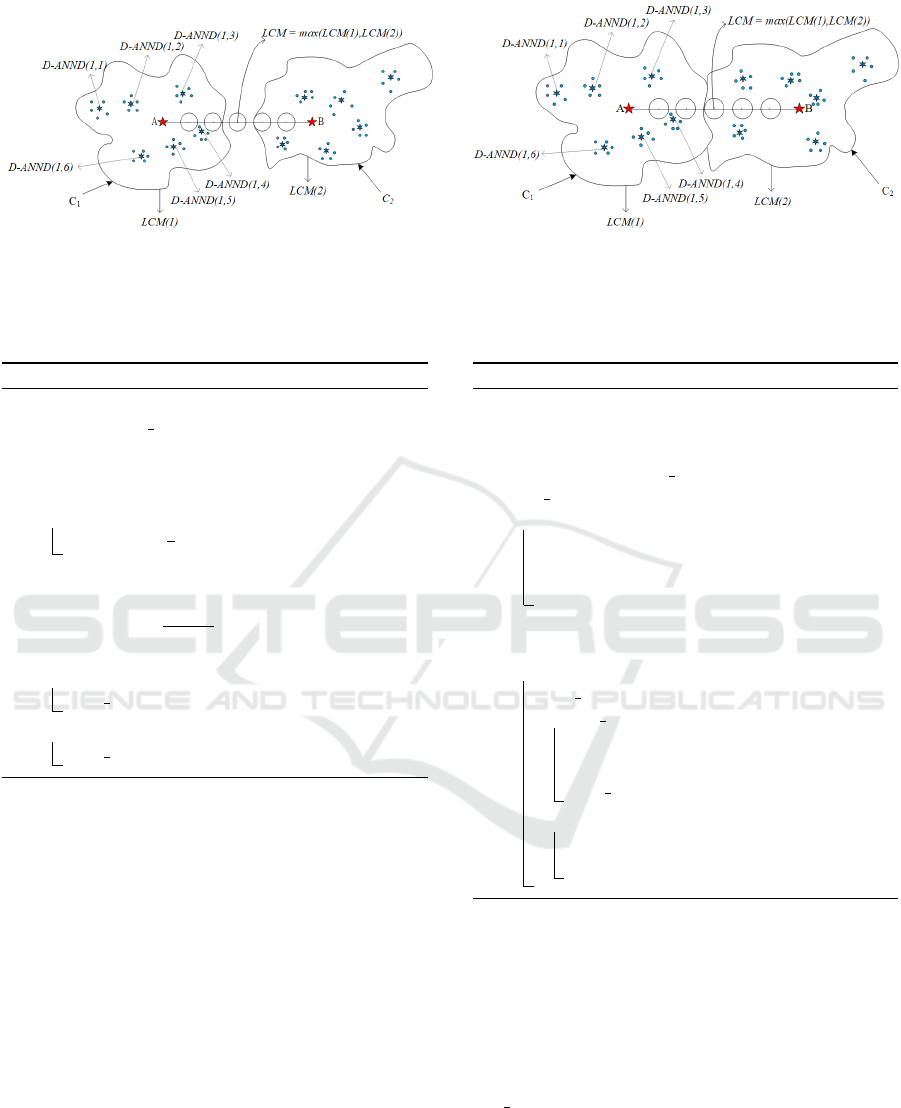
(a) Cluster decomposition (b) Cluster merging
Figure 1: Adaptive Cluster Decomposition and Merging: Random data points from each cluster are selected to calculate the
average distance to nearest neighbors, yielding LCM(1) and LCM(2) for clusters C1 and C2. The larger LCM value serves as
the partition threshold. A line AB is drawn between the centroids, and we check if any data points lie within a circle centered
at the partition point on AB. This decides whether to merge or split the clusters.
Algorithm 1: DCAS.
Input: C
1
,C
2
, P
1
, P
2
, T
Output: flag m
1 Randomly select n points:
S
t
← {x
t1
, x
t2
, . . . , x
tn
} from P
t
, where
t ∈ {1, 2}
2 for each set S
t
do
3 LCM(t) ←
1
n
∑
n
j=1
D-ANND(t, j)
4 LCM ← max(LCM(1), LCM(2))
5 Calculate
P
a
← C
1
+ a ·
|
C
1
−C
2
|
n
s
, a = 1, 2, . . . , n
s
− 1
6 if Circle(P
a
, LCM) is not empty for every a
then
7 flag m ← True
8 else
9 flag m ← False
In contrast to SMKM (Cap
´
o et al., 2022), EK-
means allows cluster splitting when the DCAS split-
ting criteria are satisfied and merging according to
the DCAS merging criteria. Our method dynamically
adjusts the value of K until the true number of clus-
ters is discovered. In comparison, SMKM determines
whether to split a cluster based on the reduction in
error from adding centroids, splitting only the clus-
ter that results in the maximum error reduction in
each iteration. SMKM performs only one split and
merge per iteration, maintaining a constant value of
K throughout the process.
3.2.1 Adaptive Cluster Decomposition
The adaptive cluster decomposition aims to uncover
substructures by iteratively splitting clusters, improv-
ing classification accuracy. The process is shown in
Algorithm 2. In this phase, we enhance cluster com-
pactness by applying the 2-means algorithm to each
Algorithm 2: Adaptive Cluster Decomposition(ACD).
Input: Set of centroids , C = {c
1
, . . . , c
K
},
and its corresponding clustering,
P = {P
1
, . . . , P
K
}, T
Output: C
′
, P
′
, flag
EK
1 flag EK ← False
2 for each cluster P
i
in P do
3 Apply 2-means clustering:
4 {P
1
i
, P
2
i
} ← P
i
5 {c
1
i
, c
2
i
} ← c
i
6 C
′
=
/
0
7 P
′
=
/
0
8 for each cluster P
i
in P do
9 flag m ← DCAS(c
1
i
, c
2
i
, P
1
i
, P
2
i
)
10 if f lag m is False then
11 C
′
← C
′
∪ {c
1
i
, c
2
i
}
12 P
′
← P
′
∪ {P
1
i
, P
2
i
}
13 flag EK ← True
14 else
15 C
′
← C
′
∪ {c
i
}
16 P
′
← P
′
∪ {P
i
}
cluster P
i
, dividing it into two sub-clusters P
1
i
and
P
2
i
. The connectivity of these sub-clusters is evalu-
ated using an adaptive clustering strategy. If any circle
(centered at each sub-cluster point) is empty, it indi-
cates spatial separation between the sub-clusters. This
suggests that decomposition improves cluster com-
pactness and classification performance. The variable
flag EK tracks whether a split was performed during
the iteration.
3.2.2 Adaptive Cluster Merging
The cluster merging operation enhances compactness
and accuracy by identifying structural relationships
ICISSP 2025 - 11th International Conference on Information Systems Security and Privacy
578

Algorithm 3: Adaptive Cluster Merging(ACM).
Input: C, P, T , flag EK
Output: C
′
, P
′
, flag EK
1 merge found ← True
2 Inter ← 0
3 while merge found = True do
4 merge found ← False
5 if Inter = 1 then
6 C ← C
′
,P ← P
′
7 Inter ← 1
8 K
kn
= |C|
9 while merge found = False do
10 (i, j) ← argmin
1≤i< j≤K
kn
D
ij
11 flag m ← DCAS(c
i
, c
j
, P
,
P
j
)
12 if flag mandD
ij
̸= INF then
13 merge found ← True
14 flag EK ← True
15 c
′
←
|P
i
|·c
i
+|P
j
|·c
j
|P
i
|+|P
j
|
16 C
′
← (C \ {c
i
, c
j
}) ∪ {c
′
}
17 P
i
← P
i
∪ P
j
18 P
′
← (P \ {P
j
}) ∪ {P
i
}
19 else
20 D
ij
← INF
between clusters. In this phase, clusters that are close
and structurally similar are merged to optimize the
overall cluster shape and centroid representativeness.
The merging process, based on density and spatial re-
lationships, is detailed in Algorithm 3. The flag EK
tracks whether a merge occurred during the iteration,
and |C| represents the number of centroids in the cen-
troid set C.
Definition 3.6 (Euclidean Distance Between Clus-
ters). The distance between two clusters i and j is the
Euclidean distance between their centroids C
i
and C
j
:
D(i, j) = ∥C
i
−C
j
∥ (5)
where C
i
and C
j
are the centroids of clusters i and j,
and ∥ · ∥ denotes the Euclidean norm.
Definition 3.7 (Closest Pair of Clusters). The indices
(i
∗
, j
∗
) correspond to the pair of clusters i and j that
have the smallest Euclidean distance between their
centroids. These indices are defined as:
(i
∗
, j
∗
) = argmin
i, j
D(i, j) (6)
where D(i, j) is the Euclidean distance between the
centroids C
i
and C
j
of clusters i and j, respectively.
The algorithm begins by identifying the most sim-
ilar pair of clusters, minimizing the distance D(i, j)
to find the target for merging. An adaptive strategy
evaluates their connectivity: if both clusters contain
data points within the circles, they are considered con-
nected and should be merged. The centroid of the
merged cluster is calculated as a weighted average of
the original centroids, with weights based on the num-
ber of data points in each cluster. The algorithm then
iterates, checking for the closest pair of clusters un-
til no further merges are possible. This merging pro-
cess prioritizes intra-cluster density and spatial rela-
tionships. By using LCM and assessing spatial split
points, the algorithm ensures merging only occurs
when sufficient connectivity exists, avoiding unnec-
essary merges. The process continues until no more
clusters can be merged, improving clustering quality,
representativeness, and compactness.
3.3 EK-Means Implementation
The EK-means method dynamically optimizes clus-
ters through adaptive strategies, including cluster
splitting and merging operations. The overall imple-
mentation steps are outlined in Algorithm 4.
The EK-means method begins with pre-clustering
using the K-means++ algorithm (Arthur and Vassil-
vitskii, 2007) with an initial number of clusters K
start
to obtain the initial centroid set C and cluster set P.
This forms the basis for further adaptive adjustments.
Next, the algorithm proceeds with cluster decompo-
sition and merging. Initially, each cluster is itera-
tively split into two sub-clusters using the 2-means
algorithm. The connectivity of these sub-clusters is
then assessed through adaptive strategies to determine
whether they should be retained. After all clusters
have been split, the merging operation begins. During
merging, the closest pair of clusters is identified, and
their connectivity is evaluated. If the merging criteria
are not met, the next closest pair is considered. When
merging conditions are satisfied, the clusters are com-
bined, and the centroid set C is updated. The pro-
cess repeats until no pairs of clusters meet the merg-
ing conditions. After merging, the splitting and merg-
ing steps continue until the stopping criteria are met,
such as when no further changes occur, or the max-
imum number of iterations is reached. Finally, the
EK-means algorithm outputs the optimized centroid
set C and cluster set P.
4 EXPERIMENTS
We conducted experiments on several image datasets
to evaluate EK-means’ capability in category dis-
covery and clustering performance. The section be-
EK-Means: Towards Making Ensemble K-Means Work for Image-Based Data Analysis Without Prior Knowledge of K
579

Algorithm 4: EK-means.
Input: Dataset D, Initial number of clusters
K
start
, flag EK, max iter, T
Output: C , P
1 Pre-clustering:
C, P ← K-means++(D, K
start
)
2 i iter ← 0
3 Adaptive Strategy:
4 while f lag EK or i iter < max iter do
5 i iter ← i iter + 1
6 C
′
, P
′
, flag EK ← ACD(C, P, T )
7 C, P, flag EK ← ACM(C
′
, P
′
, T, flag EK)
gins with a description of the experimental setup and
datasets, followed by an analysis of the algorithm’s
stability. Finally, we assess EK-means’ performance
in malware analysis tasks.
4.1 Experimental Setup
The experiments consist of three main assessments:
• Stability Analysis: This experiment evaluates the
clustering accuracy and stability of EK-means us-
ing the Fashion MNIST dataset.
• Malware Analysis: This experiment evaluates
the performance of EK-means in malware detec-
tion using the Virus MNIST (Noever and No-
ever, 2021), BIG 2015 (Ronen, 2018), and Mal-
img (Nataraj et al., 2011) datasets.
To compare with EK-means, we selected K-
means++, X-means, CDKM (Nie et al., 2022), and
SMKM. K-means++, CDKM, and SMKM require
a predefined number of clusters, while X-means
and EK-means can autonomously determine the final
cluster count based on the initial K.
Our experiments assess clustering accuracy and
the ability to identify true categories using clustering
accuracy as the evaluation metric. Clustering accu-
racy evaluates the consistency between predicted and
true labels. The formula for clustering accuracy is
given by:
Accuracy =
Correctly identified class
Total number of class
× 100 (7)
All experiments were performed on a machine
running Windows 11 with a 3.20 GHz CPU and 128
GB RAM.
4.2 Experimental Datasets
To evaluate the algorithm’s performance, we selected
four representative datasets: Fashion MNIST, Virus
MNIST, BIG 2015, and Malimg, covering tasks like
image clustering and malware analysis. Table 1
presents key statistics for each dataset. Feature ex-
traction is performed using the pre-trained ResNet18
model (He et al., 2015), where images are resized,
normalized, and converted into n-dimensional feature
vectors for analysis.
4.3 Stability Analysis
This section evaluates the stability of EK-means using
the Fashion MNIST dataset, focusing on two aspects:
(1) the consistency of accuracy and final cluster num-
ber K across multiple experiments, and (2) the effect
of different initial K values on the final cluster count
and accuracy.
As shown in Figure 2a, with an initial K = 16,
the final cluster number obtained by EK-means re-
mains close to the actual class count (10) across re-
peated tests, indicating its ability to capture the in-
trinsic structure of the data effectively. In contrast,
X-means exhibits more significant fluctuations in K,
with final values consistently above 25, deviating sig-
nificantly from the ground truth. Figure 2b presents
the accuracy of both algorithms under the same initial
K. EK-means maintains a high accuracy above 0.9
with minimal variance, significantly outperforming
X-means, whose accuracy remains below 0.5 with no-
ticeable instability. These results demonstrate the ro-
bustness and consistency of EK-means over multiple
trials. Furthermore, Figure 3a and 3b explore the in-
fluence of varying initial K values. In Figure 3a, EK-
means shows minimal variation in the final K, which
consistently approximates the true number of classes.
X-means produces significantly fluctuating K values,
often far exceeding the ground truth. Figure 3b plots
the clustering accuracy against the initial K. EK-
means achieves stable, high accuracy across different
initial K values, while X-means exhibits larger varia-
tions, with accuracy consistently below 0.5. In sum-
mary, EK-means demonstrates strong robustness and
adaptability, achieving consistent performance across
multiple trials and under varying initial conditions.
4.4 Malware Analysis
We conducted experiments on the Virus MNIST, BIG
2015, and Malimg datasets to evaluate the effective-
ness of EK-means in malware analysis. Figure 4 illus-
trates the clustering performance of different meth-
ods under varying initial K values, including the fi-
nal number of clusters obtained by EK-means and X-
means.
ICISSP 2025 - 11th International Conference on Information Systems Security and Privacy
580
Table 1: Description of the benchmark datasets.
Datasets
Dataset Description
Dims Size # of Classes Task description
Fashion MNIST 10 70000 10 Image clustering
Virus MNIST 10 50000 10 Malware analysis
BIG2015 10 10868 9 Malware analysis
Malimg 25 9339 25 Malware analysis
(a)Variation of final K values (Initial K = 20). (b)Variation of accuracy results (Initial K = 20).
Figure 2: Comparison of EK-means and X-means clustering performance with initial K=20.
(a)Final K values with varying initial K. (b)Accuracy results with varying initial K.
Figure 3: Analysis of clustering results with varying initial K values.
Virus-MNIST. In the Virus MNIST dataset, when
the initial K deviates from the actual number of
clusters, the accuracy of K-means++, CDKM, and
SMKM drops significantly, with optimal performance
only when K matches the true number of categories.
In contrast, EK-means maintains high accuracy across
various initial K values, with the final K value remain-
ing close to the actual one, demonstrating its robust-
ness. On the other hand, X-means exhibits substan-
tial fluctuations in the final K value, often exceeding
the actual number of categories. This results in a no-
ticeable drop in accuracy, indicating its limitations in
identifying actual categories in malware datasets.
BIG 2015. On the BIG 2015 dataset, EK-means
performed exceptionally well. As shown in Fig-
ure 4(d), when the initial K exceeds 12, the final K
value is close to the true number of categories, signif-
EK-Means: Towards Making Ensemble K-Means Work for Image-Based Data Analysis Without Prior Knowledge of K
581
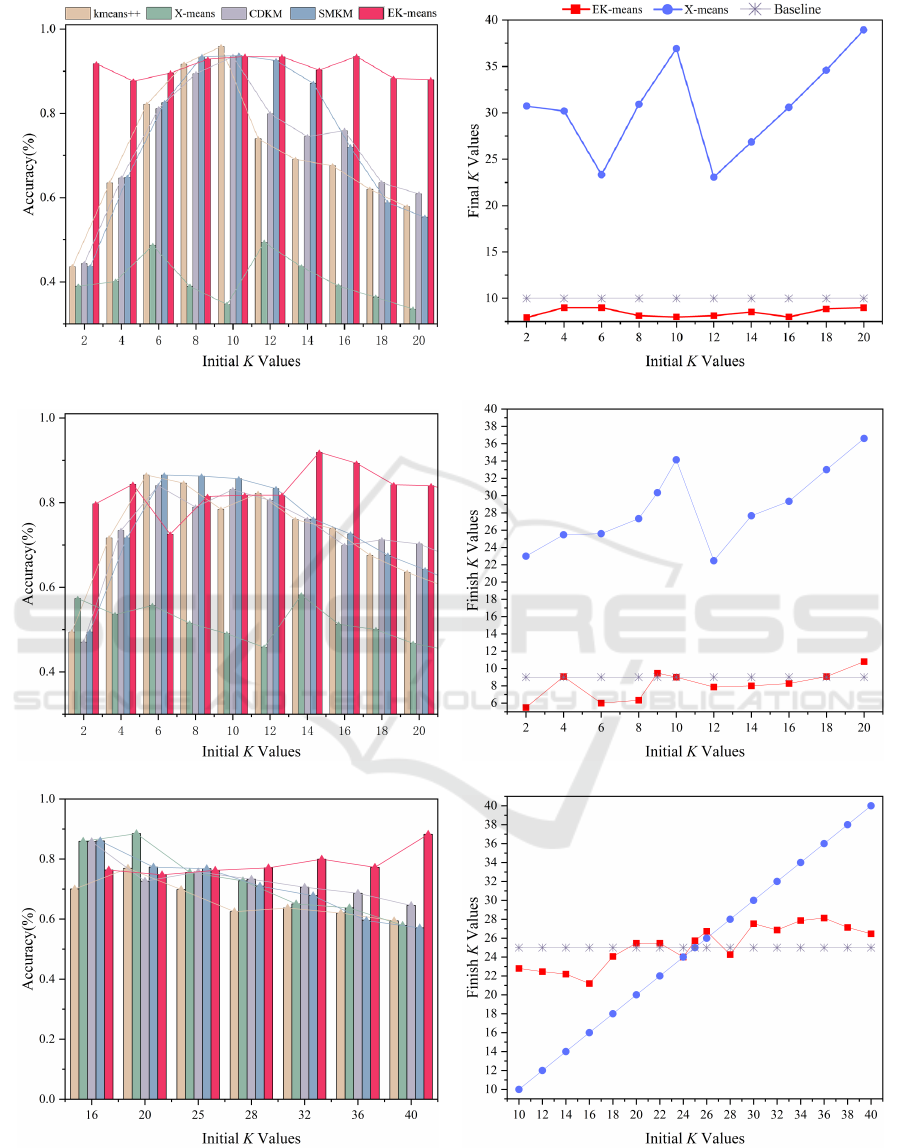
(a) Virus-MNIST (b) Virus-MNIST
(c) BIG 2015 (d) BIG 2015
(e) Malimg (f) Malimg
Figure 4: Malware analysis.
ICISSP 2025 - 11th International Conference on Information Systems Security and Privacy
582

icantly improving clustering accuracy. This improve-
ment is attributed to EK-means’ strategy of only split-
ting clusters that meet certain criteria, ensuring more
effective partitioning. When the initial K is too low,
each cluster may contain multiple categories, lead-
ing to poor partitioning and increased computational
complexity. Conversely, a larger initial K value en-
ables finer partitioning from the start, improving clus-
ter purity and the accuracy of subsequent splits.
Malimg. On the Malimg dataset, as the initial K
value increases, the accuracy of EK-means improves,
similar to the findings on the BIG 2015 dataset, which
also exhibits significant class imbalance. A larger ini-
tial K value proves crucial for improving the cluster-
ing effectiveness of EK-means when there are sub-
stantial differences between categories. With smaller
initial K values, clusters often contain a mix of cate-
gories, and the disparities in class sizes make it diffi-
cult to differentiate rare categories effectively, leading
to a final K value smaller than the true number of cat-
egories. To improve EK-means’ performance on the
Malimg dataset, using a larger initial K value is rec-
ommended. Additionally, K-means++, CDKM, and
SMKM maintain relatively stable accuracy, with mis-
classification having minimal impact on overall accu-
racy even when the K value exceeds the actual number
of categories due to class imbalance.
We employed (batch) MMRS sampling (John-
son et al., 1990) to select data points for calculat-
ing intra-cluster compactness, addressing the class
imbalance issue, and ensuring the accuracy of the
compactness measure. Overall, EK-means outper-
forms other methods in malware analysis, demon-
strating its robustness and accuracy in handling com-
plex datasets. Through its adaptive clustering strat-
egy, EK-means effectively identifies actual categories
and adapts to varying data distributions, establishing
itself as a powerful tool in malware analysis.
5 CONCLUSIONS
The traditional k-means is widely used for various
clustering tasks due to its simplicity, computational
efficiency, ease of implementation, and scalability.
However, it struggles with automatically discovering
the true number of clusters and is ineffective in han-
dling non-spherical and irregularly distributed clus-
ters. To address these issues, we propose a novel
method, EK-means. By incorporating DCAS and
LCM, EK-means enables the automatic decomposi-
tion and merging of clusters, effectively overcoming
these challenges. Experimental results demonstrate
that the method discovers the true number of clusters
in irregular datasets and performs excellently in mal-
ware detection tasks. However, EK-means still ex-
hibits certain limitations when dealing with categories
with significant substructures. Future research will
aim to improve methods for handling complex cat-
egories, enhance computational efficiency, improve
adaptability to heterogeneous data, and optimize the
algorithm’s applicability and performance.
ACKNOWLEDGEMENTS
This work is supported by the National Natu-
ral Science Foundation of China under Grant no.
62162009, the Key Technologies R&D Program of
He’nan Province under Grant No. 242102211065,
Postgraduate Education Reform and Quality Im-
provement Project of Henan Province under Grant
Nos. YJS2024AL112 and YJS2024JD38, the Inno-
vation Scientists and Technicians Troop Construc-
tion Projects of Henan Province under Grant No.
CXTD2017099, and the Scientific Research Innova-
tion Team of Xuchang University under Grant No.
2022CXTD003.
REFERENCES
Ahmed, M., Seraj, R., and Islam, S. M. S. (2020). The
k-means algorithm: A comprehensive survey and per-
formance evaluation. Electronics, 9(8):1295.
Arthur, D. and Vassilvitskii, S. (2007). k-means++: the ad-
vantages of careful seeding. In ACM-SIAM Sympo-
sium on Discrete Algorithms.
Bagirov, A. M., Aliguliyev, R. M., and Sultanova, N.
(2023). Finding compact and well-separated clus-
ters: Clustering using silhouette coefficients. Pattern
Recognition, 135:109144.
Cap
´
o, M., Mart
´
ınez, A. P., and Lozano, J. A. (2022). An
efficient split-merge re-start for the $k$k-means algo-
rithm. IEEE Trans. Knowl. Data Eng., 34:1618–1627.
Daud, H. B., binti Zainuddin, N., Sokkalingam, R., Museeb,
A., Inayat, A., et al. (2024). Addressing limitations
of the k-means clustering algorithm: outliers, non-
spherical data, and optimal cluster selection. AIMS
Mathematics, 9(9):25070–25097.
Deng, D. (2020). Dbscan clustering algorithm based on
density. In 2020 7th International Forum on Electri-
cal Engineering and Automation (IFEEA), pages 949–
953.
Fahim, A. (2021). K and starting means for k-means algo-
rithm. Journal of Computational Science, 55:101445.
Gan, G. and Ng, M. K.-P. (2017). K-means clustering with
outlier removal. Pattern Recognition Letters, 90:8–14.
EK-Means: Towards Making Ensemble K-Means Work for Image-Based Data Analysis Without Prior Knowledge of K
583

Hajihosseinlou, M., Maghsoudi, A., and Ghezelbash, R.
(2024). A comprehensive evaluation of optics, gmm
and k-means clustering methodologies for geochem-
ical anomaly detection connected with sample catch-
ment basins. Geochemistry, page 126094.
He, K., Zhang, X., Ren, S., and Sun, J. (2015). Deep resid-
ual learning for image recognition. 2016 IEEE Con-
ference on Computer Vision and Pattern Recognition
(CVPR), pages 770–778.
Huang, X., Ma, T., Liu, C., and Liu, S. (2023). Grit-dbscan:
A spatial clustering algorithm for very large databases.
Pattern Recognition, 142:109658.
Ikotun, A. M., Ezugwu, A. E., Abualigah, L., Abuhaija,
B., and Heming, J. (2023). K-means clustering al-
gorithms: A comprehensive review, variants analysis,
and advances in the era of big data. Information Sci-
ences, 622:178–210.
Johnson, M. E., Moore, L. M., and Ylvisaker, D. (1990).
Minimax and maximin distance designs. Journal of
statistical planning and inference, 26(2):131–148.
Jos
´
e-Garc
´
ıa, A. and G
´
omez-Flores, W. (2016). Auto-
matic clustering using nature-inspired metaheuristics:
A survey. Applied Soft Computing, 41:192–213.
Liu, H., Chen, J., Dy, J., and Fu, Y. (2023). Transform-
ing complex problems into k-means solutions. IEEE
Transactions on Pattern Analysis and Machine Intel-
ligence, 45(7):9149–9168.
Morii, F. and Kurahashi, K. (2006). Clustering by the k-
means algorithm using a split and merge procedure.
In SCIS & ISIS SCIS & ISIS 2006, pages 1767–1770.
Japan Society for Fuzzy Theory and Intelligent Infor-
matics.
Nataraj, L., Karthikeyan, S., Jacob, G., and Manjunath,
B. S. (2011). Malware images: visualization and au-
tomatic classification. In Visualization for Computer
Security.
Nie, F., Wang, C.-L., and Li, X. (2019). K-multiple-means:
A multiple-means clustering method with specified k
clusters. In Proceedings of the 25th ACM SIGKDD
international conference on knowledge discovery &
data mining, pages 959–967.
Nie, F., Xue, J., Wu, D., Wang, R., Li, H., and Li, X.
(2022). Coordinate descent method for kk-means.
IEEE Transactions on Pattern Analysis and Machine
Intelligence, 44(5):2371–2385.
Noever, D. A. and Noever, S. E. M. (2021). Virus-mnist: A
benchmark malware dataset. ArXiv, abs/2103.00602.
Pelleg, D. and Moore, A. W. (2000). X-means: Extend-
ing k-means with efficient estimation of the number
of clusters. In Proceedings of the Seventeenth In-
ternational Conference on Machine Learning, ICML
’00, page 727–734, San Francisco, CA, USA. Morgan
Kaufmann Publishers Inc.
Ronen, R. (2018). Microsoft malware classification chal-
lenge. arXiv preprint arXiv:1802.10135.
Rykov, A., de Amorim, R. C., Makarenkov, V., and Mirkin,
B. (2024). Inertia-based indices to determine the num-
ber of clusters in k-means: An experimental evalua-
tion. IEEE Access, 12:11761–11773.
Sary, R. A., Satyahadewi, N., and Andani, W. (2024). Ap-
plication of k-means++ with dunn index validation of
grouping west kalimantan region based on crime vul-
nerability. BAREKENG: Jurnal Ilmu Matematika dan
Terapan, 18(4):2283–2292.
Sowan, B., Hong, T.-P., Al-Qerem, A., Alauthman, M., and
Matar, N. (2023). Ensembling validation indices to
estimate the optimal number of clusters. Applied In-
telligence, 53(9):9933–9957.
Teklehaymanot, F. K., Muma, M., and Zoubir, A. M.
(2018). Bayesian cluster enumeration criterion for
unsupervised learning. IEEE Transactions on Signal
Processing, 66(20):5392–5406.
Yang, M.-S. and Hussain, I. (2023). Unsupervised multi-
view k-means clustering algorithm. IEEE Access,
11:13574–13593.
Zhao, Z., Guo, S., Xu, Q., and Ban, T. (2008). G-means: a
clustering algorithm for intrusion detection. In Inter-
national Conference on Neural Information Process-
ing, pages 563–570. Springer.
ICISSP 2025 - 11th International Conference on Information Systems Security and Privacy
584
