
MAESTRO: A Full Point Cloud Approach for 3D Anomaly Detection
Based on Reconstruction
Remi Lhoste
1,2
, Antoine Vacavant
2
and Damien Delhay
1
1
O2game, 60200, Compi
`
egne, France
2
Institut Pascal, Universit
´
e Clermont Auvergne, UMR 6602 UCA/SIGMA/CNRS, 63171 Aubi
`
ere, France
{remi, damien}@o2game.com, antoine.vacavant@uca.fr
Keywords:
Anomaly Detection, 3D, Point Cloud, Reconstruction.
Abstract:
3D anomaly detection is a critical task in industrial manufacturing, for maintaining product quality and opera-
tional safety. However, many existing methods function more as 2.5D anomaly detection techniques, primarily
relying on image data and underexploiting point clouds. These methods often face challenges related to real
scenarios, and reliance on large pretrained models or memory banks. To address these issues, we propose
MAESTRO, a Masked AutoEncoder Self-Supervised Through Reconstruction Only. This novel 3D anomaly
detection method based solely on point cloud reconstruction without utilizing pretrained models or memory
banks, making it particularly suitable for industrial applications. Experiments demonstrate that our method
can outperform previous state-of-the-art methods on several classes of the MVTec 3D-AD dataset (Bergmann
et al., 2022).
1 INTRODUCTION
Anomalies, or deviations from the normality, can
signify defects or irregularities that alterate product
quality in industrial manufacturing. Detecting these
anomalies is essential to maintain high production
standards.
To address these needs, we present MAESTRO
(Masked AutoEncoder Self-Supervised Through
Reconstruction Only), an approach that leverages
point cloud reconstruction. This method offers sev-
eral advantages: it visually highlights discrepancies
between trained and actual outputs, providing clear
indications of anomalies. This is particularly bene-
ficial in industrial environments where operators re-
quire precise insight into defect locations. We opted
for 3D point cloud rather than 2.5D approaches,
which typically rely on image data and can miss the
full geometric details of objects. 3D point clouds en-
able a more comprehensive view, enabling more ac-
curate detection of anomalies, especially those related
to geometry and structure that are difficult to capture
in 2D images. Additionally, 3D point cloud can offer
a simple approach where one sensor cannot be suf-
ficient to identify anomalies. An anomaly captured
between two calibrated sensors and transformed in a
point cloud offer can unique perspective of the defect.
By avoiding the need for memory banks, our method
reduces storage requirements and enhances feasibility
for various industrial applications.
In summary, MAESTRO harnesses the power of
3D point cloud reconstruction to deliver a robust,
more interpretable, and industrially viable solution
for anomaly detection. This approach addresses the
critical need for surface defect identification, con-
tributing to improved quality assurance in manufac-
turing processes. Our contributions are summarized
as follows: (i) A reconstruction-only model for 3D
point cloud anomaly detection; (ii) A multi-scale ap-
proach to capture more information from the point
cloud; (iii) We propose a model that requires no mem-
ory bank and eliminates the need for large pretrained
models.
2 RELATED WORKS
2D Anomaly Detection. Research in the indus-
trial anomaly detection field has been widely stud-
ied with MVTec 2D-AD (Bergmann et al., 2019)
and VisA datasets (Zou et al., 2022). (Zavrtanik
et al., 2021) approaches using autoencoders have
also shown promise in this area. (Deecke et al.,
2019) use a generative adversarial network (GAN)
and (Rudolph et al., 2021) propose normalizing flows
Lhoste, R., Vacavant, A. and Delhay, D.
MAESTRO: A Full Point Cloud Approach for 3D Anomaly Detection Based on Reconstruction.
DOI: 10.5220/0013250500003912
Paper published under CC license (CC BY-NC-ND 4.0)
In Proceedings of the 20th International Joint Conference on Computer Vision, Imaging and Computer Graphics Theory and Applications (VISIGRAPP 2025) - Volume 2: VISAPP, pages
717-724
ISBN: 978-989-758-728-3; ISSN: 2184-4321
Proceedings Copyright © 2025 by SCITEPRESS – Science and Technology Publications, Lda.
717
models (Rezende and Mohamed, 2015) to generate
the sample without defects. Unsupervised represen-
tation learning (Hyun et al., 2024) methods achieve
great results based on pretrain models and memory
banks to compare features. Similarly, student teacher
models (Bergmann et al., 2020) are trained on top of
pretrained network features.
3D Anomaly Detection. The field of 3D anomaly
detection has lagged behind its 2D counterpart, pri-
marily due to the scarcity of real-world datasets and
the structural complexity of point clouds. The pre-
dominant approach involves using RGB-Depth(2.5D)
data from the MVTec 3D-AD dataset (Bergmann
et al., 2022), which includes only a single RGB-
D view for each object. Point cloud models ma-
jorly leverage features for detection. For instance,
BTF (Horwitz and Hoshen, 2022) integrates hand-
crafted features with the PatchCore method, while
3D-ST (Bergmann and Sattlegger, 2023) employ
a student-teacher framework to compare features.
M3DM (Wang et al., 2023) analyze both 3D and RGB
features before fusing them. CPMF (Cao et al., 2023)
transforms the point clouds into synthetic 2D images
from multiple viewpoints. Reg 3D-AD (Liu et al.,
2023) utilizes 3D registration before comparing it to a
memory sample. Shape-guided (Chu et al., 2023) use
PointNet (Qi et al., 2017) and Neural Implicit Func-
tion to explore and compare the 3D shape information
via a memory bank. IMRNET (Li et al., 2023) recon-
structs a portion of the point cloud and calculates the
difference between the reconstruction and the input
using features acquired by Point-MAE (Pang et al.,
2022) and a memory bank. R3D-AD (Zhou et al.,
2024) employ a diffusion model to reconstruct the
point cloud without defects. Most of these models use
memory banks to compare features, enhancing their
anomaly detection capabilities. However, they have
large memory occupancies with increasing number of
samples.
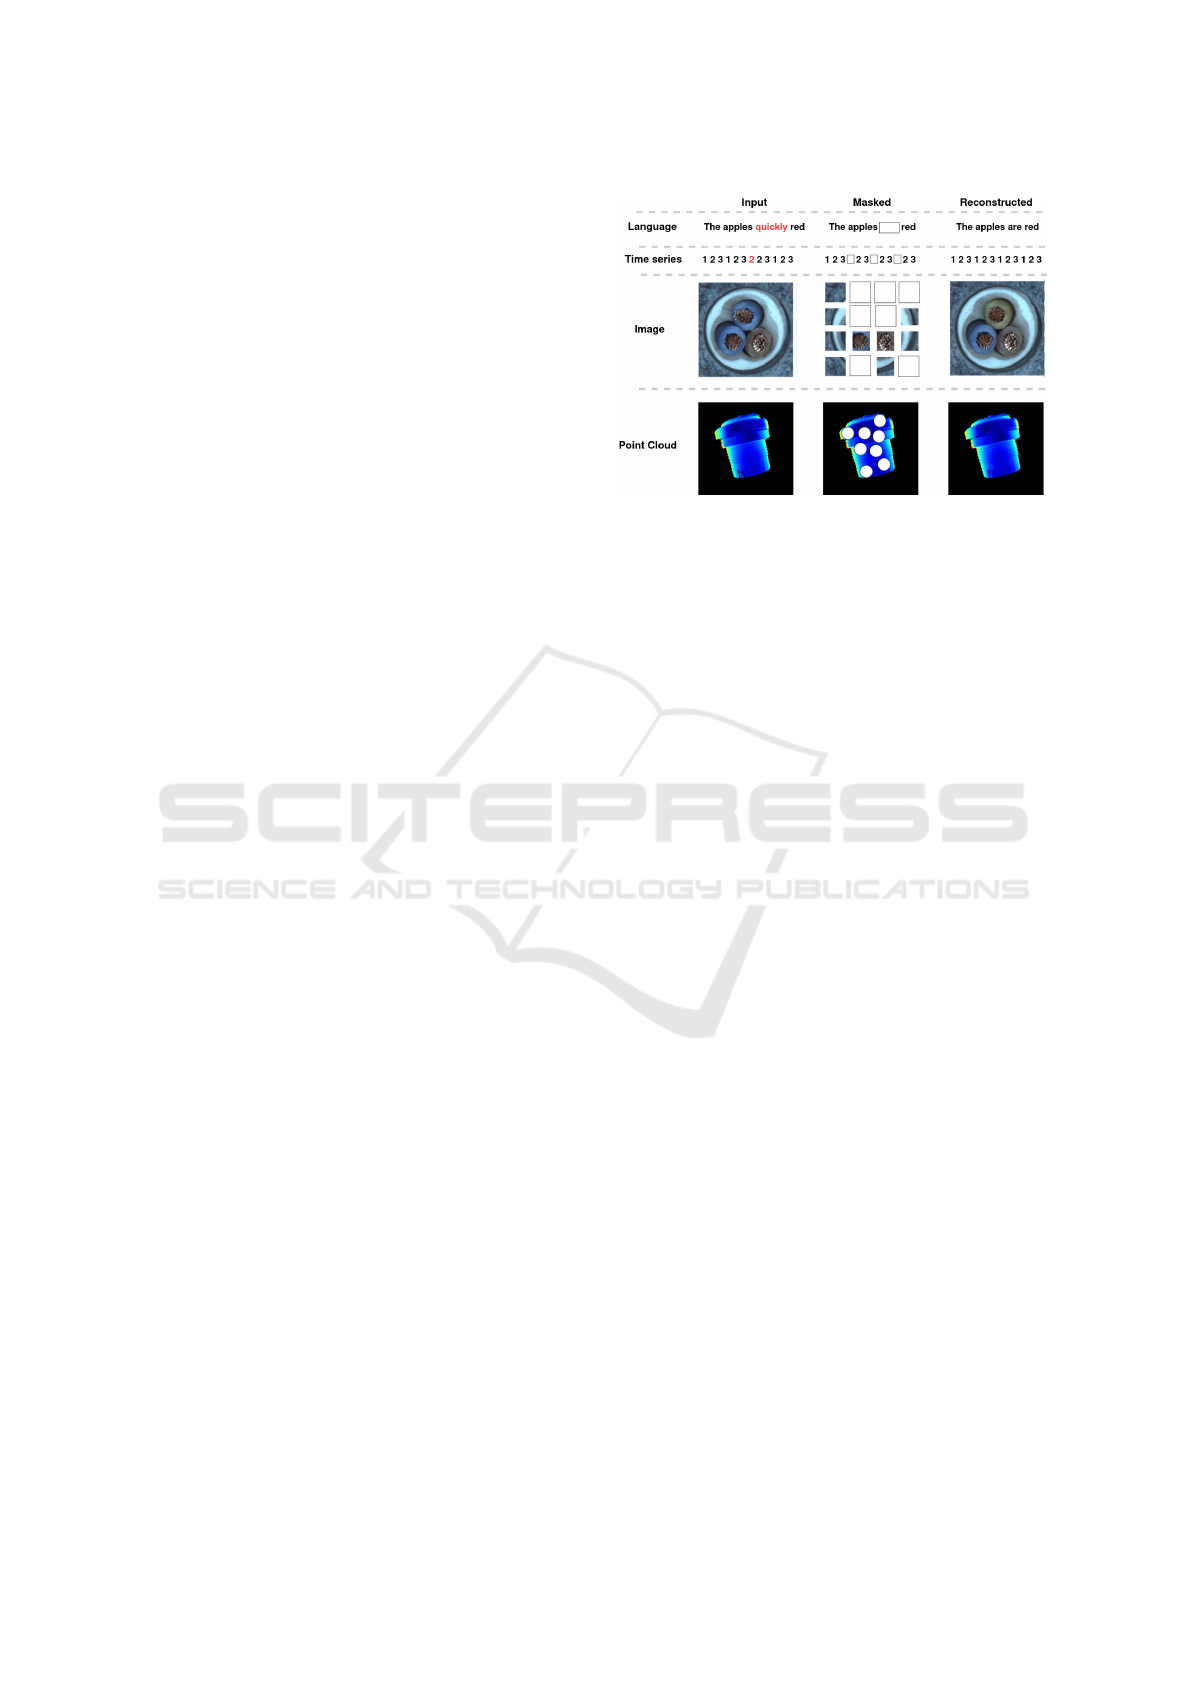
Reconstruction-Based Models. The reconstruc-
tion process in anomaly detection is similar across all
algorithms that aim to reconstruct the initial shape.
The underlying hypothesis is that the model will re-
construct the data without any defect as illustrated
in Figure 1. Reconstruction models are widely used
for 2D anomaly detection relying mainly on auto-
encoders (Zavrtanik et al., 2021), variational en-
coders (Hyun et al., 2024), or GANs (Rudolph et al.,
2021). To compute an unsupervised anomaly score,
the most straightforward method involves measur-
ing the difference between the reconstruction and
the original input (Gong et al., 2019). (An and
Figure 1: Masked auto-encoder technique for anomaly de-
tection. In this approach, a portion of the input data is
masked, and the auto-encoder is trained to reconstruct the
missing segments from the remaining unmasked data. The
wire images are from the MVTec 2D-AD (Bergmann et al.,
2019).
Cho, 2015) define a reconstruction probability for
every image pixel and compute an anomaly score.
(Bergmann et al., 2018) utilize the SSIM (Wang et al.,
2004) as a loss function to adopt a structural approach
based on patches. Additional information, such as la-
tent space (Abati et al., 2019) and intermediate acti-
vations (Kim et al., 2019) is sometimes incorporated
to enhance detection.
Reconstruction of 3D point clouds is compara-
tively less explored. PointNet (Qi et al., 2017) is
the first model to use an encoder-decoder for point
cloud processing. Nethertheless, PointNet cannot ac-
curately capture local features. DGCNN (Wang et al.,
2019) employs EdgeConv which focuses on the re-
lationship between points using a dynamical graph
model. In the task of point cloud completion, where
the goal is to fill in missing data in a partial point
cloud, PCN (Yuan et al., 2018) utilizes PointNet (Qi
et al., 2017) to reconstruct the point clouds, Fold-
ingNet (Yang et al., 2018) leverages the 2D convo-
lution network to transform a 2D plane into 3D. Ad-
vanced methods like Point MAE (Pang et al., 2022)
use transformers with a patch-based approach. Sim-
ilarly to PointMAE, 3DMambaComplete (Li et al.,
2024a) achieves a linear complexity with transform-
ers, effectively completing long sequences. All of
these transformers approach are inspired from NLP
tasks.
3 OUR METHOD
Figure 2 presents the overall pipeline of our MAE-
STRO model. MAESTRO is based on four mod-
ules, NE(Noise Estimation), RS(Random Sampling),
VISAPP 2025 - 20th International Conference on Computer Vision Theory and Applications
718
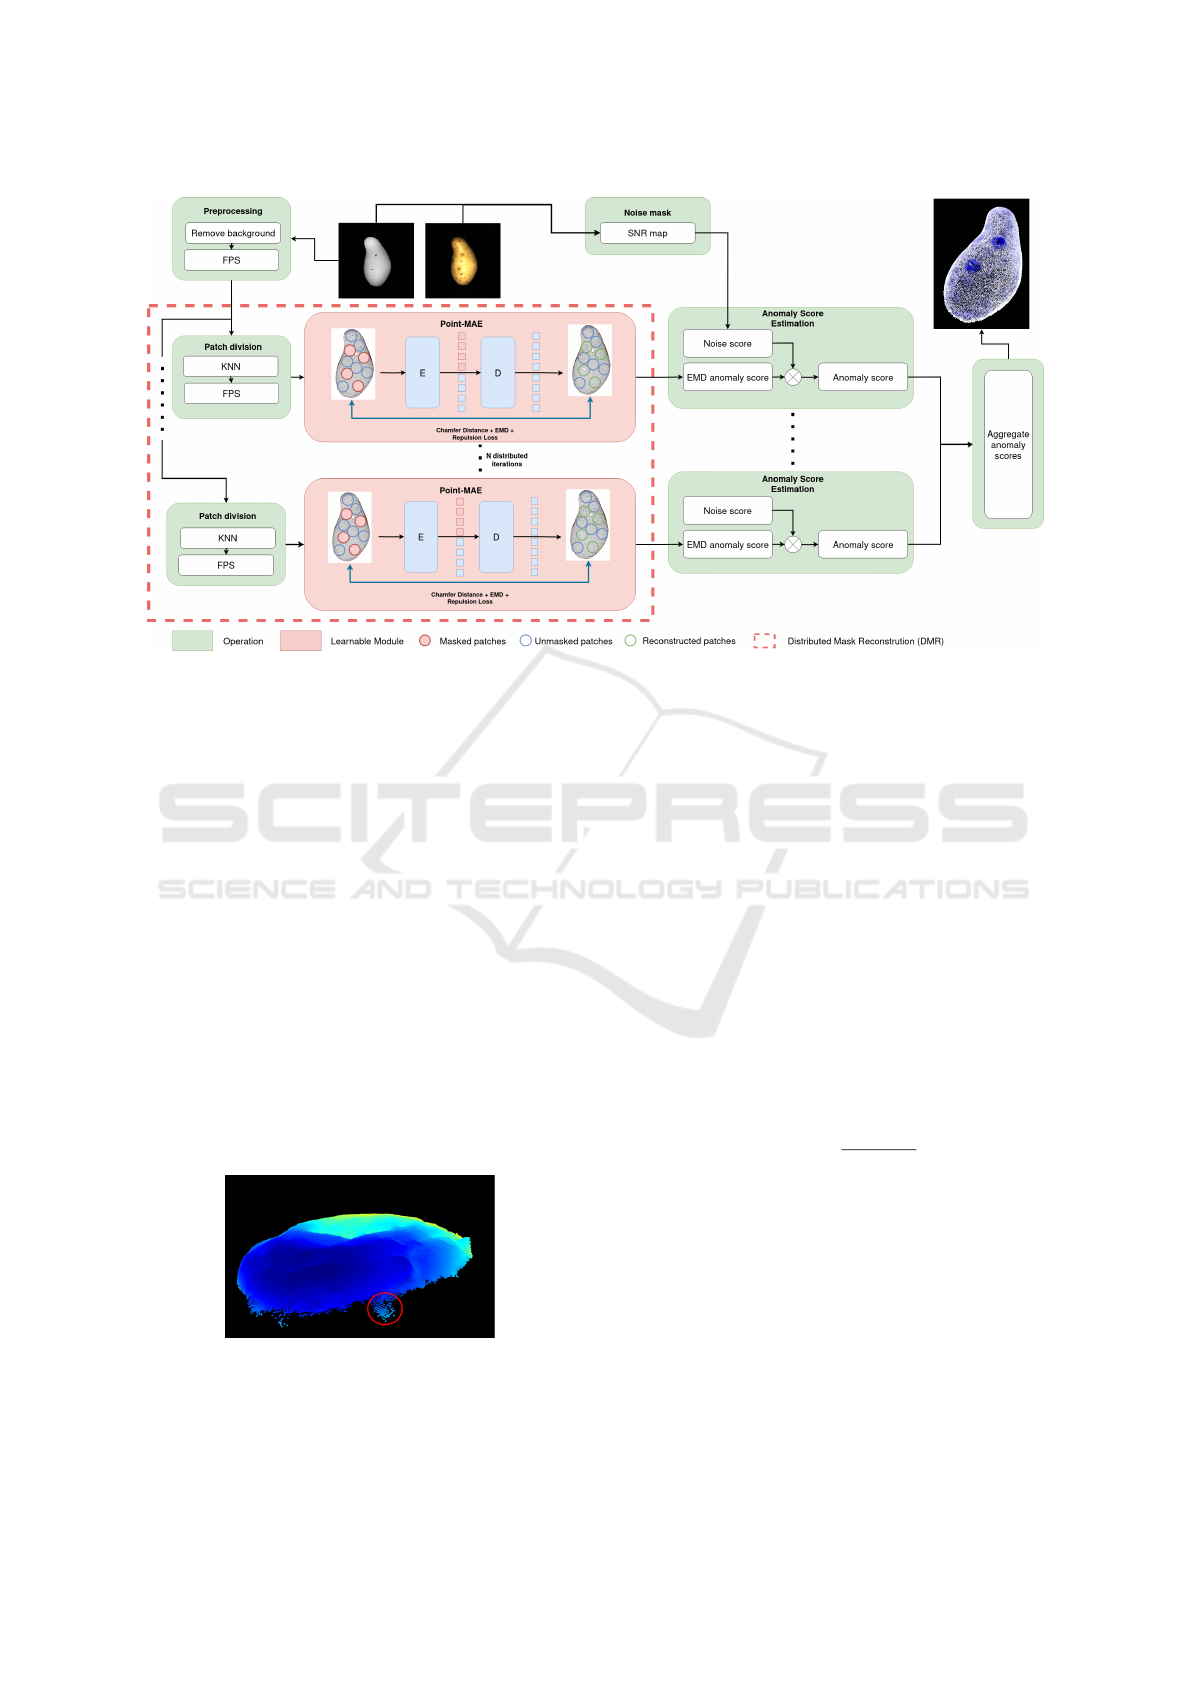
Figure 2: Overall pipeline of our MAESTRO model with trainable modules in red and operation modules in green.
DMR (Distributed Mask Reconstruction) and ASE
(Anomaly Score Estimation).
3.1 Noise Estimation
Structured light is a primary technique for high-
precision 3D scanning, employed to capture the shape
and surface details of objects. This method in-
volves projecting a known pattern (often a series of
stripes or grids) onto the object and analyzing the de-
formation of this pattern upon striking the surface.
This is the technology used in the MVTec 3D-AD
dataset (Bergmann et al., 2022). Despite its advan-
tage on surfaces facing the camera, it exhibits low ac-
curacy when the surface fails to reflect light, due to
either its orientation or material properties, whether
specular, absorbent, or transparent. Consequently, in
the MVTec 3D-AD dataset (Bergmann et al., 2022),
there is significant noise at the edges of objects, as
illustrated in Figure 3.
Figure 3: Illustration of a cookie geometry in the testing set
of MVTec 3D-AD (Bergmann et al., 2022). The part circled
in red is clearly deviating from the normal pattern but is not
a real anomaly.
The limit between noise and real anomaly can be
tricky to define, especially because noise can be de-
fined as well as deviation from normality. This can
occur when noise is absent in a specific area of the
training set but is present in the testing set. Noise
has rarely been studied in 2D anomaly detection, pri-
marily because 2D data typically contain less noise,
which tends to be uniformly distributed. Moreover,
noise on 3D objects is mostly grouped together due to
material or object properties, making it a compelling
target for research.
To tackle this problem, we use a Signal-to-Noise
Ratio map to discriminate noise from anomalies and
compute the Noise Score(NS). We apply a penalty
and reduce the anomaly score where the uncertainty
of the measure is higher. The Signal-to-Noise Ratio
(SNR) is a measure used to compare the level of a
desired signal to the level of background noise.
SNR(x, y) =
I(x, y)
σ
localnoise
, (1)
where I(x, y) represents the intensity value at the pixel
coordinates (x, y), and σ
localnoise
denotes the local
standard deviation of the noise around the pixel co-
ordinates (x, y).
3.2 Random Sampling
In the context of 3D point clouds, the non-Euclidean
nature of the data makes it challenging to efficiently
segment the cloud into patches while preserving the
following properties: (i) each patch contains the same
MAESTRO: A Full Point Cloud Approach for 3D Anomaly Detection Based on Reconstruction
719
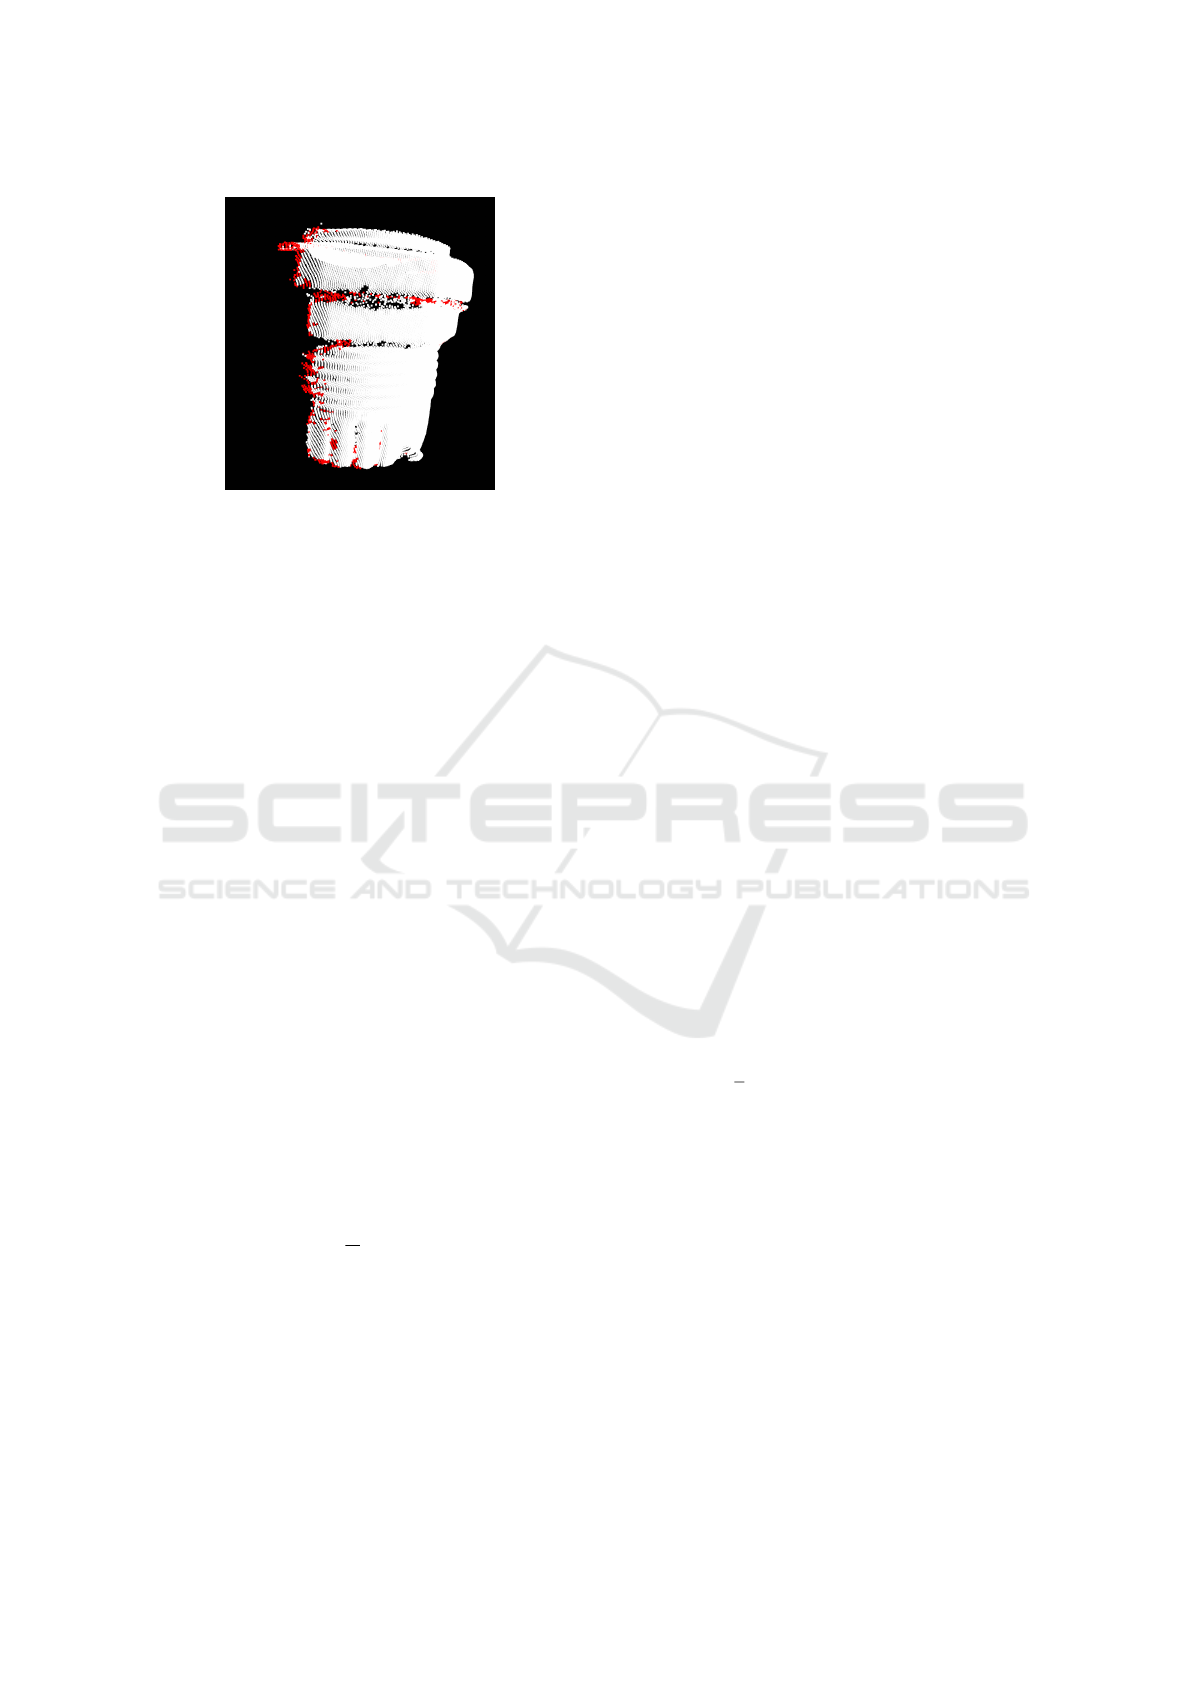
Figure 4: Illustration of a cable gland geometry, where red
points have an SNR value lower than 5. Points along the
border exhibit lower intensity and are more susceptible to
noise.
number of points; (ii) each point is assigned to ex-
actly one patch; (iii) points within the same patch are
neighbors. A method that addresses these properties,
proposed by (Bradley et al., 2000) using K-means
clustering, has a complexity of O(n
4
logn) where n is
the number of points, is impractical for real-world ap-
plications. Consequently, we chose to relax the con-
straint (ii) and allow for overlapping patches.
Given a point cloud P = {p
1
, p
2
, . . . , p
n
} in R
3
,
we aim to partition P into k overlapping patches
P
1
, P
2
, . . . , P
k
such that each patch P
i
contains exactly
N points, with N being a parameter defined in the
setup. For each patch P
i
, we first select a center point
c
i
using Farthest Point Sampling (FPS) and then use
K-Nearest Neighbors (KNN) to iteratively add points
until N points are included.
To improve the efficiency of FPS, we imple-
mented a bucket-based approach (Han et al., 2023)
This implementation is approximately 100 times
faster than the traditional numpy-based FPS used in
Point-MAE (Pang et al., 2022).
Since our goal is to detect anomalies based on
surface characteristics, and both sides of surfaces are
rarely captured in practice, we use a simple FPS to
segment points within patches. The center point of
each patch P
i
is recalculated as the centroid of the
points contained in P
i
:
c
i
=
1
N
∑
p∈P
i
p. (2)
This adjustment ensures that the patch center is rep-
resentative of the actual surface points, avoiding the
issue of KNN selecting edge points that lead to poorly
reconstructed patches, as most points would be con-
centrated on one side only.
Our model is fully derived from Point-MAE (Pang
et al., 2022) and utilizes an asymmetric encoder-
decoder architecture.
Given that our point patches are characterized by
their spatial coordinates, an intuitive method is to di-
rectly map the centers C of these patches into cor-
responding position embeddings P
c
. This approach
leverages the central coordinates as the basis for
generating the embeddings, ensuring that each point
patch is uniquely represented within the embedding
space. Patches are classed into two categories: (i)
visible tokens which help to reconstruct the surface;
(ii) masked patches. The visible point patches P
vis
are
embedded, using a dimension D, as specified in the
setup. This process can be described as follow:
T
vis
= PointNet(P
vis
), T
vis
∈ R
(1−m)n×D
. (3)
The visible tokens T
vis
and the mask tokens T
m
,
along with the global position embedding P
c
, are in-
put to the Transformer P
MAE
. This setup enables the
Transformer to leverage the positional context to re-
construct the masked points. Specifically, the final
layer of the decoder is responsible for generating the
reconstructed points P
rec
, as shown below.
P
rec
= P
MAE
(T
vis
, T
m
, P
c
), P
rec
, T
m
∈ R
m×k×3
. (4)
Our reconstruction network is designed with the goal
of accurately restoring the original point patches that
were masked. Once the predicted point patches P
rec
have been generated, they are compared against the
ground truth to evaluate the performance. We use
Chamfer distance(Fan et al., 2017) to measure the dis-
crepancy, Earth Mover’s Distance(Fan et al., 2017)
to account for point density variations, and a Repul-
sion loss to ensure the model distribute points evenly
across the surface, enhancing border reconstruction
with varying density. The loss function can be de-
scribed as follows.
L
Total
= λ
1
1
2
L
Chamfer
+ λ
2
L
EMD
+ λ
3
L
Repulsion
.
(5)
Where repulsion loss ensures that points in the
same set are not too close to each other.
L
Repulsion
(P) =
∑
p∈P
∑
p
′
∈P
p
′
̸=p
exp(−∥p − p
′
∥
2
2
). (6)
The parameters λ
1
, λ
2
, and λ
3
are weights defined
in the setup that control the contribution of each loss
component to the total loss.
3.3 Distributed Mask Reconstruction
During testing, the original sampled point cloud is
randomly splitted by overlapping patches using KNN
VISAPP 2025 - 20th International Conference on Computer Vision Theory and Applications
720

and FPS with a different scale of patches for each dis-
tributed iteration. It is then randomly masked and
concatenated with the visible-point patches through
the transformers. All reconstructed patches from dif-
ferents scales are grouped together to etablish an
Anomaly Score Estimation.
3.4 Anomaly Score Estimation
We cannot use simple techniques provided for 2D
anomaly detection, such as SSIM (Wang et al., 2004)
or point-wise difference, due to the unorganized struc-
ture of points. We address these challenges by com-
paring the point cloud in a patchwise manner, based
on the patches computed in the previous step. Fol-
lowing the distributed reconstruction module, each
reconstructed point cloud P
r
retains the same patch
organization as the original P
i
. Using this property,
we compute an anomaly score for each patch using
an EMD-based comparison score, and the noise score
previously presented in Equation 1. After multiple it-
erations with different patch sizes and positions, each
point accumulates a set of values corresponding to an
anomaly score for each instance it was included in a
reconstructed patch. This approach allows us to ag-
gregate patches of different scales and positions, re-
sulting in a finer anomaly detection. The complete
calculation of the anomaly score is expressed as fol-
lows.
AS = EMDS × NS, (7)
where EMDS is the score based on Earth Mover’s
Distance, and NS is the Noise Score. The result
for each point is an array of anomaly score for each
points. To obtain a single anomaly score from these
arrays, we used the mean.
The EMDS is calculated as:
EMDS = EMD(P
i
, P
r
), (8)
where p
i
and p
r
are the corresponding point-patches,
denoting the input and output point clouds. EMDS
is the anomaly score of the patch attributed to each
points within the corresponding patches.
4 EXPERIMENTS
To evaluate the effectiveness of our anomaly detec-
tion method, we conducted experiments on the pop-
ular MVTec 3D-AD dataset (Bergmann et al., 2022).
which is a well-established benchmark for 3D indus-
trial anomaly detection tasks.
4.1 Preprocessing
We followed the BTF baseline for preprocessing. All
background points were removed from the dataset as
explained in (Horwitz and Hoshen, 2022). Addition-
ally, we applied Farthest Point Sampling (FPS) to en-
sure a consistent number of points, set to 8192.
4.2 Evaluation Metrics
To assess the performance of our proposed method,
we use the two metrics provided by (Bergmann et al.,
2022). The Area Under the Receiver Operating Char-
acteristic curve (AUROC). For a more detailed anal-
ysis of pixel-level segmentation in the MVTec 3D-
AD dataset (Bergmann et al., 2022), we use the Per-
Region Overlap (PRO) metric. We calculate the Area
Under the PRO Curve (AUPRO) to evaluate anomaly
localization, using the anomaly scores generated by
our method and the ground-truth connected compo-
nents.
4.3 Experimental Results
Table 1 compares our method and existing meth-
ods on the MVTec 3D-AD dataset (Bergmann et al.,
2022), evaluated with the Img-AUROC metric.
The anomaly localization performance is mea-
sured using the AUPRO metric, calculated as the inte-
gration of the PRO value with the false positive rates
(FPR). Like most previous methods (Chu et al., 2023;
Tu et al., 2024), we set 0.3 as the upper limit of the
FPR integration limit. A smaller FPR integration limit
means a stricter tolerance of false positives.
4.4 Ablation Study
To study the influence of each component within
the proposed MAESTRO, we conduct ablation anal-
ysis on the MVTec 3D-AD dataset (Bergmann et al.,
2022).
Effectiveness of Noise Estimation. Table 2 illus-
trates the impact of various noise estimation tech-
niques on the AUPRO and AUROC metrics. The re-
sults demonstrate that noise estimation methods using
SNR improve performance compared to the baseline.
Our method achieving higher scores than the baseline.
These findings highlight that noise estimation is cru-
cial to improve model performance.
MAESTRO: A Full Point Cloud Approach for 3D Anomaly Detection Based on Reconstruction
721
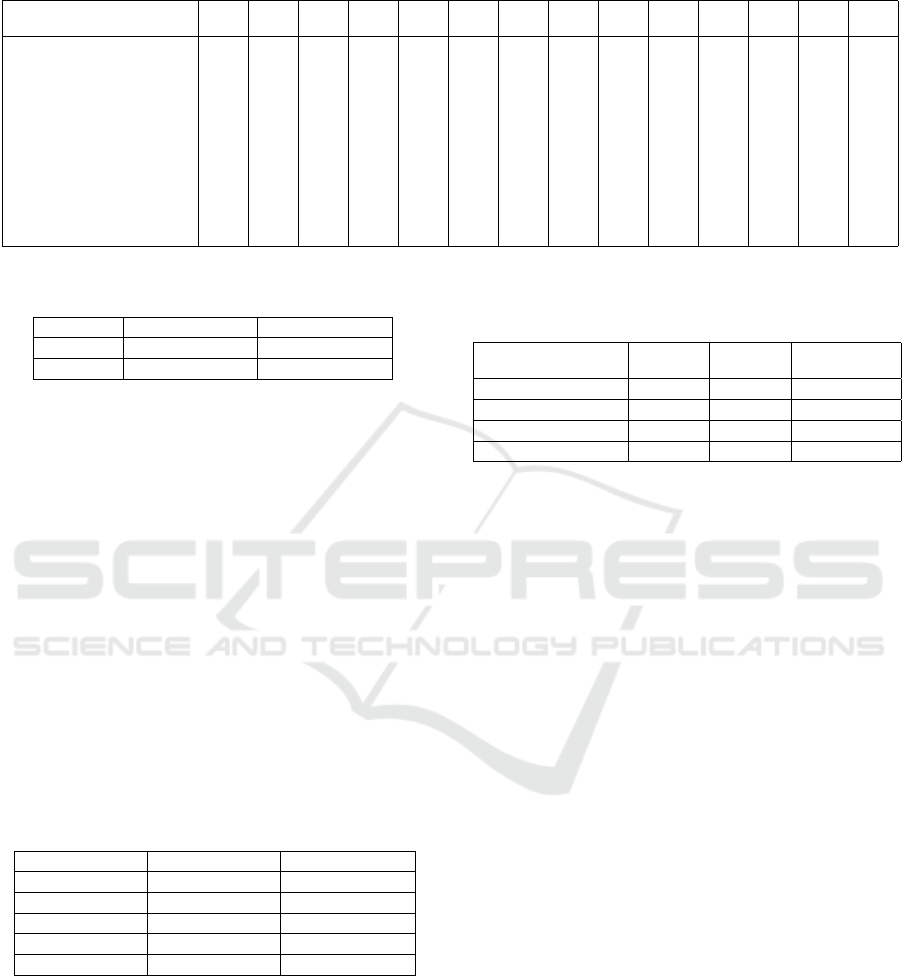
Table 1: I-AUROC score for anomaly detection of MVTec 3D-AD dataset (Bergmann et al., 2022) with 3D only. SNR:
Signal-to-noise map; MP: Multi-patches. The best score for each class is in blue.
Method Bagel Cable
Gland
Carrot Cookie Dowel Foam Peach Potato Rope Tire Mean
Memory
bank us-
age
Pretrained
model
usage
Point
cloud
usage
Depth GAN (Bergmann et al., 2022) 53.0 37.6 60.7 60.3 49.7 48.4 59.5 48.9 53.6 52.1 52.3
Depth AE (Bergmann et al., 2022) 46.8 73.1 49.7 67.3 53.4 41.7 48.5 54.9 56.4 54.6 54.6
Depth VM (Bergmann et al., 2022) 51.0 54.2 46.9 57.6 60.9 69.9 45.0 41.9 66.8 52.0 54.6
Voxel GAN (Bergmann et al., 2022) 38.3 62.3 47.4 63.9 56.4 40.9 61.7 42.7 66.3 57.7 53.7
Voxel AE (Bergmann et al., 2022) 69.3 42.5 51.5 79.0 49.4 55.8 53.7 48.4 63.9 58.3 57.1
Voxel VM (Bergmann et al., 2022) 75.0 74.7 61.3 73.8 82.3 69.3 67.9 65.2 60.9 69.0 69.9
Easynet (Chen et al., 2023) 73.5 67.8 74.7 86.4 71.9 71.6 71.3 72.5 88.5 68.7 74.7
3D-ST (Bergmann et al., 2022) 86.2 48.4 83.2 89.4 84.8 66.3 76.3 68.7 95.8 48.6 74.8 ✓ ✓
PatchCore+FPFH (Horwitz and Hoshen, 2022) 82.5 55.1 95.2 79.7 88.3 58.2 75.8 88.9 92.9 65.3 78.2 ✓ ✓
DRAIN (Li et al., 2024b) 81.3 72.0 93.6 92.4 82.9 72.0 87.6 85.9 90.4 69.2 82.7
AST (Rudolph et al., 2021) 88.1 57.6 96.5 95.7 67.9 79.7 99.0 91.5 95.6 61.1 83.3 ✓
MMRD (Gu et al., 2024) 82.9 68.6 93.7 80.4 97.2 86.5 94.7 80.6 96.7 84.9 86.6 ✓
M3DM (Wang et al., 2023) 94.1 65.1 96.5 96.9 90.5 76.0 88.0 97.4 92.6 76.5 87.4 ✓ ✓ ✓
SDF (Chu et al., 2023) 98.3 68.2 97.8 99.8 96.0 73.7 99.3 97.9 96.6 87.1 91.6 ✓ ✓ ✓
LSFA (Tu et al., 2024) 98.6 66.9 97.3 99.0 95.0 80.2 96.1 96.4 96.7 94.4 92.1 ✓ ✓
3DSR (Zavrtanik et al., 2024) 94.5 83.5 96.9 85.7 95.5 88.0 96.3 93.4 99.8 88.8 92.2 ✓
MAESTRO (ours) 92.8 48.6 99.4 94.1 58.8 49.7 79.2 99.3 83.0 48.7 75.4 ✓
Table 2: Comparison of AUROC and AUPRO across differ-
ent techniques.
Method AUPRO mean AUROC mean
w/o SNR 47.7 62.0
SNR 59.0 75.3
Effectiveness of Loss Function. We conducted an
ablation study on our model, and the configuration us-
ing the full set of loss functions achieved the high-
est performance. Although subsequent improvements
have been made to the model, due to time constraints,
we were unable to retest these updated configurations.
Nonetheless, the ablation study underscores the im-
portance of incorporating all loss functions to achieve
optimal results. Specifically, the model using EMD,
the Chamfer distance, and Repulsion achieved an AU-
ROC of 62.0, compared to 58.0 with Chamfer dis-
tance alone and 59.5 with EMD alone.
Analysis of Masking Ratio. Table 3 shows the in-
fluence of masking ratio upon our MAESTRO model.
The optimal ratio of masking is 60%.
Table 3: Comparison of AUROC and AUPRO across differ-
ent percentage of masking.
Masking ratio AUPRO mean AUROC mean
40% 55.8 72.2
50% 57.7 75.4
60% 59.0 75.2
70% 59.0 74.3
80% 56.3 72.8
Analysis of the Multi-Scale Approach We evalu-
ate the efficency of the multi-scale approach, and the
results are illustrated in Table 4. We compute 3 dif-
ferents models with different scales but always recon-
structing 8192 points. We find that multi-scaling im-
proves our model and has better results than any other
independantly. The inference time is calculated for
one iteration.
Table 4: Comparison of AUROC and AUPRO across differ-
ent sizes of patches. G : number of patches; P number of
points within the patches.
Model
(G/P)
AUPRO
mean
AUROC
mean
Inference
time (ms)
128 / 64 57.0 73.5 19.0
256 / 32 56.7 71.1 11.2
512 / 16 52.8 67.9 8.75
Multi (16+32+64) 59.0 75.2 13.05
4.5 Qualitative Results
Qualitative results comparing our method with
M3DM (Wang et al., 2023) are illustrated in Figure 5.
They show the precision of our approach for detect-
ing anomalies for many classes of the MVTec 3D-AD
dataset (Bergmann et al., 2022), notably compared to
this state-of-the-art efficient method.
4.6 Computational Complexity
Inference Time and Memory Usage. In industrial
settings, achieving a balance between inference per-
formance and memory usage is essential. Our Point-
MAE (Pang et al., 2022) based approach stands out
by requiring only 2GB of memory, significantly less
than M3DM (Wang et al., 2023). However, the trans-
former architecture’s quadratic complexity can be a
limitation for high-resolution applications.
Our model achieves an inference speed of 195ms
on the MVTec 3D-AD dataset (Bergmann et al.,
2022), outperforming the M3DM (Wang et al., 2023)
method, which takes 237ms. This experiment was
conducted using a NVIDIA RTX 4070 Ti SUPER
with 8192 points. Our approach offers a distinct ad-
vantage by eliminating the need for memory banks,
making it easier to integrate into real-world industrial
applications. While the computational cost is still sig-
nificant, we believe that our method’s memory occu-
pancy make it a promising solution for industrial use
cases.
VISAPP 2025 - 20th International Conference on Computer Vision Theory and Applications
722
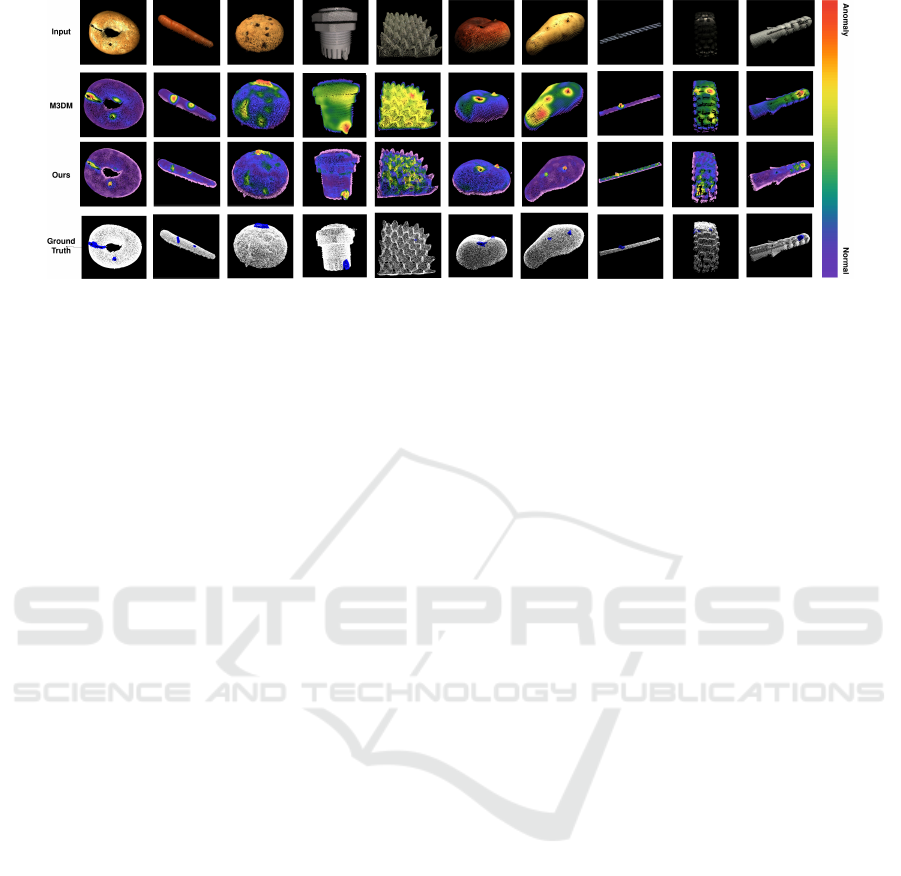
Figure 5: MVTec 3D-AD dataset (Bergmann et al., 2022). Comparison of results between M3DM (Wang et al., 2023), our
method, and the ground truth for ten classes: bagel, carrot, cookie, cable gland, foam, peach, potato, rope, tire and dowel.
5 LIMITATION
Our model performs well in detecting large defects,
such as sinks and bulges, on relatively planar objects.
However, it struggles with high-frequency topologies,
like the intricate wavelets found in cable glands, tires,
and foams. This limitation arises mainly from the
reconstruction process; achieving high-detail recon-
struction with an autoencoder, even when using trans-
formers, remains challenging. The model also has
difficulty managing occlusions and regions with low
local point density. Because the model aims to recon-
struct geometry and calculate an EMD-based score, it
often mistakenly identifies the initial shape itself as an
anomaly. In future work, we could address these limi-
tations by exploring a new backbone architecture that
reduces reliance on masked centers and incorporates
a surface-based anomaly score.
6 CONCLUSION
3D anomaly detection is a valuable tool for indus-
trial quality assesment, as tradional 2D images lack
of informations to discredit defects. However, ac-
tual techniques used in 3D are often impractical for
industrial use, due to their reliance to large memory
banks. To overcome these limitations, we introduce
MAESTRO, a Masked AutoEncoder Self-Supervised
through Reconstruction Only, which addresses these
challenges by focusing exclusively on point cloud
reconstruction without the need for large pretrained
models or memory banks. In detail, we propose a
novel and accurate multi scale approach to reconstruct
the object. Our experimental results demonstrate that
MAESTRO is a solid alternative to other traditionnal
models, establishing its effectiveness in 3D anomaly
detection on the MVTec 3D-AD dataset (Bergmann
et al., 2022). Thanks to its competitive memory
occupancy, MAESTRO is also a promising tool for
anomaly detection in industrial contexts.
REFERENCES
Abati, D., Porrello, A., Calderara, S., and Cucchiara, R.
(2019). Latent space autoregression for novelty de-
tection. In Proceedings of the IEEE/CVF Conference
on Computer Vision and Pattern Recognition (CVPR).
An, J. and Cho, S. (2015). Variational autoencoder based
anomaly detection using reconstruction probability.
Special lecture on IE, 2(1):1–18.
Bergmann, P., Fauser, M., Sattlegger, D., and Steger, C.
(2019). Mvtec ad – a comprehensive real-world
dataset for unsupervised anomaly detection. In Pro-
ceedings of the IEEE/CVF Conference on Computer
Vision and Pattern Recognition (CVPR).
Bergmann, P., Fauser, M., Sattlegger, D., and Steger,
C. (2020). Uninformed students: Student-teacher
anomaly detection with discriminative latent embed-
dings. In Proceedings of the IEEE/CVF Conference
on Computer Vision and Pattern Recognition (CVPR).
Bergmann, P., Jin, X., Sattlegger, D., and Steger, C. (2022).
The mvtec 3d-ad dataset for unsupervised 3d anomaly
detection and localization. In Proceedings of the 17th
International Joint Conference on Computer Vision,
Imaging and Computer Graphics Theory and Applica-
tions. SCITEPRESS - Science and Technology Publi-
cations.
Bergmann, P., L
¨
owe, S., Fauser, M., Sattlegger, D., and Ste-
ger, C. (2018). Improving unsupervised defect seg-
mentation by applying structural similarity to autoen-
coders. arXiv preprint arXiv:1807.02011.
Bergmann, P. and Sattlegger, D. (2023). Anomaly Detec-
tion in 3D Point Clouds Using Deep Geometric De-
scriptors. pages 2613–2623.
Bradley, P. S., Bennett, K. P., and Demiriz, A. (2000). Con-
strained k-means clustering. Microsoft Research, Red-
mond, 20(0):0.
MAESTRO: A Full Point Cloud Approach for 3D Anomaly Detection Based on Reconstruction
723

Cao, Y., Xu, X., and Shen, W. (2023). Complementary
Pseudo Multimodal Feature for Point Cloud Anomaly
Detection. arXiv:2303.13194 [cs].
Chen, R., Xie, G., Liu, J., Wang, J., Luo, Z., Wang, J., and
Zheng, F. (2023). Easynet: An easy network for 3d
industrial anomaly detection.
Chu, Y.-M., Chieh, L., Hsieh, T.-I., Chen, H.-T., and Liu,
T.-L. (2023). Shape-Guided Dual-Memory Learning
for 3D Anomaly Detection.
Deecke, L., Vandermeulen, R., Ruff, L., Mandt, S., and
Kloft, M. (2019). Image anomaly detection with
generative adversarial networks. In Berlingerio, M.,
Bonchi, F., G
¨
artner, T., Hurley, N., and Ifrim, G., ed-
itors, Machine Learning and Knowledge Discovery in
Databases, pages 3–17, Cham. Springer International
Publishing.
Fan, H., Su, H., and Guibas, L. J. (2017). A point set gener-
ation network for 3d object reconstruction from a sin-
gle image. In Proceedings of the IEEE conference on
computer vision and pattern recognition, pages 605–
613.
Gong, D., Liu, L., Le, V., Saha, B., Mansour, M. R.,
Venkatesh, S., and Hengel, A. v. d. (2019). Mem-
orizing Normality to Detect Anomaly: Memory-
Augmented Deep Autoencoder for Unsupervised
Anomaly Detection. pages 1705–1714.
Gu, Z., Zhang, J., Liu, L., Chen, X., Peng, J., Gan, Z., Jiang,
G., Shu, A., Wang, Y., and Ma, L. (2024). Rethink-
ing reverse distillation for multi-modal anomaly de-
tection. In AAAI Conference on Artificial Intelligence.
Han, M., Wang, L., Xiao, L., Zhang, H., Zhang, C., Xu, X.,
and Zhu, J. (2023). Quickfps: Architecture and algo-
rithm co-design for farthest point sampling in large-
scale point clouds. IEEE Transactions on Computer-
Aided Design of Integrated Circuits and Systems.
Horwitz, E. and Hoshen, Y. (2022). Back to the Feature:
Classical 3D Features are (Almost) All You Need for
3D Anomaly Detection. arXiv:2203.05550 [cs].
Hyun, J., Kim, S., Jeon, G., Kim, S. H., Bae, K., and
Kang, B. J. (2024). Reconpatch: Contrastive patch
representation learning for industrial anomaly detec-
tion. In Proceedings of the IEEE/CVF Winter Con-
ference on Applications of Computer Vision (WACV),
pages 2052–2061.
Kim, K. H., Shim, S., Lim, Y., Jeon, J., Choi, J., Kim, B.,
and Yoon, A. S. (2019). Rapp: Novelty detection with
reconstruction along projection pathway. In Interna-
tional Conference on Learning Representations.
Li, W., Xu, X., Gu, Y., Zheng, B., Gao, S., and Wu,
Y. (2023). Towards Scalable 3D Anomaly Detec-
tion and Localization: A Benchmark via 3D Anomaly
Synthesis and A Self-Supervised Learning Network.
arXiv:2311.14897 [cs].
Li, Y., Yang, W., and Fei, B. (2024a). 3dmambacomplete:
Exploring structured state space model for point cloud
completion.
Li, Z., Ge, Y., Wang, X., and Meng, L. (2024b). 3d in-
dustrial anomaly detection via dual reconstruction net-
work. Applied Intelligence, pages 1–15.
Liu, J., Xie, G., Chen, R., Li, X., Wang, J., Liu, Y., Wang,
C., and Zheng, F. (2023). Real3D-AD: A Dataset of
Point Cloud Anomaly Detection. arXiv:2309.13226
[cs].
Pang, Y., Wang, W., Tay, F. E. H., Liu, W., Tian, Y., and
Yuan, L. (2022). Masked autoencoders for point cloud
self-supervised learning. In Avidan, S., Brostow, G.,
Ciss
´
e, M., Farinella, G. M., and Hassner, T., edi-
tors, Computer Vision – ECCV 2022, pages 604–621,
Cham. Springer Nature Switzerland.
Qi, C. R., Su, H., Mo, K., and Guibas, L. J. (2017). Pointnet:
Deep learning on point sets for 3d classification and
segmentation.
Rezende, D. and Mohamed, S. (2015). Variational inference
with normalizing flows. In International conference
on machine learning, pages 1530–1538. PMLR.
Rudolph, M., Wandt, B., and Rosenhahn, B. (2021). Same
same but differnet: Semi-supervised defect detec-
tion with normalizing flows. In Proceedings of
the IEEE/CVF Winter Conference on Applications of
Computer Vision (WACV), pages 1907–1916.
Tu, Y., Zhang, B., Liu, L., Li, Y., Xu, C., Zhang, J., Wang,
Y., Wang, C., and Zhao, C. R. (2024). Self-supervised
feature adaptation for 3d industrial anomaly detection.
arXiv preprint arXiv:2401.03145.
Wang, Y., Peng, J., Zhang, J., Yi, R., Wang, Y., and Wang,
C. (2023). Multimodal Industrial Anomaly Detection
via Hybrid Fusion. pages 8032–8041.
Wang, Y., Sun, Y., Liu, Z., Sarma, S. E., Bronstein, M. M.,
and Solomon, J. M. (2019). Dynamic graph cnn
for learning on point clouds. ACM Transactions on
Graphics (tog), 38(5):1–12.
Wang, Z., Bovik, A. C., Sheikh, H. R., and Simoncelli, E. P.
(2004). Image quality assessment: from error visi-
bility to structural similarity. IEEE transactions on
image processing, 13(4):600–612.
Yang, Y., Feng, C., Shen, Y., and Tian, D. (2018). Fold-
ingnet: Point cloud auto-encoder via deep grid defor-
mation. In Proceedings of the IEEE Conference on
Computer Vision and Pattern Recognition (CVPR).
Yuan, W., Khot, T., Held, D., Mertz, C., and Hebert, M.
(2018). Pcn: Point completion network. In 2018 Inter-
national Conference on 3D Vision (3DV), pages 728–
737.
Zavrtanik, V., Kristan, M., and Sko
ˇ
caj, D. (2024). Cheating
depth: Enhancing 3d surface anomaly detection via
depth simulation. In Proceedings of the IEEE/CVF
Winter Conference on Applications of Computer Vi-
sion (WACV), pages 2164–2172.
Zavrtanik, V., Kristan, M., and Sko
ˇ
caj, D. (2021). DRAEM
- A Discriminatively Trained Reconstruction Embed-
ding for Surface Anomaly Detection. pages 8330–
8339.
Zhou, Z., Wang, L., Fang, N., Wang, Z., Qiu, L., and Zhang,
S. (2024). R3D-AD: Reconstruction via Diffusion for
3D Anomaly Detection. arXiv:2407.10862 [cs].
Zou, Y., Jeong, J., Pemula, L., Zhang, D., and Dabeer,
O. (2022). Spot-the-difference self-supervised pre-
training for anomaly detection and segmentation. In
European Conference on Computer Vision, pages
392–408. Springer.
VISAPP 2025 - 20th International Conference on Computer Vision Theory and Applications
724
