
Ultrasonic Large Scenario Model (ULSM): Vector Embedding
System for Ultrasonic Echo Wave Characteristics
Shafait Azam
a
, Mashnunul Huq
b
and Andreas Pech
c
Department of Computer Science and Engineering, Frankfurt University of Applied Sciences, Frankfurt am Main, Germany
Keywords: Ultrasonic Sensor, Vector Embeddings, Residual Neural Network, Signal Processing, Human Computer
Interaction, Pattern Recognition, Transfer Learning.
Abstract: Ultrasonic sensors emitting ultrasound waves can be effectively used in Human Computer Interaction (HCI)
to assist visually disabled humans. With the embedding of the sensor echoes into assistive tools, real-time
spatial awareness for mobility is enhanced. Moreover, material identification aids object recognition by
detecting different materials through their echo signatures. In this article, we study the use of ultrasonic
sensors in HCI systems focusing on their ability to detect materials by analysing the ultrasonic wave
characteristics. These services aim to improve the autonomy and security of people with visual impairments,
offering a complete assistive solution for daily navigation and interaction processes. We have planned to
create a vector database for storing these embeddings generated from reflected waves of various materials
and objects. In this work, we propose a precise vector embeddings generation framework for ultrasonic
systems using ResNet50 convolutional neural network. In the future, Generative AI will use these embeddings
to serve a range of applications for greater autonomy and safety, providing an assistive travel and interaction
solution for the visually impaired.
1 INTRODUCTION
Ultrasonic sensors are based on ultrasonic waves and
can be used to determine distance, presence, or even
the level between objects. Ultrasonic sensors have the
advantage of working in harsh conditions. Working
principle of ultrasonic Sensor is that it functions like
the basic sound wave propagation (acoustical
wavelength, sound reflection) logic at a frequency in
the ultrasonic region. That’s why ultrasonic waves
show similar characteristics as sound in time domain.
In ultrasonic non-destructive testing (NDT), the
transmission of high-frequency sound waves in a
material is used to determine the characteristics of
that material such as surface information, orientation
etc (Matz, 2006) (Taiju Shibata, 2001) . The reflected
waves from that material can significantly distinguish
the unique properties of that material. Not only that,
Ultrasonic sensors mounted with embedded systems
can also calculate the distance of that material.
a
https://orcid.org/0009-0005-4161-0184
b
https://orcid.org/0009-0006-5401-8259
c
https://orcid.org/0000-0003-4985-3437
In recent studies, NDT was able to figure out the
characteristics of core internal graphite blocks (Taiju
Shibata, 2001). The key idea behind this complex
method is to rely on the reflected waves bounced back
from a surface and examine them precisely. These
reflected waves show different characteristics for
different materials. In porous ceramics the
propagation characteristics of ultrasonic waves is
quite unique because of their porous shape. In these
cases, the relationship between wave velocity and
porosity should be taken into account (Taiju Shibata,
2001). Because of these unique characteristics,
ultrasonic signals or reflected echo signals must be
preprocessed. Ultrasonic signals can be impacted by
several key factors, including the frequency and
bandwidth of the signal, the path and distance of the
inspection, the position and size of the material, and
the properties of the material (Pagodinas, 2002). To
detect various materials and create discrepancies
between them several signal processing techniques
are used. Some of these techniques are implemented
704
Azam, S., Huq, M. and Pech, A.
Ultrasonic Large Scenario Model (ULSM): Vector Embedding System for Ultrasonic Echo Wave Characteristics.
DOI: 10.5220/0013251600003905
In Proceedings of the 14th International Conference on Pattern Recognition Applications and Methods (ICPRAM 2025), pages 704-711
ISBN: 978-989-758-730-6; ISSN: 2184-4313
Copyright © 2025 by Paper published under CC license (CC BY-NC-ND 4.0)

on the embedded system or the hardware and some of
them are done after post echo generation. Ultrasonic
waves tend to scatter, so the efficacy of these
techniques in detecting reflected echoes in materials
shows high attenuation of waves. Some of the simple
signal processing techniques can be analog signal
filtering, transducer damping, pulse shaping, clipping
the whole signal and adjusting it, amplitude
controlling, applying filters for noise reduction,
improving the spatial resolution of multiple
reflections, etc (Pagodinas, 2002). Some of the signal
preprocessing techniques also includes shifting the
signal from time domain to frequency domain. In our
case we have captured the ultrasound signal and
generated spectrogram from that signal. Because we
have realized that extracting echo wave
characteristics in frequency domain is effective to
generate vector embeddings. Because different
materials have different echo wave characteristics
which can be utilized in pattern recognition.
Figure 1: Ultrasound signal reflected from plastic.
Figure 1, shows the whole ultrasound signal
which is preprocessed where X-AXIS symbolizes
Time and Y-AXIS symbolizes Amplitude. we have
generated spectrogram from it. Spectrogram holds the
frequency properties of a specific material.
Based on the properties of ultrasonic signals HCI
systems can be built. To ensure the quality of life for
disabled people smart wheelchairs can be beneficial
(Sanders, 2021). Not only this, by introducing the
power of recent technologies such as Generative AI
any message can be generated and transmitted to the
visually impaired person in correspondence with
his/her surroundings. The existing method to assist a
visually impaired person is called a white cane or a
walking stick. It detects its surroundings with the help
of sensors and tries to alert people (Nayan, 2016).
people have a vision impairment which can be either
partial or full. White cane can help people but it may
get confused in an unfamiliar environment. Our focus
is to build a system that can efficiently serve blind
people and generate alert messages to the visually
impaired so that they can have a proper understanding
of the situation. Human actions include gestures and
movements in an environment. A system for human
activity recognition is meant to recognize these
activities in the context of real-life situations so that
we can understand what lies beneath them. The field
of contextual information detection has been
attracting intense interest among numerous
researchers for decades due to its applications in HCI
(Ghosh, 2023).
In the area of signal processing, Recurrent Neural
Networks (RNN), Long-Short Term Memory
(LSTM) (Zhou, 2022), and transformers are widely
used. Speech, text, audio and music can be generated
with the help of Generative AI. Transformers are the
building blocks of Gen AI consisting of multilayer
encoder and decoder that works with the attention
mechanism (Vaswani, 2017).
This paper initializes and demonstrates the first
phase of the Ultrasonic Large Scenario Model
(ULSM) which is to generate the embedding vectors
from spectrograms via the ResNet50. To generate our
desired vector embeddings we have conducted
research on VGG16, VGG19 and ResNet50
(Agarwal, 2021). But we have chosen the ResNet50
model because of its architecture and residual
connections which is suitable to process
spectrograms. To varify the correctness of these
embeddings we have calculated the similarity scores.
These embeddings are stored in a vector database for
different materials and objects. Our key idea is to
combine the abilities of ultrasonic sensors with Gen
AI systems to solve various real-life problems.
2 RELATED WORKS
Audio signals are within the human audible range for
example 20 Hz to 20 KHz, but ultrasonic signals work
beyond 20 KHz which is above human hearing.
Regardless, both types of signals are used to
communicate and they provide the ability for
information exchange with spectral elliptically
shaped sound waves. So, it can be said that the
methods we use to process audio or sound waves
nowadays can be applied to ultrasonic signals for
processing purposes. Ultrasonic signals can be treated
Ultrasonic Large Scenario Model (ULSM): Vector Embedding System for Ultrasonic Echo Wave Characteristics
705

as time series data with continuous values. The
methods used to represent time series data are the
building blocks to develop time series-based
applications. To represent data adequately and draw
any conclusion from the given time series data, vector
embeddings are necessary. Signal2Vec is a novel
technique that harnesses the capabilities of natural
language processing methodologies to convert
continuous-time series data into a meaningful vector-
based representation. This transformation enables a
diverse array of applications, encompassing time
series classification, prediction and anomaly
detection (Nalmpantis, 2019). The inspiration model
was word2vec which can understand the semantic and
syntactic meaning of words (Ma, 2015).
Another model named Wave2Vec, which is a
semantic learning model to learn deep representations
of medical concepts from Electronic Health Records
(EHRs). This model is capable of handling bio signals
such as Electroencephalogram (EEG),
Electrocardiogram (ECG), and Electromyography
(EMG) (Yuan, 2019). These continuous time series
signals are converted into vectors to extract semantic
meaning. This base model is a combination of two
separate models known as Wave2Vec-sc and
Wave2Vec-so. Wave2Vec-sc is responsible for
extracting the dormant characteristics of bio signals
with the help of a sparse autoencoder (SAE). On the
other hand, Wave2Vec-so can be trained to predict
neighbouring representations with the help of a
SoftMax layer (Yuan, 2019).
We are inspired by the research conducted by the
Facebook AI research team. They have developed a
model known as Wav2Vec 2.0 which can process raw
audio signals efficiently to solve speech processing
problems (Baevski, 2020). This model consists of
several stages such as Feature encoder, Context
Network, Quantization, and Self-Supervised
Learning. It encodes raw speech audio using a multi-
layer convolutional neural network into high-level
continuous feature vectors. These embeddings are
then fed into a Transformer network to create
contextualized representations. During the
pretraining stage, part of the model employs a
quantization module to transform the latent
representations into a limited set of potential
embeddings. These representations are chosen from
multiple codebooks (Baevski, 2020). The Gumbel
SoftMax function is used to choose discrete
codebooks (Gumbel, 1954) (Jang, 2016). The
embeddings generated by the quantization module
then serve as the targets for the model to predict
during pretraining (Baevski, 2020). We have
conducted our own experimentation on the base
model of Wav2Vec 2.0, which is the Wav2Vec model
to generate the embeddings via feature encoder. But
this model has some limitations. This model takes raw
signals as input. As we are working with ultrasound
signals, we have passed the signal directly to the
model. The Vector embeddings generated by this
model has the dimensions of 512*10. To create a
search index and perform similarity search to validate
the generated embeddings is quite challenging
because of this huge dimension. Even this dimension
is too big to perform vector search in renowned
Vector Databases such as Atlas MongoDB, Azure
Qdrant and Azure Cosmos DB.
Depending on the above-mentioned conclusion,
we have shifted our focus to frequency domain.
Spectrograms represent the echo wave characteristics
much better than the raw signals. Different
applications in the field of audio, music and speech
use pre-processed spectrograms and Mel-
spectrograms as the input data of neural networks
(Alnuaim, 2022). Spectrograms allow us to visualize
which frequencies are present for a specific material
and how they change. We have used the ResNet50
which is pretrained on ImageNet dataset and fine-
tuned on our own dataset. We have utilized a method
called transfer learning for efficiency to generate
vector embeddings. (Hossain, 2022) (Adebanjo,
2020).
3 METHODOLOGY
To produce vector embeddings from the reflected
echo signals we have followed certain steps. All the
experiments were conducted at the Computational
Intelligence Laboratory of Frankfurt University of
Applied Sciences.
3.1 Experimental Setup
To build our experimental setup, we have used one
ultrasonic sensor mounted on top of an embedded
system known as Red Pitaya. Figure 2, depicts the
visual representation of our setup and the way we
have mounted the ultrasonic system on the top of a
tripod. On the ground, yellow tapes are the markings
of the maximum reach of the signal in terms of angle
and space. The middle point is also marked at the
center with yellow tape. We have put all our materials
at the center to get the readings from the RedPitaya.
Our embedded system is connected to a laptop over
Ethernet cable, where monitoring of the signal
readings occurred.
ICPRAM 2025 - 14th International Conference on Pattern Recognition Applications and Methods
706
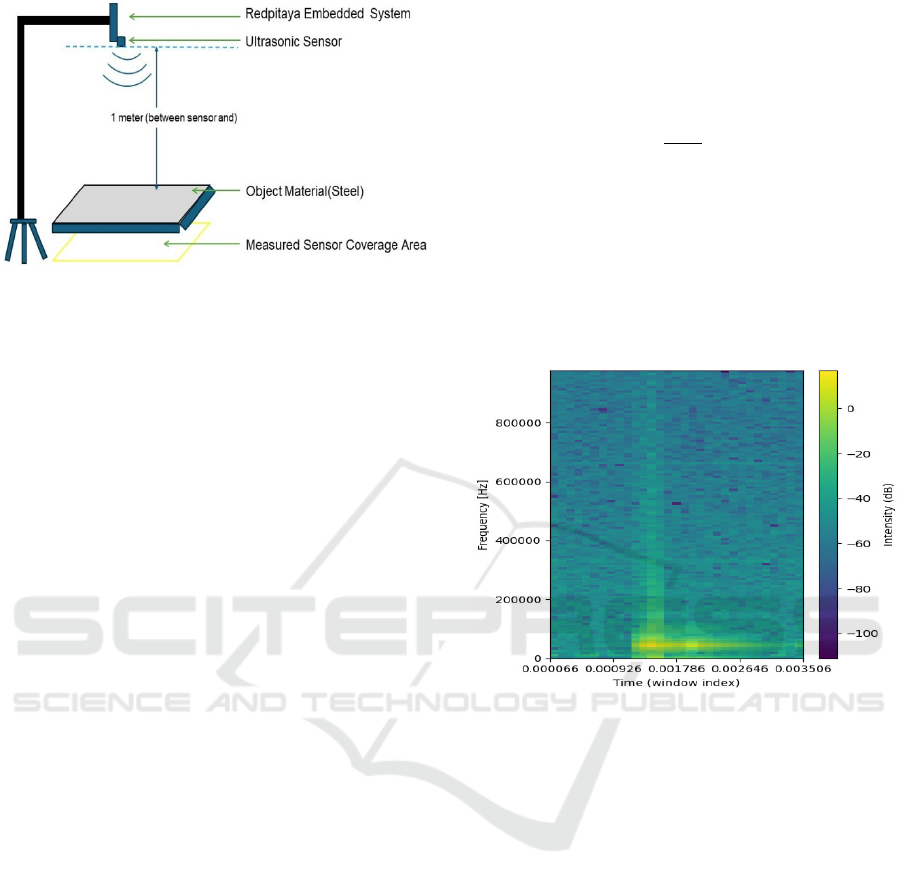
Figure 2: Experimental setup for data acquisition at
Computational Intelligence Lab (Frankfurt University of
Applied Sciences).
3.2 Data Acquisition
The system has sampled the analog signal with a
sampling rate of 1.95 MHz. Because of the extended
range of the system, it can analyse multiple materials
in a single shot. For experimental purpose, readings
of reflected echoes for 3 materials have been taken
such as plastic, wooden box, steel individually. For
each material 100 sampled time signals have been
taken for fine-tuning purpose. The distance of the
material from the sensor have been adjusted multiple
times as the strength of the signal gradually decreases
with the increasing distance. To avoid overfitting,
readings were taken from 35cm, 64cm and 150cm for
each of these materials.
3.3 Vector Embeddings Creation
Embeddings are the compact representation of given
input signal which contain the learned features. Our
captured Analog signals have converted to Analog-
to-Digital signals. After the preprocessing, we have
generated, spectrograms from these signals.
3.3.1 Labelling the Data
To label acquired data, human eye observations were
used. As we have acquired data for three materials,
we have labelled them as plastic, wood and steel.
3.3.2 Generating Spectrograms
To make the conversion from time domain to
frequency domain Fourier transformation is used
which reveal the frequency spectrum of the original
signal. We have ultrasound signals of different
amplitudes in this scenario. To measure the Power
Spectral Density (PSD) the sliding window
(Richardson, 2018) technique was used with the
window size of 256 with sliding step of 128 and
calculated the First Fourier Transform (FFT) of the
windowed portion. The mathematical representation
of the FFT on a set of N samples {𝑥
} as follows:
(Alnuaim, 2022)
𝑋
=
∑
𝑥
𝑒
(
)
𝑘= 0,1,..,𝑁−1 (1)
By squaring the FFT portions and divide them by
window size PSD was calculated. Then we have
generated spectrograms with these PSD values and
resized them into 256*256 pixels. These
spectrograms then converted to logarithmic scale for
better view. Figure 3, below shows the spectrogram
which has been generated by taking only the echo
portion of the whole signal reflected from plastic.
Figure 3: Spectrogram in Logarithmic scale.
3.3.3 ResNet50 Architecture with Custom
Layers
Residual Neural Network is one of Convolutional
Neural Networks (CNN). In CNN, a convolution
operation is conducted on the input data to learn the
features of the image. But this Deep CNN has some
drawbacks such as vanishing gradients, overfitting,
degradation and exploding gradients (LeCun, 2015).
Residual Neural Network can overcome these
challenges by adding the “Residual block” in the
network which is similar to “skip connection” and is
responsible to feed information deeper into the
network (Adebanjo, 2020).
In this paper, we have used the base ReNet50
architecture which has 50 layers for our training
purpose. In Figure 4, the curved lines define the
residual connections or the skip connections which is
responsible to feed the weights of previous layer into
the next deeper layer. This residual connection is
responsible to overcome the challenges like
exploding or vanishing gradients and degradation
Ultrasonic Large Scenario Model (ULSM): Vector Embedding System for Ultrasonic Echo Wave Characteristics
707
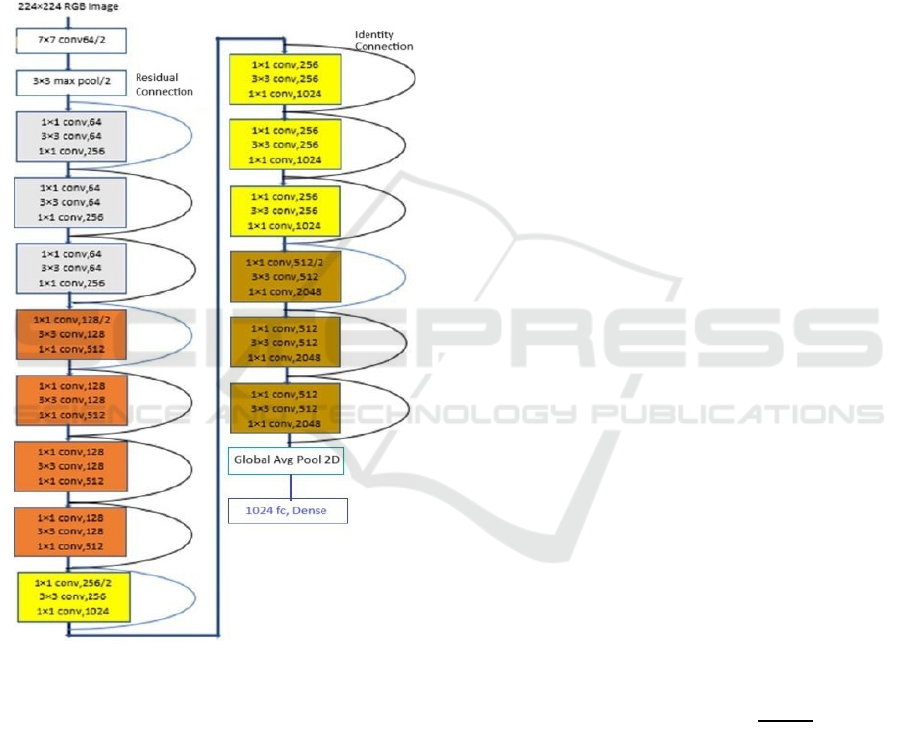
problems. ResNet50 have 5 convolutional blocks
known as Conv1, Conv2, Conv3, Conv4 and Conv5.
Each of these blocks has their own fixed size kernels
and convolution layers. In Figure 4, The first layer of
ResNet50 has 64 filters of size 7 × 7. The next layer
is a 3 × 3 sized maxpooling layer. There are three
identical grey color blocks, four identical orange
color block, four identical yellow color blocks and
lastly three identical brown color blocks depicted in
figure 4. The curved lines marked with blue color
represents the residual connection and the black color
represents the identity connection (Biswas, 2019).
Figure 4: ResNet50 Architecture with our custom Layers
(Biswas, 2019).
If the input and output dimensions of the
connecting blocks are same, then identity connections
are used. On the other hand, if the dimensions differ
then residual connections are used. We have not used
the Average pooling layer and the fully connected
1000 Dense layer of the traditional ResNet50. We
have added two custom layers to generate our desired
vector embeddings. We have added the Global
Average pooling layer at the end point of Conv5
block. This layer is responsible for reducing the
spatial dimensions which is basically height and
weight of the feature map of Conv5 block. Then we
have connected one dense layer to produce the 1024-
dimensional vector embeddings.
3.3.4 Pre-Training and Fine Tuning
We have used a compelling method known as Transfer
Learning to train our ResNet50. We have frozen the
Conv1, Conv2, and Conv3 blocks, which means we
have pre-trained them with the benchmark ImageNet
dataset using its weight (Adebanjo, 2020). Then for
fine tuning we have used our own 300 spectrograms (in
RGB scale) generated from ultrasound signals for
plastic, wood and metal because we have analysed that
the first three blocks extract general patterns and the
last two blocks Conv4 and Conv5 are responsible for
learning abstract pattern specific to ultrasound signals.
Our generated spectrograms have the size of 256*256
pixels and the ResNet50 can convert it to 224*224
pixels automatically.
3.3.5 Vector Embeddings
After the fine-tuning is done, we have generated 225
completely new spectrograms and then generated
vector embeddings with the size of (1, 1024)
dimensions.
3.3.6 Calculate Similarity Scores
For ensuring the correctness of our generated
embeddings, we have used these 225 newly generated
vector embeddings are our vector search space. This
search space is used to calculate the cosine similarity.
We have created three new spectrograms, one for each
material. After generating embeddings from these
three spectrograms, we have calculated the cosine
similarity scores within our vector space. Cosine
similarity is basically calculating the angle between
two vectors. Suppose we have two vectors called X and
Y. Then the cosine similarity between them can be
calculated by the following equation (Nguyen, 2010),
𝑐𝑜𝑠𝑖𝑛𝑒 𝑆𝑖𝑚𝑖𝑙𝑎𝑟𝑖𝑡𝑦 (𝐶𝑆) =
.
|
|
|
||
|
|
|
(2)
Here 𝐴
.𝐵 denotes the dot product between two
vectors. By using the dot product of the normalized
vectors, we have calculated the cosine similarity. As
we wanted to calculate pattern similarities between
spectrogram embeddings we have chosen this
method. If the value of 𝐶𝑆 is closer to 1 then we have
a perfect match and if the value is 0 then the vectors
are orthogonal means they are completely different
(Nguyen, 2010).
ICPRAM 2025 - 14th International Conference on Pattern Recognition Applications and Methods
708
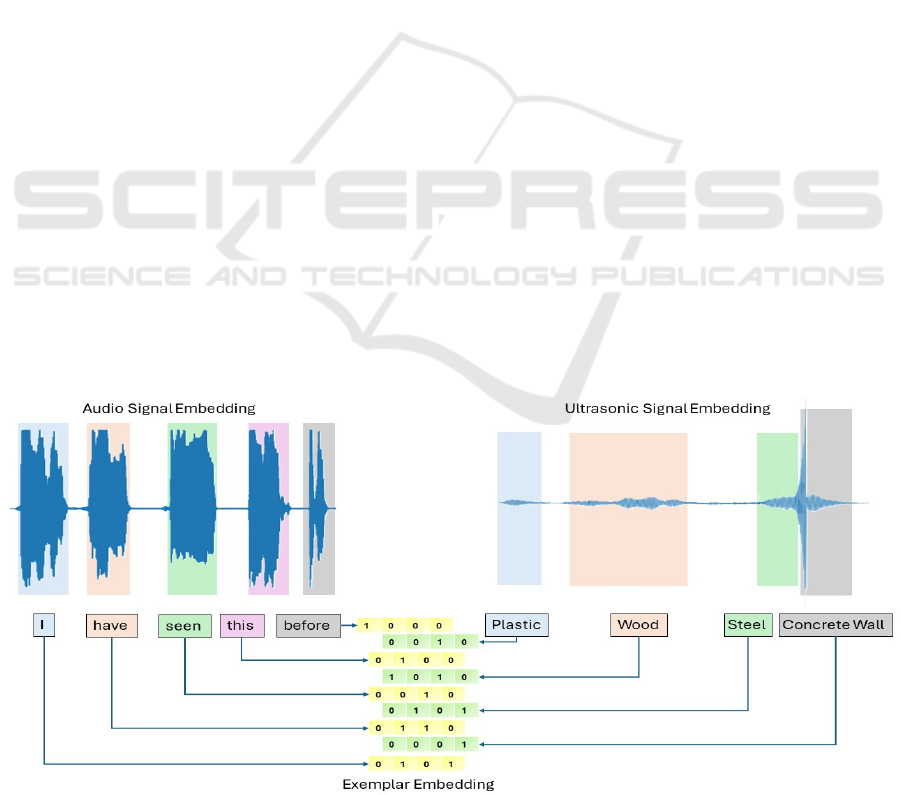
4 ANALOGY
In the current era of transformer models, word
embeddings are used for sentence structuring and
word prediction. A multidimensional array can be an
example of a word embedding which is simply
defining how semantically close the current word is
with other words of the sentence. A relation between
words in multi-dimension helps the model to even
define the type of the word (e.g. pronoun type or verb
type word). With these embeddings, a sentence is
structured and predicted in LLM models. In the case
of waves, these embeddings may get embedded in the
phoneme level of a word. Each of the words then gets
separated into fractions of phonemes. The whole
word embedding holds the audio batch size of the
word, audio channels, and phoneme characteristics.
As Ultrasonic Sounds are also waves with higher
frequency than normal human audible range, the
behaviour of Ultrasonic echo is also like sound waves
of words created while reading a book. The analogy
of each word is to make a whole sentence that is
meaningful. But in the case of a Scenario analysis
Ultrasonic sound must produce which type of
material (e.g. Solid Steel, Soft Foam, Solid Wooden
structure with a hollow in the middle) is present and
in which direction with the information of the current
distance. If for example a sentence “I have seen this
before” produces an embeddings representation in
binary dimension analysis like yellow-coloured
boxes in Figure 3, each of the materials in front of the
Ultrasonic Sensor in office space would create the
embeddings representation given in green-coloured
boxes based on the material of that object. Ultrasonic
Sensors are well known for the capability of distance
measurement, which will interpret the scenario for
example “Plastic at 20cm distance, Wood in 1 meter
distance, Steel cube in 5 meters distance
corresponding a Concrete wall behind the steel frame
at 6 meters from the Ultrasonic sensor”.
5 FUTURE WORK
In this paper, the embeddings of ultrasonic sound
echoes using spectrograms were processed for a far-
reaching achievement of Scenario analysis for trained
material in a live location. The forward plan
corresponds to the further training of the Neural
Network dedicatedly working for processing
Ultrasonic sound with larger dataset. This includes
comparing the embedding creation from Facebook’s
“fairseq” library with own built embedding creation
library (Baevski, 2020). With this achievement, the
process of using the embeddings for material
classification requires an LSM model combined with
LLM which will be capable of interpreting live
scenarios with material positioning and shaping
information. The building phase of the transformer
model for Large Scenario Model (LSM) analysis is
ongoing and will be included with the result in future
works. Required feature engineering and Data
preprocessing will be included in the journey of
getting the highest accuracy of material classification
with positional changing information to build the
scenario into an HCI vision model. Building database
with Log-spectrogram for aiding embedding creation
using CNN feature extraction is also in the future
work plan.
Figure 5: Analogy of Ultrasonic Signal Embeddings with respect to Audio Signal Embeddings.
Ultrasonic Large Scenario Model (ULSM): Vector Embedding System for Ultrasonic Echo Wave Characteristics
709
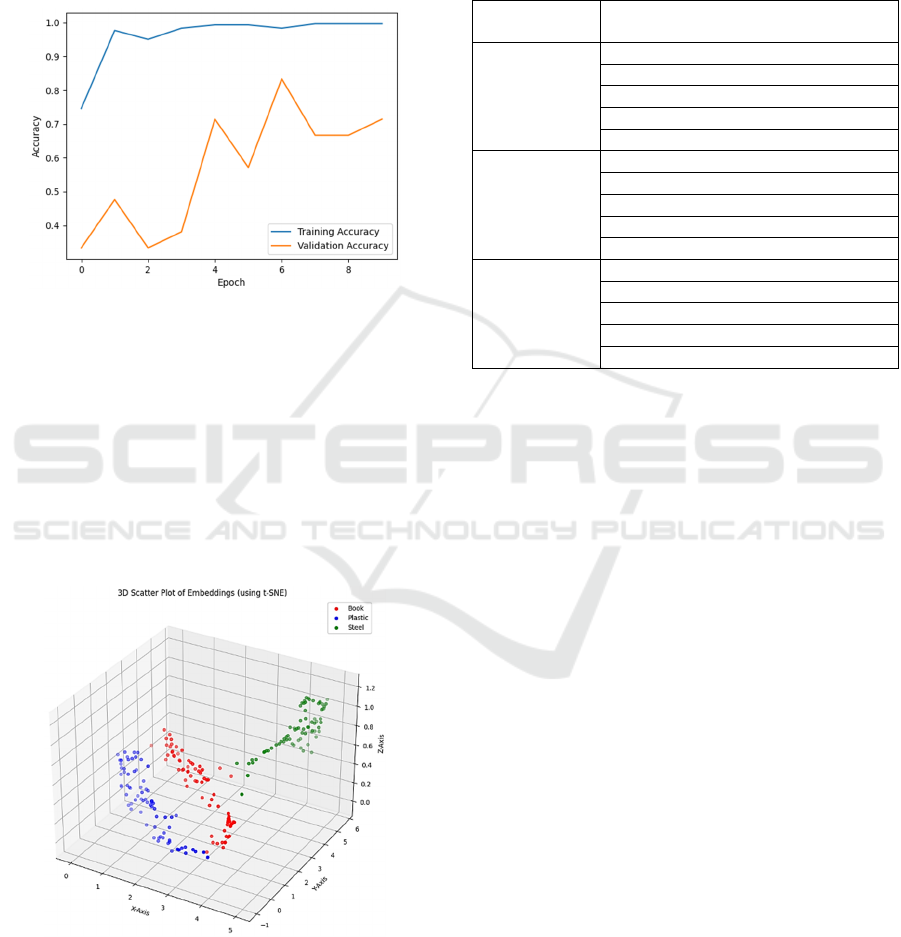
6 RESULT ANALY SIS
we have fine-tuned our model with 300 labelled
spectrograms in the training phase and for validation
75 new spectrograms were used. Figure 6, depicts the
convergence of our network in training and validation
phases.
Figure 6: Accuracy Distribution in training process.
For our search space we have generated 225
vector embeddings. Each of these embeddings has the
size of (1, 1024). To visualize such a huge dimension,
we have used the t-Distributed Stochastic Neighbour
Embedding (t-SNE) to reduce the high-dimensional
data in a lower dimensional space (Arora, 2018, July).
From figure 7, it is clearly noticeable that the
generated embeddings formed similar cluster or
patterns. Vectors generated for same material are
closed to each other.
Figure 7: Scatter plot of the vector embeddings.
To verify our experimentation, we have taken
three new samples (one from each material) and
generated vector embeddings. We have created our
search space to calculate the cosine similarity among
these three vectors and the 225 vectors. From Table
1, it can be demonstrated that the top five similarity
scores are closer to 1 which means they are close to
each other, they have similar patterns and they are in
a same cluster.
Table 1: Top five similarities for each material.
Materials Top Five Cosine Similarity Score
from the Search S
p
ace
Book
(
'Book', 0.9986334
)
('Book', 0.998229)
('Book', 0.9974883)
(
'Book', 0.9972976
)
(
'Book', 0.99661756
)
Plastic
(
'Plastic', 0.99962866
)
('Plastic', 0.9996282)
('Plastic', 0.99961853)
('Plastic', 0.9995949)
(
'Plastic', 0.9995947
)
Steel
(
'Steel', 0.9998824
)
(
'Steel', 0.99977136
)
('Steel', 0.9997442)
('Steel', 0.99968445)
(
'Steel', 0.99959064
)
7 APPLICATION
With these embeddings currently, transformer model
creation and training-testing work is going on. This
will enable the HCI system to build an image of the
surrounding scenario of a vision-impaired person to
assist with sound or neural image transferring using
cheap ultrasonic sensors.
The material classification from the echo signal
will enable a couple of new options for the auto
industry to build vehicles with more autonomous
functions cheaper to build with control of scenario
analysis. Doppler effect analysis for echo
spectrogram can be used for rapid position-changing
effect analysis and emergency analysis on roads (Raj,
2012). It can open the option of cheaper sensors for
accident prediction.
The final Machine Learning Model will open a
new research option for Rovers. Mars or Moon
Rovers with LSM can define a newly found material
on an unknown surface depending on the atmospheric
effect of the planet on sound waves. By autonomous
calculation of deviation of Ultrasonic sound echo
from the earth's surface and unknown planet surface,
calibration of the robot for the atmosphere can be
more accurate. This will enable also material
classification of unknown objects and similarity
analysis with known earth objects.
ICPRAM 2025 - 14th International Conference on Pattern Recognition Applications and Methods
710

REFERENCES
Adebanjo, Q. A.-H. (2020). Breast Cancer Diagnosis in
Histopathological Images Using ResNet-50
Convolutional Neural Network. 2020 IEEE
International IOT, Electronics and Mechatronics
Conference (IEMTRONICS) (pp. 1-7). Vancouver, BC,
Canada: IEEE. doi:10.1109/IEMTRONICS51293.20
20.9216455
Agarwal, S. M. (2021). A comparison between VGG16,
VGG19 and ResNet50 architecture frameworks for
Image Classification. 2021 International Conference
on Disruptive Technologies for Multi-Disciplinary
Research and Applications (CENTCON), (pp. 96-99).
Bengaluru, India. doi:10.1109/CENTCON52345.202
1.9687944
Alnuaim, A. A. (2022). Speaker gender recognition based
on deep neural networks and ResNet50. Wireless
Communications and Mobile Computing, 1(4444388).
Baevski, A. Z. (2020). wav2vec 2.0: A framework for self-
supervised learning of speech representations.
Advances in neural information processing systems, (p.
33).
Biswas, Z. M. (2019). Transfer Learning Based Plant
Diseases Detection Using ResNet50. 4th International
Conference on Electrical Information and
Communication Technology (EICT), (pp. 1-6). Khulna,
Bangladesh. doi:10.1109/EICT48899.2019.9068805
Ghosh, A. C. (2023). UltraSense: A non-intrusive approach
for human activity identification using heterogeneous
ultrasonic sensor grid for smart home environment.
Journal of Ambient Intelligence and Humanized
Computing, 1-22.
Gumbel, E. J. (1954). Statistical theory of extreme values
and some practical applications: a series of lectures
(Vol. 33). US Government Printing Office.
Hossain, M. B. (2022). Transfer learning with fine-tuned
deep CNN ResNet50 model for classifying COVID-19
from chest X-ray images. Informatics in Medicine
Unlocked, 30(100916).
Jang, E. G. (2016). Categorical reparameterization with
gumbel-softmax. arXiv preprint arXiv:1611.01144.
LeCun, Y. B. (2015). Deep learning. nature, 521(7553),
436-444.
Ma, L. &. (2015). Using Word2Vec to process big text data.
2015 IEEE International Conference on Big Data (Big
Data) (pp. 2895-2897). IEEE.
Matz, V. K. (2006). Classification of ultrasonic signals.
International Journal of Materials and Product
Technology, 27(3-4), 145-155.
Nalmpantis, C. &. (2019). Signal2vec: Time series
embedding representation. International conference on
engineering applications of neural networks (pp. 80-
90). Cham: Springer International Publishing.
Nayan, N. M. (2016). An ultrasonic sensing system for
assisting visually impaired person. Jurnal Teknologi,
78(7-4).
Nguyen, H. V. (2010). Cosine similarity metric learning for
face verification. In Asian conference on computer
vision (pp. 709-720). Berlin, Heidelberg: Springer
Berlin Heidelberg.
Pagodinas, D. (2002). Ultrasonic signal processing methods
for detection of defects in composite materials.
Ultragarsas/Ultrasound, 45(4), 47-54.
Raj, B. K. (2012). Ultrasonic doppler sensing in hci.
IEEE
Pervasive Computing, 11(2), 24-29.
Richardson, L. F. (2018). The Sliding Window Discrete
Fourier Transform. arXiv preprint arXiv:1807.07797.
Sanders, D. H. (2021). Intelligent control and HCI for a
powered wheelchair using a simple expert system and
ultrasonic sensors. Intelligent Systems and
Applications: Proceedings of the 2020 Intelligent
Systems Conference (IntelliSys). 3, pp. 571-583.
Springer International Publishing.
Taiju Shibata, M. I. (2001). Ultrasonic signal characteristics
by pulse-echo technique and mechanical strength of
graphite materials with porous structure. Nuclear
Engineering and Design, 203(2–3), 133-141.
doi:https://doi.org/10.1016/S0029-5493(00)00305-8
Vaswani, A. S. (2017). Attention is all you need. 31st
Conference on Neural Information Processing Systems
(p. 30). Long Beach, CA, USA: Advances in neural
information processing systems.
Yuan, Y. X. (2019). Wave2vec: Deep representation
learning for clinical temporal data. Neurocomputing,
324, 31-42.
Zhou, Y. &. (2022). Intelligent analysis system for signal
processing tasks based on LSTM recurrent neural
network algorithm. Neural Computing and
Applications, 34(15).
Ultrasonic Large Scenario Model (ULSM): Vector Embedding System for Ultrasonic Echo Wave Characteristics
711
