
Expanding Domain Coverage in Injection Molding Quality Inspection
with Physically-Based Synthetic Data
Dominik Schraml
1,2 a
and Gunther Notni
1 b
1
Group for Quality Assurance and Industrial Image Processing, Ilmenau University of Technology,
Ehrenbergstraße 29, 98693, Ilmenau, Germany
2
SQB GmbH, Werner-von-Siemens-Str. 9, 98693 Ilmenau, Germany
{dominik.schraml, gunther.notni}@tu-ilmenau.de
Keywords:
Synthetic Data, Semantic Segmentation, Domain Expansion, Computer Graphics, Quality Inspection,
Injection Molding, Physically-Based Rendering.
Abstract:
Synthetic data has emerged as a vital tool in computer vision research, yet procedural generation using 3D
computer graphics remains underexplored compared to generative adversarial networks (GANs). Our method
offers greater control over generated images, making it particularly valuable for domains like industrial quality
inspection, where real data is often sparse. We present a method for generating physically based rendered
images of an injection-molded cup, simulating two common defects - short shot and color streak. The approach
automates defect generation with variable size and severity, along with pixel-perfect segmentation masks,
significantly reducing labeling effort. Synthetic data was combined with a small set of real images to train
semantic segmentation models and explore domain expansion, such as inspecting parts in novel colors not
represented in real-world datasets. Experiments demonstrate that the method enhances defect detection and is
especially effective for domain expansion tasks, such as inspecting parts in new colors. However, challenges
persist in segmenting smaller defects, underscoring the need for balanced synthetic datasets and probably also
for customized loss functions.
1 INTRODUCTION
Machine learning applications in industrial quality
inspection often struggle with limited training data.
This issue is particularly pronounced in industries like
plastic injection molding, where most manufactured
parts meet high-quality standards, leaving few exam-
ples of defects, which can vary widely in appearance.
The scarcity of defect samples, combined with the
labor-intensive nature of labeling - especially for se-
mantic segmentation - poses a significant challenge
for model training.
Synthetic data generation has emerged as a solu-
tion to address this limitation. One popular method
is the use of generative adversarial networks (GANs),
based on the architecture proposed by (Goodfellow
et al., 2014), to expand existing datasets by creating
realistic samples with minimal manual effort. How-
ever, GANs are typically restricted to generating im-
ages within the domain of their training data, limit-
a
https://orcid.org/0009-0002-4728-404X
b
https://orcid.org/0000-0001-7532-1560
ing their ability to produce variations beyond these
boundaries.
In contrast, procedural generation using 3D graph-
ics and physically-based rendering offers greater con-
trol over the characteristics of synthetic images. This
approach enables the creation of diverse datasets rep-
resenting rare or hypothetical defects. By leveraging
3D models, synthetic data can simulate new product
variations, facilitating the training of AI models on
parts or defect types that may not yet exist in reality.
In this work, we investigate the use of 3D graphics
to generate synthetic images of an injection-molded
cup with two common defect types - short shot and
color streak. We develop algorithms to generate de-
fects in varying sizes and severities, along with pre-
cise segmentation masks, providing valuable data for
training and evaluating AI models in quality inspec-
tion tasks. Furthermore, we examine the effectiveness
of this synthetic data for domain expansion by com-
paring the performance of a model trained solely on
limited real data with the same model trained on both
real and synthetic data.
Schraml, D. and Notni, G.
Expanding Domain Coverage in Injection Molding Quality Inspection with Physically-Based Synthetic Data.
DOI: 10.5220/0013252000003912
Paper published under CC license (CC BY-NC-ND 4.0)
In Proceedings of the 20th International Joint Conference on Computer Vision, Imaging and Computer Graphics Theory and Applications (VISIGRAPP 2025) - Volume 2: VISAPP, pages
503-510
ISBN: 978-989-758-728-3; ISSN: 2184-4321
Proceedings Copyright © 2025 by SCITEPRESS – Science and Technology Publications, Lda.
503

2 RELATED WORK
Deep learning applications across all domains rely
heavily on data. Broadly speaking, the more data
available, the better the potential performance of an
AI model, whether for text-based large language mod-
els (LLMs) or computer vision tasks. Consequently,
the use of synthetic data has become a major field of
research. Synthetic data can address several inherent
challenges of real-world data, such as high costs for
capturing and annotation, bias, privacy concerns, and
limited control over the generated material. Addition-
ally, in scenarios where insufficient real data is avail-
able to train a model with acceptable performance -
such as in certain areas of visual quality inspection -
synthetic data may be the only viable solution. De-
spite the growing interest in synthetic data, indus-
trial quality inspection remains a relatively underex-
plored area compared to domains like autonomous
driving. Moreover, research on methods to gener-
ate synthetic data is largely dominated by generative
adversarial networks (GANs) (Paulin and Ivasic-Kos,
2023). While GANs are widely used, they often face
limitations related to the domain of their training data,
restricting their ability to generate out-of-distribution
samples. This limitation underscores the value of ex-
ploring alternative approaches, such as those based on
computer graphics and physically-based rendering.
Research focusing on the use of computer graph-
ics to generate synthetic defects for quality inspec-
tion is relatively scarce. Notable examples include
(Delgado et al., 2023), who generated synthetic data
for the visual inspection of freight containers and
(Boikov et al., 2021), who used synthetic data to de-
tect and classify defects on steel surfaces. Addition-
ally (Bosnar et al., 2023) procedurally generated de-
fects for surface inspection of metal parts such as
blisks, clutches, and gears. However, to the best of
our knowledge, no prior work has focused on gener-
ating synthetic defect images specifically for plastic
injection-molded parts. Furthermore, no studies have
explored the generation as well as the use of synthetic
data and labels for training and evaluating AI models
for semantic segmentation of such defects.
In a recent review of synthetic dataset generation
(Paulin and Ivasic-Kos, 2023) stated that ”nowadays,
the question shifts from whether you should use syn-
thetic datasets to how you should optimally create
them.” A critical challenge in this field is the ”domain
gap” between synthetic and real images. This term
refers to the difficulty of transferring a model trained
on synthetic data to real-world applications.
(Tsirikoglou et al., 2020) also identified a gap in
research, emphasizing the need to optimize synthetic
training data distribution. They suggest that while real
data capture the main mode of a distribution, synthetic
data can be used to model rare or even unrealistic
samples. Addressing this gap, our work contributes
to advancing knowledge in visual quality inspection
by empirically evaluating the use of synthetic data for
the segmentation of defects in injection-molded com-
ponents.
2.1 Research Questions
This research addresses several key aspects of using
synthetic data in industrial quality inspection. First,
we describe a method to generate realistic synthetic
images based on a 3D model of an injection-molded
cup, along with algorithms to procedurally generate
two common defect types - short shot and color
streak. Second, we propose a method to automat-
ically generate semantic labels for these defects.
Finally, we evaluate the effectiveness of the synthetic
images in segmenting both the inspection object and
the defects within a real domain, which may differ to
some extent from the synthetic training data.
Research Questions:
1. How can adding synthetic data to limited real data
improve the performance of an AI model for se-
mantic segmentation?
a) How accurately can the AI segment the inspec-
tion part and identify defects?
b) How well does the AI generalize to larger or
smaller defects of the same type that are not
represented in the real training data?
2. How can synthetic data be used to expand the in-
spection domain, such as adapting to a new color
of the part?
3 METHODOLOGY
Motivated by practical challenges faced by system
integrators in automated optical quality inspection,
we pursued a practical approach to address the data
scarcity problem. Typically, clients provide a limited
number of test samples, mostly good parts with only
a few faulty ones. In this case, we had access to only
a small number of injection-molded cup samples for
training.
To investigate the research questions, we captured
a limited number of real images under controlled lab-
oratory conditions and supplemented them with au-
tomatically generated synthetic images to extend the
dataset. We developed algorithms to generate these
VISAPP 2025 - 20th International Conference on Computer Vision Theory and Applications
504
synthetic images by using a fixed set of input param-
eters while randomly varying key rendering parame-
ters within a defined range. While the real images re-
quired manual labeling to create semantic masks, the
synthetic labels were generated automatically as part
of the image generation process.
3.1 Setup to Acquire Real Data
The real dataset consisted of injection-molded cups in
two colors: natural
1
and red. For each cup, two im-
ages were captured from a top-down camera perspec-
tive under controlled laboratory conditions. One im-
age featured a bright, slightly reflective background,
while the other used a dark background to maintain
controlled complexity in the visual conditions.
The dataset included cups with two types of de-
fects: geometric defects (short shot) and aesthetic de-
fects (color streak), in both small and medium sizes.
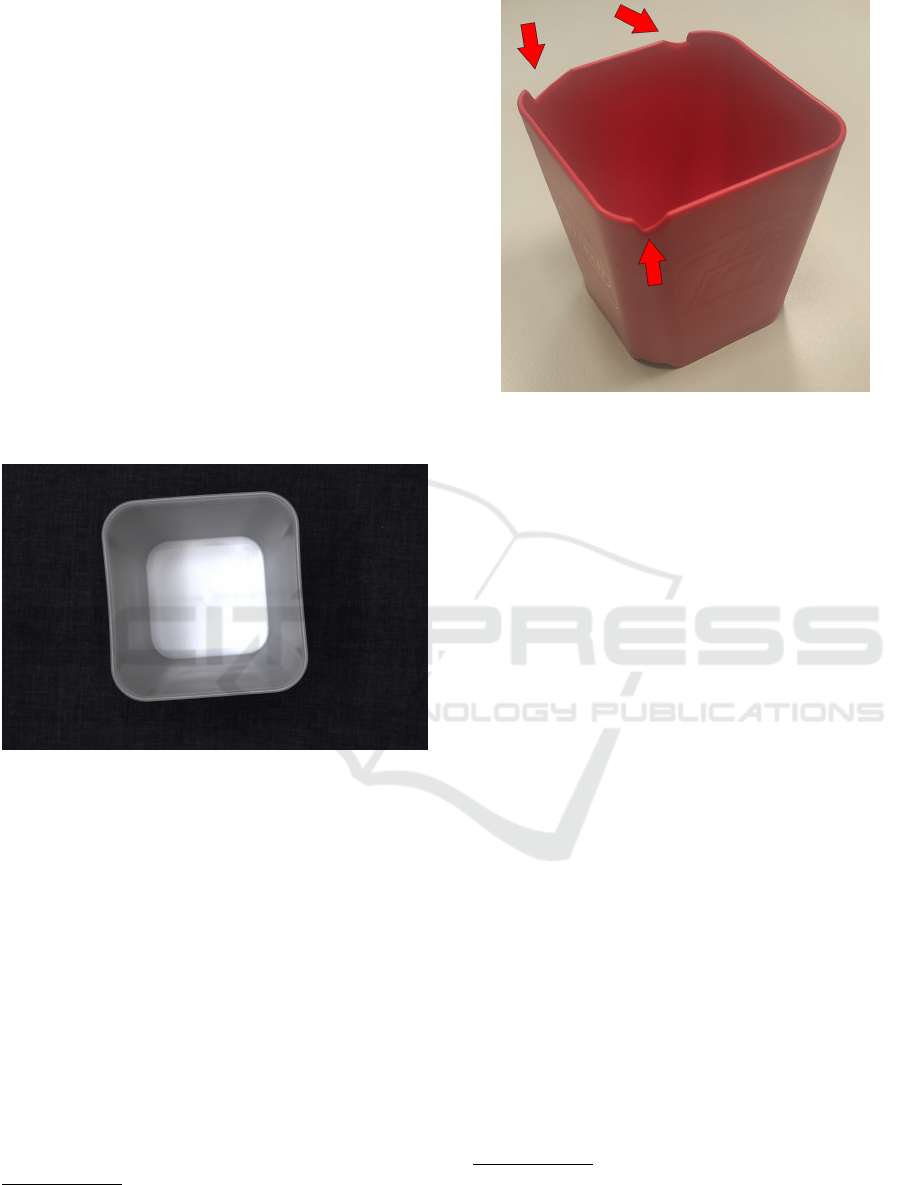
Figure 1: Natural-colored cup without defects, viewed from
above, as used in the test data.
In total, 21 parts were included: 10 natural-
colored and 2 red good cups (see Figure 1), 2 natural-
colored and 1 red cup with color streak defects, and 4
natural-colored and 2 red cups with short shot defects
(see Figure 2).
AI Model Names According to the Data Sets each
Model Was Trained on:
A) Models to evaluate Research Question 1:
A1) 42 real images of cups in natural and red colors
A2) Dataset A1 + 50 synthetic images per defect
class in natural and red colors.
A3) Dataset A1 + 200 synthetic images per defect
class in natural and red colors.
B) Model to evaluate Research Question 2:
1
The natural color of the polypropylene used for the cup
is a translucent white-gray, with significantly higher trans-
parency compared to colored versions such as red, blue, or
green
Figure 2: Red cup with medium short shot defect, viewed
from a diagonal perspective.
B) Dataset A2 + 50 synthetic images per defect
class in blue.
For the remainder of this article, we will refer to
the model trained solely on real data as model A1,
with analogous naming for other models and datasets
(e.g., model A2, dataset A2).
3.2 Setup to Generate Synthetic Data
To generate synthetic images resembling real-world
ones, we used Blender Version 3.6 (Blender, 2018), a
3D modeling and animation software with a built-in
physically-based rendering engine and Python API.
The scene was set up in Blender with a top-down
camera and a simulated ring light, created using a cir-
cular light source with a smaller black disk blocking
its center to replicate the real setup. Background vari-
ation was introduced by randomly selecting from over
100 HDRI
2
images, enabling a wide range of realistic
lighting conditions. To further diversify the dataset,
the brightness of the HDRI backgrounds and the in-
tensity of the top light source were varied randomly
within predefined ranges.
Defects and segmentation labels were generated
using custom algorithms in Blender’s Python API, au-
tomating the creation of synthetic images with consis-
tent yet variable defect characteristics.
2
HDRI is the abbreviation for High Dynamic Range Im-
age and refers to an image format that can contain widely
varying levels of brightness. In Blender, it can be used both
as a background and to generate background or ambient
lighting.
Expanding Domain Coverage in Injection Molding Quality Inspection with Physically-Based Synthetic Data
505
3.3 Procedural Defect Generation
The color streak defect was generated using the al-
gorithm described in Algorithm 1 after setting up the
scene and configuring a Principled BSDF shader with
plastic material parameters. Figure 3 shows a syn-
thetic image of a red cup with a procedurally gener-
ated color streak.
Data: 3D Cup model with base color
Result: N images and corresponding masks
foreach iteration do
Choose random color distinct from base;
Set BSDF input to color ramp;
Randomize ramp center, extension,
gradient, and noise;
Randomize lighting;
Render image and segmentation mask;
Reset scene;
end
Algorithm 1: Generation of Color streak Defect.
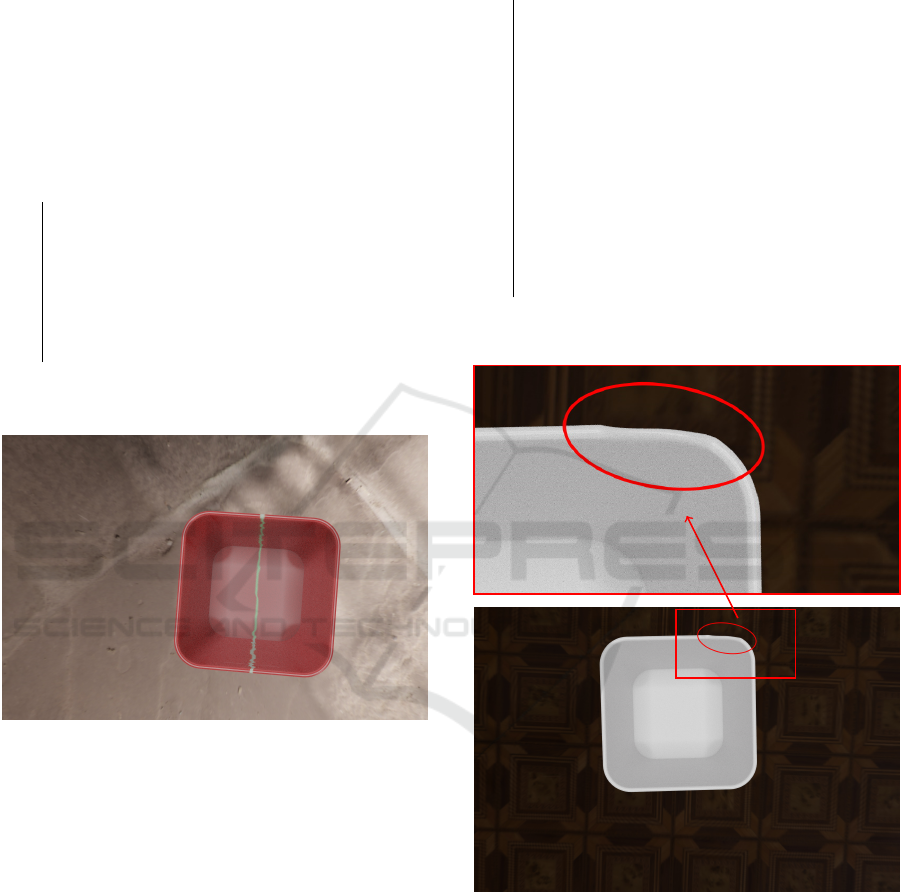
Figure 3: Synthetic image of a red cup with a green color
streak defect, with the streak’s color varying procedurally
across generated images.
The short shot defect was generated using Algo-
rithm 2 following the setup of the 3D model of the
cup. Parameters such as height, width, and depth of
the defect were sampled from a Gaussian distribution
to introduce realistic variations. Figure 4 shows a syn-
thetic image of a natural-colored cup with slight trans-
parency and a medium-sized short shot defect on the
upper right edge.
By applying the presented algorithms within
Blender’s Python API, 200 synthetic images and their
corresponding labels were generated automatically. A
simple thresholding operation was applied to convert
the grayscale labels into pixel masks with class values
ranging from 0 to 3 for semantic segmentation.
Real training images were labeled using PixLa-
belCV software (Schraml et al., 2024) for semantic
Data: 3D cup model with top edge vertices
Result: N images and masks
foreach iteration do
Sample defect height, width, and depth;
Select vertex on cup’s top edge as defect
center;
Calculate sculpting points and apply
sculpting brush;
Render synthetic image;
Compute geometric difference from
original model;
Create difference object for deformation;
Assign distinct brightness values to defect
and difference objects;
Render grayscale semantic label;
Reset scene;
end
Algorithm 2: Generation of Short Shot Defect.
Figure 4: Synthetic image of a natural-colored cup with a
medium-sized short shot (circled in red). The inset above
shows a zoomed-in view of the defect.
segmentation. The distinct differences in color and
sharpness between the cup and the background facil-
itated quick segmentation of the cup from the back-
ground, typically requiring only a few seconds per
image. After this initial step, the defects were seg-
mented as separate classes.
VISAPP 2025 - 20th International Conference on Computer Vision Theory and Applications
506

Figure 5: Rendered mask corresponding to the image in
Figure 4.
3.4 Training Setup
The semantic segmentation task was performed us-
ing PyTorch, training a DeepLabv3+ model intro-
duced by (Chen et al., 2018) with a MobileNetv3
backbone architecture (Howard et al., 2019). Due to
class imbalance in the dataset, Focal Loss (Ross and
Doll
´
ar, 2017) was employed, with parameters opti-
mized through testing on the real dataset.
The models were trained for 100 epochs, using the
same random seed for NumPy and CUDA variables to
ensure reproducibility. The model with the minimum
training loss was saved for subsequent evaluation.
4 RESULTS
For evaluation, the test dataset comprised images
of real cups captured immediately after production
against a dark background, meaning the domain dif-
fered from the real training dataset.
4.1 Metrics
In semantic segmentation, metrics commonly used
for classification tasks can be adapted to evaluate
the pixel-wise accuracy of predicted segmentation
masks against the ground truth. Originally defined
for binary classification, these metrics extend to
multi-class segmentation by evaluating each class
independently, with TP (true positive), TN (true
negative), FP (false positive), and FN (false negative)
representing pixel counts for calculations.
Recall (Sensitivity). measures the proportion of actual
class pixels that were correctly predicted as belonging
to that class:
Recall =
TP
TP + FN
Precision (Positive Predictive Value) measures the
proportion of pixels predicted as a class that truly be-
long to that class:
Precision =
TP
TP + FP
F1-Score combines recall and precision to provide a
balanced measure of accuracy. It is defined as:
F1 = 2 ·
Precision · Recall
Precision + Recall
The F1-Score provides a single metric that consid-
ers both recall and precision, making it useful for as-
sessing the overall performance of the model for each
class.
Intersection over Union (IoU) is a key metric for
evaluating the alignment between the predicted seg-
mentation mask and the ground truth. It is calculated
as:
IoU =
TP
TP + FP + FN
This metric shows the overlap between the predicted
and actual regions for each class, with higher values
indicating better alignment.
Using these metrics
3
, we evaluate the model’s pre-
dictions across different defect classes by visually in-
specting the segmented pixel masks. The interpreta-
tion of metrics like IoU and F1-score - specifically,
what constitutes a ”good” or ”successful” segmenta-
tion - depends heavily on the application. In industrial
inspection, identifying defective parts for removal is
often more critical than achieving pixel-perfect seg-
mentation accuracy. Therefore, our analysis empha-
sizes visual inspection of the masks to determine
whether a defect class is recognized at all, enabling
effective sorting of defective parts.
4.2 Test Datasets
The test dataset used for the experiments on datasets
A (Section 4.3) consisted of 24 images, each cap-
turing a different part. 14 images depicted cups in
natural color, including 4 good cups, 5 with color
streak defects, and 5 with short shot defects of vary-
ing sizes. The remaining 10 images featured red cups,
divided into 3 good cups, 4 with color streak defects,
and 3 with short shot defects. For the experiments
on dataset B (Section 4.4), the test dataset comprised
10 blue-colored cups captured under the same condi-
tions. These included 3 good parts, 3 with color streak
defects, and 4 with short shot defects. All images
were captured immediately after production, using a
camera positioned above the cups and a ring light for
illumination against a dark background
3
For the images without defects, the calculation of the
metrics was omitted to avoid artificially boosting the scores.
Expanding Domain Coverage in Injection Molding Quality Inspection with Physically-Based Synthetic Data
507

4.3 Experiments on Datasets A
Table 1 compares the performance metrics of models
trained on datasets A1 and A2. Although metrics can
be compared across different classes, differences in
class sizes and pixel distributions should be consid-
ered when interpreting the results.
Table 1: Metrics of Models A1 and A2 in percentages.
Class Data IoU F1 Recall Prec.
Back- A1 98.63 99.30 99.12 99.49
ground A2 99.16 99.57 99.95 99.21
Cup A1 97.18 98.56 99.31 97.84
A2 93.59 96.36 95.19 98.25
Short A1 5.61 8.47 60.53 20.76
Shot A2 4.17 6.90 43.07 40.88
Streak A1 0.04 0.09 9.14 89.43
A2 1.29 2.38 53.61 31.25
Both models, A1 and A2, were able to segment the
object from the background effectively. This is sup-
ported by their high metrics for the background and
cup classes, consistently exceeding 95% across most
categories. Notably, IoU and F1 scores for the cup
were slightly higher with only real data (A1), while
the background metrics were slightly better with ad-
ditional synthetic data (A2).
Analyzing the segmentation masks with respect
to the defects, model A1 identified pixels for at least
one defect class in 11 of the 24 test images. Among
the red cups, only one with a medium short shot had
pixels correctly segmented into the short shot class.
All other red cups, including those with defects, were
segmented only into the cup and background classes.
None of the red cups with color streaks were recog-
nized.
In natural-colored cups, 10 images had at least
one defect class segmented, while 4 were classified
as good. Two of these cups had large red color
streaks, a defect absent from the training data, which
only included darker streaks. Short shot defects in
natural-colored cups were segmented with varying
accuracy. The largest defects were correctly identi-
fied with large regions around the upper edges, while
smaller short shots were often missed or segmented
inaccurately.
Model A2 correctly segmented 6 images as good
parts, aligning with the ground truth, except for 2 red
cups with small color streaks. Short shot defects in
cups of both colors were segmented, though the seg-
mented regions were smaller than the actual ground
truth defect areas. Conversely, natural-colored parts
often had color streaks over-segmented, with some
defect-free cups falsely identified as having large
streak regions.
Both models performed well for classes with high
pixel representation, such as the background and the
cup. However, performance deteriorated significantly
for defect classes with low pixel representation.
Model A2 performed slightly better overall, correctly
identifying more defects, particularly in red cups,
and achieving more precise edge segmentation for
the cup. However, it tended to over-segment color
streaks. Model A1, despite marginally better metrics
for short shot defects, failed to identify all but the
largest short shot defects in red cups, making it less
effective for practical applications.
Impact of Adding More Synthetic Data. To eval-
uate the effect of increasing the number of synthetic
images, we expanded the dataset from 50 to 200 syn-
thetic samples per defect class, comparing the perfor-
mance of models A2 and A3.
Analyzing the segmentation masks produced by
model A3, the results were notably worse compared
to A2. Of the red cups, only 4 were classified as
good, with 2 correctly segmented, while the remain-
ing 2 were misclassified as good despite having de-
fects (one with a short shot and one with a color
streak). For natural-colored cups, only those with
short shot defects were segmented reasonably well.
In contrast, natural-colored cups with color streaks
were largely misclassified, often with significant over-
segmentation in the defect regions. Additionally, all
red cups with defects were classified as short shots,
which was correct for only 2 cases. The metrics sup-
port this poor performance, showing limited improve-
ments for defect class short shot but significant de-
clines in accuracy for the cup and streak classes.
4.4 Experiments on Dataset B
Table 2 compares the performance of model A1,
trained on real data from natural and red-colored cups,
with model B, which was additionally trained on syn-
thetic images, including defects in blue cups.
Table 2: Metrics of Model A1 vs B on blue colored cups in
percentages.
Class Model IoU F1 Recall Prec.
Back- A1 91.02 95.27 99.18 91.71
ground B 99.29 99.64 99.46 99.83
Cup A1 38.94 54.39 39.36 99.06
B 96.72 98.33 98.73 97.95
Short A1 1.52 2.82 68.59 1.81
Shot B 5.59 8.65 68.62 11.38
Streak A1 1.08 2.08 76.18 1.60
B 0.07 0.13 0.07 100
Both models performed well in segmenting the
background class, achieving high IoU and F1-score.
VISAPP 2025 - 20th International Conference on Computer Vision Theory and Applications
508
They also detected at least one of the two defect
classes in each image, but their accuracy and relia-
bility varied significantly.
Model A1 performed poorly on blue cups, produc-
ing segmentation masks with arbitrary divisions into
cup, short shot, and streak classes, regardless of the
actual presence or absence of defects. This resulted
in similar segmentation patterns across images with
little correlation to the ground truth. Consequently,
the IoU scores for defect classes were extremely low,
and the cup class also showed drastically reduced per-
formance compared to cups of known colors (see Ta-
ble 1). These results highlight that model A1, trained
only on real data from natural and red cups, is com-
pletely unsuitable for inspecting blue cups.
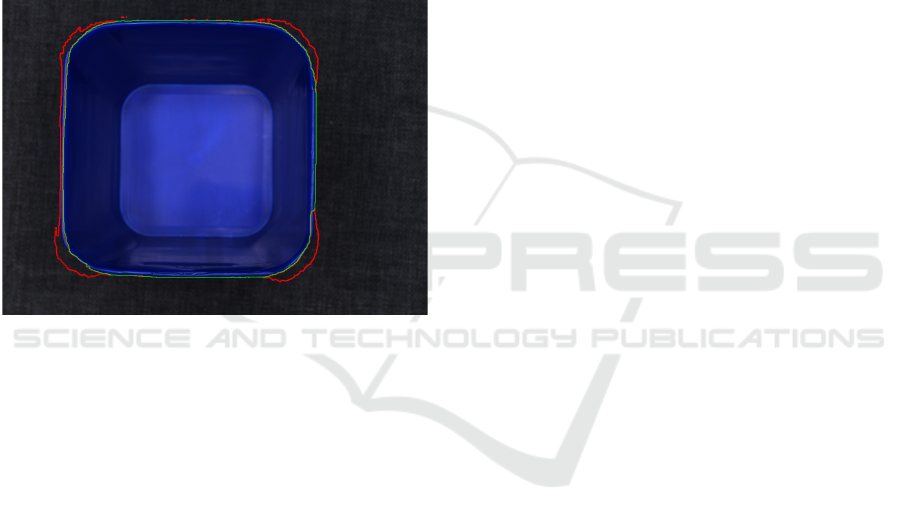
Figure 6: Model B segmentation: cup region in green, short
shot in red (zoomed-in).
Model B, trained with synthetic data including
blue cups, demonstrated a significant improvement
in segmenting the blue cup class, achieving an IoU
of 96.72% and an F1-score of 98.33%. Figure 6 il-
lustrates a segmentation result, where the short shot
region is slightly over-segmented around the cor-
ners, while the cup region is segmented almost per-
fectly. Model B also detected short shot defects accu-
rately when present but exhibited a tendency to over-
segment, leading to false positives in images without
short shot defect. For the color streak class, model B
successfully detected one instance, corresponding to
the largest streak in the dataset; however, it demon-
strated limited capability in accurately segmenting
color streaks overall.
5 DISCUSSION
For classes with high representation, such as the back-
ground, the impact of synthetic data appears minimal,
as the model already performs well. This is likely due
to the consistent camera perspective across all images
and the simple shape of the cup, which make segmen-
tation less challenging.
The observation that model A2 performed better
as model A1, even segmenting the cup more accu-
rately than A1, may seem contradictory to the metrics
in Table 1. A possible explanation is that A2 over-
segmented color streak defects, reducing the number
of pixels attributed to the cup class and lowering its
metrics. This discrepancy underscores the importance
of interpreting metrics alongside visual inspection of
the segmented masks.
Increasing the number of synthetic images per
class can exacerbate imbalances, as seen with model
A3. While short shot segmentation improved, over-
segmentation of color streak defects led to signifi-
cant misclassifications, with many pixels wrongly at-
tributed to the streak class instead of the cup, ulti-
mately degrading overall performance. These find-
ings suggest that careful management of class repre-
sentation and a balanced integration of synthetic and
help achieving better model performance.
For domain expansion, model A1, trained solely
on real data from natural and red cups, failed to accu-
rately segment blue cups. It arbitrarily assigned large
regions of the cup to defect classes, even when no de-
fects were present. This demonstrates that a model
trained only on real data may struggle to segment even
the part under inspection if it comes from a new do-
main, let alone identify defects. By contrast, the use
of synthetic data in model B significantly improved
performance, enabling accurate segmentation of the
blue cup (see Figure 6) and demonstrating the poten-
tial of synthetic data for domain expansion in opti-
cal quality inspection. However, challenges remain,
particularly in accurately segmenting defect classes,
which are often underrepresented in training datasets.
We suggest that generating synthetic images
specifically targeting rare or difficult-to-detect defects
could improve model performance for underrepre-
sented classes. Tailoring synthetic data generation to
the needs of the segmentation task, particularly for
underrepresented defect types, is likely key to achiev-
ing higher defect recognition rates. While the use of
Focal Loss (Ross and Doll
´
ar, 2017) provided some
improvement, it was insufficient to fully address the
class imbalances. This limitation may be partly due to
the relatively simple MobileNetv3 backbone, chosen
for faster training and dataset evaluation. For optimal
performance, more powerful encoders, such as Effi-
cientNet (Tan and Le, 2020), could yield significantly
better results. Additionally, the loss function could be
further refined or customized to better handle under-
represented classes in semantic segmentation.
Expanding Domain Coverage in Injection Molding Quality Inspection with Physically-Based Synthetic Data
509

6 CONCLUSION
In this work, we presented a method to automatically
generate realistic rendered images using 3D computer
graphics software Blender. Additionally, we devel-
oped algorithms to procedurally generate two com-
mon defect types in injection molding: short shots
and color streaks. Our approach also automates the
generation of semantic segmentation labels for parts
and defects, eliminating the labor-intensive process of
manual labeling. This significantly reduces the effort
required to train AI models with synthetic data and
may be used as foundation to further explore the use
of synthetic data for semantic segmenation in quality
inspection tasks.
Our analysis showed that synthetic image data en-
hances the segmentation of inspection objects, even
with sparse real training data. However, improve-
ments in defect segmentation were modest, and sim-
ply increasing the size of synthetic datasets did not
yield consistent benefits. Severe class imbalances,
with defect pixels being both fewer and less fre-
quently represented, likely contributed to this limita-
tion. Future work should address these issues by re-
fining loss functions and carefully balancing synthetic
and real data, particularly for underrepresented defect
classes.
One of the most significant findings is the poten-
tial of synthetic data for domain expansion, particu-
larly for enabling inspection of parts in new colors or
other variations not present in the real training data.
ACKNOWLEDGEMENTS
This research was funded by Bundesministerium
f
¨
ur Bildung und Forschung (BMBF) grant number
01IS22019 A-E.
REFERENCES
Blender (2018). Blender - a 3D modelling and render-
ing package. Blender Foundation, Stichting Blender
Foundation, Amsterdam.
Boikov, A., Payor, V., Savelev, R., and Kolesnikov, A.
(2021). Synthetic data generation for steel defect de-
tection and classification using deep learning. Symme-
try, 13(7):1176.
Bosnar, L., Hagen, H., and Gospodnetic, P. (2023). Pro-
cedural defect modeling for virtual surface inspection
environments. IEEE Computer Graphics and Appli-
cations, 43(2):13–22.
Chen, L.-C., Zhu, Y., Papandreou, G., Schroff, F., and
Adam, H. (2018). Encoder-decoder with atrous sepa-
rable convolution for semantic image segmentation. In
Proceedings of the European conference on computer
vision (ECCV), pages 801–818.
Delgado, G., Cort
´
es, A., Garc
´
ıa, S., Loyo, E., Berasategi,
M., and Aranjuelo, N. (2023). Methodology for gen-
erating synthetic labeled datasets for visual container
inspection. Transportation Research Part E: Logistics
and Transportation Review, 175:103174.
Goodfellow, I. J., Pouget-Abadie, J., Mirza, M., Xu, B.,
Warde-Farley, D., Ozair, S., Courville, A., and Ben-
gio, Y. (2014). Generative adversarial networks.
Howard, A., Sandler, M., Chu, G., Chen, L.-C., Chen, B.,
Tan, M., Wang, W., Zhu, Y., Pang, R., Vasudevan, V.,
et al. (2019). Searching for mobilenetv3. In Pro-
ceedings of the IEEE/CVF international conference
on computer vision, pages 1314–1324.
Paulin, G. and Ivasic-Kos, M. (2023). Review and analy-
sis of synthetic dataset generation methods and tech-
niques for application in computer vision. Artificial
intelligence review, 56(9):9221–9265.
Ross, T.-Y. and Doll
´
ar, G. (2017). Focal loss for dense
object detection. In proceedings of the IEEE con-
ference on computer vision and pattern recognition,
pages 2980–2988.
Schraml, D., Trambitckii, K., and Notni, G. (2024). Pixla-
belcv - labeling images for semantic segmentation
fast, pixel-precise and offline. In Proceedings of the
32nd International Conference in Central Europe on
Computer Graphics, Visualization and Computer Vi-
sion (WSCG 2024), volume 3401 of Computer Sci-
ence Research Notes (CSRN), pages 47–55, Plze
ˇ
n,
Czech Republic.
Tan, M. and Le, Q. V. (2020). Efficientnet: Rethinking
model scaling for convolutional neural networks.
Tsirikoglou, A., Eilertsen, G., and Unger, J. (2020). A sur-
vey of image synthesis methods for visual machine
learning. In Computer graphics forum, volume 39,
pages 426–451. Wiley Online Library.
VISAPP 2025 - 20th International Conference on Computer Vision Theory and Applications
510
