
Machine Learning-Driven Classification of Polyethylene (HDPE, LDPE)
via Raman Spectroscopy
Evangelos Stergiou
a
, Fotios K. Konstantinidis
b
, C. Stefani
c
, G. Arvanitakis
d
,
Georgios Tsimiklis
e
and Angelos Amditis
f
Institute of Communication and Computer Systems, National Technical University of Athens, 9 Iroon. Polytechniou Str.,
Zografou Athens GR-157 73, Greece
{vangelis.stergiou, fotios.konstantinidis, christina.stefani, giorgos.arvanitakis, georgios.tsimiklis, angelos.amditis}@iccs.gr
Keywords:
Raman Spectroscopy, Gradient Boosting, Polyethylene, Classification, Machine Learning.
Abstract:
Polymer industries are currently focusing on developing new methods for identifying Polyethylene (PE) cate-
gories through rapid and non-destructive characterization techniques (NDT) to improve their production pro-
cesses or recycling process control. However, NDT for classification is challenging for PE categories due to
their identical chemical structures. This work presents a data-driven method for classifying PE to its two main
categories, Low-Density Polyethylene (LDPE) and High-Density Polyethylene (HDPE). The method is using
Raman spectroscopy, with the spectrums being processed to select the features, which are decisive for the
classification of the different types of PE. PE samples in the form of granules are subjected to spectroscopic
measurements, followed by data pre-processing in order for the signals to be enhanced. Using a Gradient
Boosting model, the selected spectral features were used to train and validate the model. The model achieved
an accuracy rate of 97 %, indicating the potential of the proposed method for rapid and accurate separation of
LDPE and HDPE. This performance is not limited to PE granules but also to different plastic types (e.g. film,
bottles, etc.). This approach offers a rapid method to classify polyethylene types, making the method suitable
for industrial uses.
1 INTRODUCTION
PE is one of the most widely used polymers in the
industry and the applications of this polymer range
from packaging products to manufacturing materials
for the automotive industry. A critical factor that af-
fects the properties of polyethylene, such as strength,
flexibility, breathability, water vapor transmission,
etc. is its density, which can be classified into low
(LDPE) and high (HDPE). However, the classification
of these two types of polyethylene is a challenging
topic, as they present similar characteristics in their
macromolecular structure and the structure of their
functional groups, with the main difference being the
branches in the polymer chains (Bruns, 2022).
These types of polymers consist of repeating
(−CH
2
−) units (methylene groups) and an alkyl
a
https://orcid.org/0009-0009-5922-0757
b
https://orcid.org/0000-0002-1826-6582
c
https://orcid.org/0000-0002-8818-075X
d
https://orcid.org/0000-0003-2414-6891
e
https://orcid.org/0000-0002-2431-8529
f
https://orcid.org/0000-0002-4089-1990
polymer that usually does not contain side chains. In
the case of LDPE, however, there are more side chain
branches in its polymer chains, consisting of methyl
groups (−CH
3
−) (Vollmert, 2012). These branches
interfere with the regular arrangement of the polymer
chains, causing a decrease in crystallinity and thus a
lower density. In contrast, HDPE exhibits less branch-
ing, allowing the chains to organize more regularly
and form high-density crystalline regions Figure 1.
These structural differences make their classification
in the manner of density difficult with traditional char-
acterization methods (Baxter et al., 2020)
Accurate identification of PE density is critical
in the production processes as it affects the physico-
chemical properties of the material, such as mechan-
ical strength, thermal stability, and chemical resis-
tance (Konstantinidis et al., 2023a). The ability to
quickly and accurately classify between LDPE and
HDPE is critical for quality assurance and select-
ing appropriate processing procedures. Nowadays,
the density calculation of polyethylene is mainly car-
ried out by destructive characterization methods or
a combination of methods that require repeatability
326
Stergiou, E., Konstantinidis, F. K., Stefani, C., Arvanitakis, G., Tsimiklis, G. and Amditis, A.
Machine Learning-Driven Classification of Polyethylene (HDPE, LDPE) via Raman Spectroscopy.
DOI: 10.5220/0013254000003905
Paper published under CC license (CC BY-NC-ND 4.0)
In Proceedings of the 14th International Conference on Pattern Recognition Applications and Methods (ICPRAM 2025), pages 326-334
ISBN: 978-989-758-730-6; ISSN: 2184-4313
Proceedings Copyright © 2025 by SCITEPRESS – Science and Technology Publications, Lda.

and time which is a deterrent for a production line.
Thus, developing a quick and non-destructive tech-
nique with high performance in categorizing these
materials will significantly contribute to the simplifi-
cation of the quality control process and the efficient
management of raw materials (Shebani et al., 2018).
Figure 1: Chemical Structures of LDPE and HDPE.
One of the most significant and widely used an-
alyzing technique is Raman Spectroscopy (Katha-
rina Eberhardt and Popp, 2015). Raman spectroscopy
offers a non-destructive and reliable tool to analyze
the molecular structures of polymers, providing infor-
mation about the vibrational states of the molecules.
Although spectral signatures and especially Raman
Spectrums of LDPE and HDPE are similar due to
their common chemical composition, there are slight
differences in the spectra related to the presence of
methyl groups and the degree of branching.
This work proposes an innovative approach to
classify polyethylene based on its structure (macro-
molecules) density, using Raman spectroscopy com-
bined with a machine learning model, which an ad-
vanced machine learning model can detect. The main
objectives of this classification approach can be dis-
tinguished into three key axes:
• The introduction of a rapid and non-destructive
classification approach based on Raman spec-
troscopy, capable of classifying the PE materials
into two main categories (LDPE, HDPE).
• The exploitation of an advanced machine learn-
ing model which is trained on a limited volume
of pure PE granules analyzed data from Raman
spectroscopy.
• The sensitive analysis regarding different param-
eters of the problem (e.g. different measurement
times, forms of PE plastics), with high prediction
accuracies.
This approach provides an automated, fast, and
accurate way to separate the two types of PE, facilitat-
ing both the production process and the identification
of the material in various applications.
2 RELATED WORKS
The classification of different types of polyethylene is
a major challenge for research, as the differences in
their structure are often too subtle to be detected by
traditional methods. Many researchers work mainly
focus on the quantification of polyethylene blends
(blends) rather than the categorization of pure materi-
als and with a limited amount of samples, which indi-
cates a gap in the existing literature.
Silva and Wiebeck suggest the use of Raman spec-
troscopy combined with the CARS-PLS (Competi-
tive Adaptive Reweighted Sampling - Partial Least
Squares) technique to quantify LDPE and HDPE as
blends but not for classification of different PE mate-
rials based on their density. This method shows re-
liable results with prediction errors for LDPE con-
centration. Despite the difficulty in LDPE/HDPE
discrimination, the researchers were able to improve
the accuracy of the predictions through modifica-
tions to the model parameters. This work demon-
strates the potential of Raman spectroscopy combined
with chemometric techniques to accurately categorize
polymer mixtures. Although this approach achieved
some good results, there is a limitation in the number
of samples that were been used and also this study
focused on blends of PE (Silva and Wiebeck, 2019).
In addition, the majority of related research
chooses to combine more than one spectroscopic
technique, such as Raman spectroscopy, ATR-FTIR,
and NIR, to improve the separation performance and
increase the accuracy of the prediction models. The
classification of HDPE and LDPE is made more ex-
pensive and resource-intensive by this combination of
methods.
This is also reflected in a previous study of Silva
and Wiebeck (da Silva and Wiebeck, 2017) accord-
ing to which it’s used Raman and FTIR spectroscopic
data combined with variants of the PLS method, such
as iPLS and siPLS, to improve the prediction perfor-
mance of LDPE/HDPE blends. However, the need to
use multiple techniques demonstrates the challenge of
distinguishing polymers with a single technology.
Similarly, the study of (Sato et al., 2002), focuses
on the use of Raman spectroscopy combined with an-
alytical multivariate analysis techniques (such as Dif-
ferential Calomitery Spectrometry) to characterize the
physical properties of HDPE, LDPE, and linear low
density (LLDPE) polyethylene. The study aimed to
better understand the spectral behavior of the three
types of polyethylene and to develop models for their
density, crystallinity and melting point. The authors
used principal component analysis (PCA) and partial
least squares (PLS-1) regression on Raman spectro-
Machine Learning-Driven Classification of Polyethylene (HDPE, LDPE) via Raman Spectroscopy
327

scopic data derived from LDPE, HDPE and LLDPE
samples and a combination of characterization tech-
niques and a limited amount of samples.
In other works (Konstantinidis et al., 2023c),
(Konstantinidis et al., 2023b), detailed solutions for
the classification of waste materials in an industrial
case (sorting systems) are presented, the sorting of
the entire range of plastics is done using multispec-
tral imaging data in tandem use of AI-driven solutions
powered by advanced neural network models.
Moreover in (Sifnaios et al., 2024) publiction,
a light-weight model is introduced for pixel-level
classification of Hyperspectral images of plastics.The
aforementioned studies introduce innovative methods
in material sorting however, fail to address the classi-
fication of individual categories of PE, i.e. LDPE and
HDPE.
Accordingly, the study by Workman Jr (1999) in-
corporated Raman, NIR, and IR spectroscopy data for
the quantitative analysis of LDPE, LLDPE and HDPE
blends, achieving high accuracy (1-5 absolute error).
The results showed that the combined approach of-
fers greater accuracy than using individual techniques
due to the different spectral regions analyzed by each
method (Workman Jr, 1999).
In contrast to the above studies, the present study
focuses on the classification of pure types of PE
(LDPE and HDPE) without the need of combin-
ing different characterization techniques or complex
statistics methods to identify critical factors for the
classification. Furthermore, in this method, a high
amount of samples were used for better accuracy and
validation metrics. The method is based solely on
Raman spectroscopy, while the use of the Gradient
Boosting machine learning model allows accurate cat-
egorization of pure materials based on the spectrum
peaks. This reduces the complexity of the method
and makes the identification process more direct and
easier to use in quality control and production appli-
cations. In this way, our approach aims to develop a
fast, automated, and non-destructive system, capable
of separating pure polyethylene types with high pre-
cision, without the use of multiple techniques or an-
alytical methods, and ready to be adapted to various
processes of PE.
3 METHODOLOGY
The methodology followed in the present study is a
multidimensional approach combining Raman spec-
troscopy and machine learning to accurately and
quickly classify PE samples. Raman spectroscopy
was chosen because of its ability to probe the vibra-
tional states of molecules, allowing analysis of the
crystalline and amorphous regions of polymers in a
rapid and efficient NDT way. First, Raman spec-
troscopy measurements were performed on LDPE
and HDPE samples to obtain spectral data. These
data were pre-processed to remove noise and improve
their quality. Then, during the feature selection pro-
cess, the most important peaks that differentiate the
two PE categories were selected. These selected fea-
tures were used to train a Gradient Boosting machine
learning model, which was evaluated through metrics
such as Accuracy. The proposed methodology is de-
scribed in detail below, focusing on the optimization
of each step and the efficiency of the final sample clas-
sification Figure 2.
3.1 Data Generation
3.1.1 Samples
In the present study, PE samples with low and high
densities were used for Raman spectrum analyses.
The samples were in the form of pellets (granules)
and consisted of pure LDPE and HDPE.
3.1.2 Spectroscopic Technique
For the spectroscopic analysis of the samples, the
Handheld Raman Spectroscope C15471 by HAMA-
MATSU was used. Measurements were performed
on a total of 400 samples, of which 200 were LDPE
and 200 HDPE. Regarding the parameters of mea-
surements, the Measurement time (M t) was from 1
to 3 seconds and the Distance (D) was chosen based
on the sample holder of the device. The Power (P) of
monochromatic radiation was 50 mW with a wave-
length of 785 nm. In general, the measurements
were performed with different recording times and
constant settings in rest parameters to assess the effect
of the measurement time on the quality of the spectra.
About the (M t) where used:
• 50 LDPE and 50 HDPE samples—were analyzed
with a (M t) of 1 seconds.
• 100 LDPE and 100 HDPE samples—were ana-
lyzed with a (M t) of 2 second.
• 50 LDPE and 50 HDPE samples—were analyzed
with a (M t) of 3 seconds.
The output of each measurement was spectrums
in csv form. During each spectroscopic measurement,
all spectrometer parameters remained constant to en-
sure the uniformity of the spectra and the reliability
of the results.
ICPRAM 2025 - 14th International Conference on Pattern Recognition Applications and Methods
328
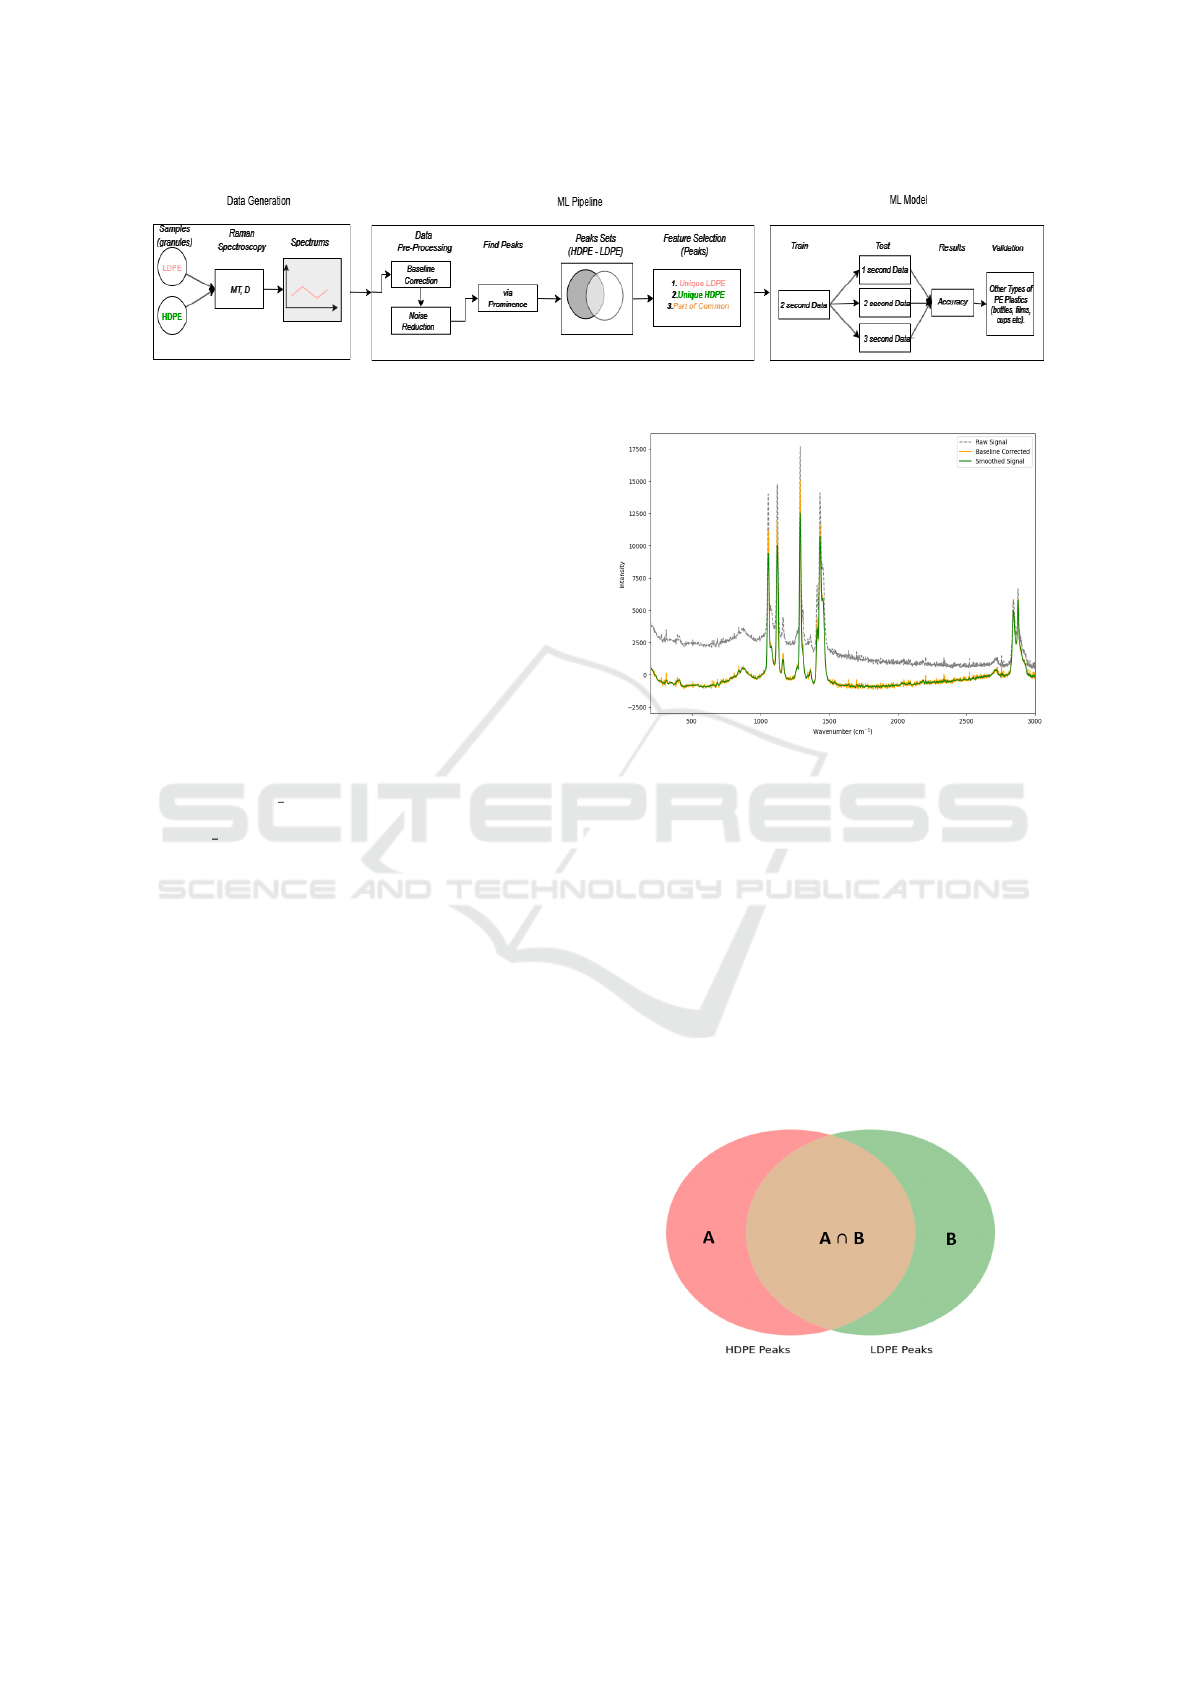
Figure 2: The Data-Driven Method Process.
3.2 ML Pipeline
3.2.1 Data Pre-Processing
The spectroscopic data were pre-processed to im-
prove the quality of the spectra and remove unwanted
distortions. Specifically, the following techniques
were applied:
Background Removal (Baseline Correction):
Used to eliminate the unwanted background com-
ponent in the spectra, ensuring that the peak
characteristics of the samples remained unchanged
and the information from the spectrum was not
distorted. The mathematical relationship of baseline
correction can be described in Equation 1:
y c(x) = y(x)–Pol(x) , (1)
where y c(x) is the corrected spectrum after the sub-
station of the polynomial, y(x) is the raw spectrum,
and Pol(x) is the fitting polynomial, which is sub-
tracted to eliminate the background component.
Noise Reduction: The Savitzky-Golay technique
(Gallagher, 2020), which applies a polynomial fit to a
window of data, was used to reduce noise by 2m + 1
points, where m is the window size. The relationship
of smoothing to the Savitzky-Golay technique can be
described in Equation 2:
ˆy
i
=
m
∑
j=−m
c
j
· y
i+ j
, (2)
where ˆy
i
is the estimated value at the point y
i+ j
of the
smoothed spectrum, and the initial value of the spec-
trum at the point (i + j) and c
j
are the coefficients of
the polynomial applied to each data window. The fit-
ting polynomial used in the above methods was 3rd
degree, depending on the desired level of smoothing
and minimization of spectral peak distortion. The out-
put of these methods can be described in Figure 3.
3.2.2 Find Peaks
For the peaks identification of each measurement
where used a function with specific parameters. This
Figure 3: Raman Spectrum Plots during data pre-
processing.
function takes a 1-D array and finds all local max-
ima by a simple comparison of neighboring values.
Optionally, a subset of these peaks can be selected
by specifying conditions for a peak’s properties. The
main parameter was the prominence as it was suitable
for this study, so the process of peak identification for
each measurement be more reliable for the upcom-
ing data analysis. Prominence refers to how much a
peak stands out from others or from noise in the spec-
trum. The peaks selected must have specific intensity
according to the value of prominence to represent the
real characteristics of the polymer and not be due to
random fluctuations.
Figure 4: The Selection of Peaks on the Sets of LDPE and
HDPE.
Machine Learning-Driven Classification of Polyethylene (HDPE, LDPE) via Raman Spectroscopy
329

3.2.3 Peak Sets
After the Pre-Processing of spectrums for both cate-
gories, the data were summarized in the form of Table
2, and Table 3. These tables show the possibility of
appearance for each identified Peak
i
at each category
of PE. For a given observation i that belongs to the
category c of the PE, Peak
i
corresponds to the value
of wavenumber
i
(cm
−1
) where the peak is spotted in
the corresponding PE category (c), and N c is the to-
tal number of observation that belongs in the corre-
sponding category (c). Count
i
is the total appearance
of the peak
i
in the entire class c for each category and
Possibility
i
the possibility of the appearance of peak
i
as Equation 3:
Possibility
i
=
Count(Peak
i
)
N c
. (3)
Unique peaks were observed in each category of
PE, however there was of low possibility of appear-
ance. On the contrary, the common peaks that were
found were those with the highest possibility of ap-
pearing in each category, which proves the difficulty
of the classification in these two types of PE. Finally,
the sets of peaks for each category could be present as
Ven’s Diagram on Figure 4.
3.2.4 Features Selection
The selection of features was based on the possibil-
ity of the appearance of the peaks in each type of PE.
More specifically after the analysis of the spectrums
for both categories, we summarized the data in the
form of Table 2 and Table 3, the peaks selected as
features (F) for the model met specific separation cri-
teria between the HDPE and LDPE classes, based on
Equation 4.
F = (A − B) ∪ (B − A) ∪
{
x : x ∈ A ∩ B & |P(x)| > T
}
(4)
where:
• A: The set of HDPE peaks.
• B: The set of LDPE peaks.
• A − B: The set of peaks that are unique to HDPE,
meaning peaks that exist in A but do not appear in
B. This subset captures peaks exclusive to HDPE
samples.
• B − A: The set of peaks that are unique to LDPE,
meaning peaks that exist in B but not in A. This
subset captures peaks exclusive to LDPE samples.
• A ∩ B: The intersection of sets A and B, represent-
ing the peaks that are common to both HDPE and
LDPE samples.
• P(x): The absolute difference in the probability
of appearance of a common peak x between the
two categories, HDPE and LDPE. Formally, if
P
HDPE
(x) and P
LDPE
(x) represent the probability
of appearance of peak x in HDPE and LDPE re-
spectively, then Equation 5:
P(x) =
|
P
HDPE
(x) − P
LDPE
(x)
|
. (5)
This value is used to determine if the difference in
occurrence between the two categories is signifi-
cant based on the threshold T .
• T : The threshold for the probability difference.
Only peaks where |P(x)| > T are considered sig-
nificant for inclusion in the set of common peaks.
• {x : x ∈ A ∩ B & |P(x)| > T }: The set of common
peaks between HDPE and LDPE that have an ab-
solute difference in the possibility of appearance
greater than the threshold T . This subset filters
the intersection of A and B to include only peaks
with a statistical difference in appearance.
As described before, the classification of PE us-
ing Raman spectroscopy and based on the peaks de-
tection is a challenge, as the two materials have the
same chemical composition. Their main difference
lies in the structure of the polymer chains, such as
branching, which affects their physical information
but is not always apparent in spectral analyses. Due
to this structural similarity, many common peaks ap-
pear in the spectra of both types of PE, as both ma-
terials are composed of the same molecular groups,
such as methylene groups (-CH
2
-). The appearance
of these common peaks makes it difficult to directly
classify the two types of polyethylene based solely on
their spectral signatures. For this reason, it becomes
necessary to identify peaks where there is a specific
difference (Threshold) in their probability of occur-
rence between LDPE and HDPE. About the Thresh-
old value, this was applied to the difference in the
probability of a peak occurring between LDPE and
HDPE as the relation (4). Specifically, the selection
of features was based on the relationship These peaks
can serve as the key features to accurately classify the
two materials, offering a more reliable basis for their
separation by Raman spectroscopy.
After the analysis, the resulting optimal values for
the feature selection were: Threshold = 30%: This
value ensures that only peaks that have a distinct dif-
ference in probability of occurrence between LDPE
and HDPE are selected. Prominence = 100: This
prominence ensures that only peaks with significant
intensity, which stand out from the noise, are se-
lected as features. These values led to the selection
ICPRAM 2025 - 14th International Conference on Pattern Recognition Applications and Methods
330

of the most distinctive peaks, which helped to op-
timize the performance of the model, ensuring high
accuracy and reliability in classification. The selec-
tion of features based on the two parameters, thresh-
old and prominence, proved to be decisive for the per-
formance of the model. The threshold value at 30%
allowed the selection of peaks that effectively differ-
entiate LDPE from HDPE while the correct choice
of prominence ensured that only peaks representing
significant features of the spectra were used and not
random noise or meaningless peaks.
Finally, the form of the selected features is de-
scribed in Table 1 where 0 is picked if the specific
peak does not exist in the file of the row and 1 if ex-
ists.
Table 1: Selected Features for the Training of ML Model.
F List: A B A ∩ B Category
sample: 0 or 1 HDPE or LDPE
3.3 ML Model
Gradient Boosting (GB) was selected for the classifi-
cation of the PE samples (LDPE and HDPE). GB is a
robust ML algorithm that builds an ensemble of weak
models, typically decision trees and improves their
performance to create a strong predictive model with
high accuracy.This method is based on the progres-
sive strengthening (boosting) of the models, where
each new model tries to correct the errors of the pre-
vious one, thus reducing the overall prediction error
(Zhang and Yin, 2023).
To optimize the model’s performance, certain set-
tings were adjusted during the Gradient Boosting
Classifier training process. The settings for this model
set as follows:
• n estimators=150: This parameter defines the
number of boosting stages or weak learners (de-
cision trees) the model should use.
• learning rate=0.1: This is the pace at which the
model gains knowledge by modifying each new
tree’s contribution.
• max depth=3: This parameter determines the
maximum depth of each decision tree. With a
setting of 3, the model restricts the complexity of
each tree, which can help prevent overfitting and
promote generalizability.
• criterion=’friedman mse’: This setting was made
to guarantee that the outcomes could be repli-
cated. Fixing the random state allows for consis-
tent results across runs by controlling the random-
ness of some model training phases.
3.3.1 Train
For the training of the model, the data used was
on M t (measurement time) of 2 seconds and in an
amount of 200 samples.
The dataset was subjected to 10-fold cross-
validation to prevent overfitting and provide a solid
performance evaluation. Cross-validation divides the
dataset into ten equal-sized subsets (folds) to produce
a more accurate estimate of the model’s performance.
Nine folds were utilized for training and one fold for
testing in each cycle. Each fold was utilized as a test-
ing set exactly once during the 10 iterations of this
procedure. The final accuracy was calculated as the
average of the accuracies across all ten iterations, pro-
viding a trustworthy measure of the model’s general-
izability.
3.3.2 Test
Following training, the model’s performance was
evaluated using a distinct dataset, excluding the M t
2 seconds data on which it was initially trained. In or-
der to measure the robustness of the model to samples
of different acquisition times, than the data used in the
training, we test on 100 samples of M t 1 second and
100 samples of M t 3 seconds. This variance in mea-
surement periods provided insights into the model’s
performance with a range of sample parameters. It
allowed for the evaluation of the model’s resilience
and flexibility to minor modifications in data collec-
tion conditions.
In order to assess the model’s classification accu-
racy in real-world applications, it was lastly evaluated
on commercially accessible plastic shapes, like bot-
tles, films, and cups. The amount of commercial PE
plastics tested was: 10 bottles, 10 cups, and 4 films.
Also, for each sample, measurements were taken at
8 points to increase the reliability of the prediction
model .
4 RESULTS & DISCUSION
The results of the cross-validation process are pre-
sented in Table 4. The model was evaluated using
10 different folds, with scores ranging from 0.80 to
1.00. The mean score was 0.90, indicating accurate
and consistent model performance across all valida-
tion sets.
The high average accuracy suggests that the model
generalizes effectively to different subsets of the data.
Furthermore, the low variance in the scores indicates
stability in the model’s performance, further enhanc-
ing its reliability. Importantly, the absence of ex-
Machine Learning-Driven Classification of Polyethylene (HDPE, LDPE) via Raman Spectroscopy
331
Table 2: HDPE Peak Information.
HDPE Peak
i
Count
i
Possibility
i
HDPE Peak
1
Count
1
PHDPE
1
HDPE Peak
2
Count
2
PHDPE
2
HDPE Peak
3
Count
3
PHDPE
3
.
.
.
.
.
.
.
.
.
HDPE Peak
n
Count
n
PHDPE
n
Table 3: LDPE Peak Information.
LDPE Peak
i
Count
i
Possibility
i
LDPE Peak
1
Count
1
PLDPE
1
LDPE Peak
2
Count
2
PLDPE
2
LDPE Peak
3
Count
3
PLDPE
3
.
.
.
.
.
.
.
.
.
LDPE Peak
n
Count
n
PLDPE
n
Table 4: Cross-Validation Scores and Mean.
Fold Score
1 0.95
2 0.95
3 0.80
4 0.80
5 0.85
6 0.95
7 0.85
8 1.00
9 0.95
10 0.90
Mean 0.90
tremely high scores coupled with consistent results
suggests that the model does not suffer from overfit-
ting, as it maintains balanced performance across all
folds.
The results, as analyzed below, demonstrated that
the trained model with data of M
t = 2 seconds, was
able to classify PE categories for each M t with high-
est accuracy 97% Table 5. Furthermore, the predic-
tion accuracy remained high for the random PE plas-
tic types Table 6.
Table 5: Model Performance on Different Time Measure-
ments.
M t (sec) Num. of Samples Acc. (%)
1 100 86
2 100 97
3 100 76
Table 6: Model Performance on Different Plastic Types.
Type Num. of Samples Acc. (%)
LDPE film 2 100
HDPE film 2 100
HDPE cup 5 80
LDPE cup 5 80
HDPE bottle 5 80
LDPE bottle 5 100
The test on the samples with M t of 1 second
showed an Accuracy of 86% . Although faster data
acquisition is desirable, a decrease in the accuracy and
quality of predictions is observed, which can be at-
tributed to the increased presence of noise due to the
short M t. The performance of the model with an M t
of 2 seconds was on 97%. For the data with an M t
of 3 seconds, the model scored the lower Accuracy
of 76%, The results show that for the fastest and most
reliable spectroscopic analysis, the measurement time
of 2 seconds is the most efficient choice, offering high
accuracy in the classification of LDPE and HDPE.
About the commercial PE plastics, an over 90% ac-
curacy was observed with an excellent model perfor-
mance on the classification of PE films Table 6.
The results of the present study confirm the effec-
tiveness of the proposed method to categorize PE into
LDPE and HDPE using Raman spectroscopy and ma-
chine learning models. The use of Gradient Boost-
ing proved to be particularly efficient, as it was able
to accurately classify the two classes, overcoming the
challenges arising from the similarity of spectral char-
acteristics between LDPE and HDPE.
4.1 Features Importance
On the model performance and accuracy and for the
understanding of the differences in chemical struc-
tures of both categories, we must take into consider-
ation the feature importance of the used model Table
7. As we see the peak on 927.27 cm
−1
was the most
important peak for the model to be able to classify
the category of PE. As shown in Figure 5, in the plot
of the Standard Deviation of spectrums, the specific
peak appeared in low intensity. But in Figure 6, it is
clear that the difference in this peak proves the impor-
tance of the model classification. More specifically, it
is clearly shown that the peak appeared mostly for the
HDPE category. Quite so, this feature importance was
noticed also from the outputs of data pre - processing
where the specific peak appeared in 65% of the HDPE
samples, in contrast to the LDPE category where the
peak didn’t appear at whole sampling.
ICPRAM 2025 - 14th International Conference on Pattern Recognition Applications and Methods
332
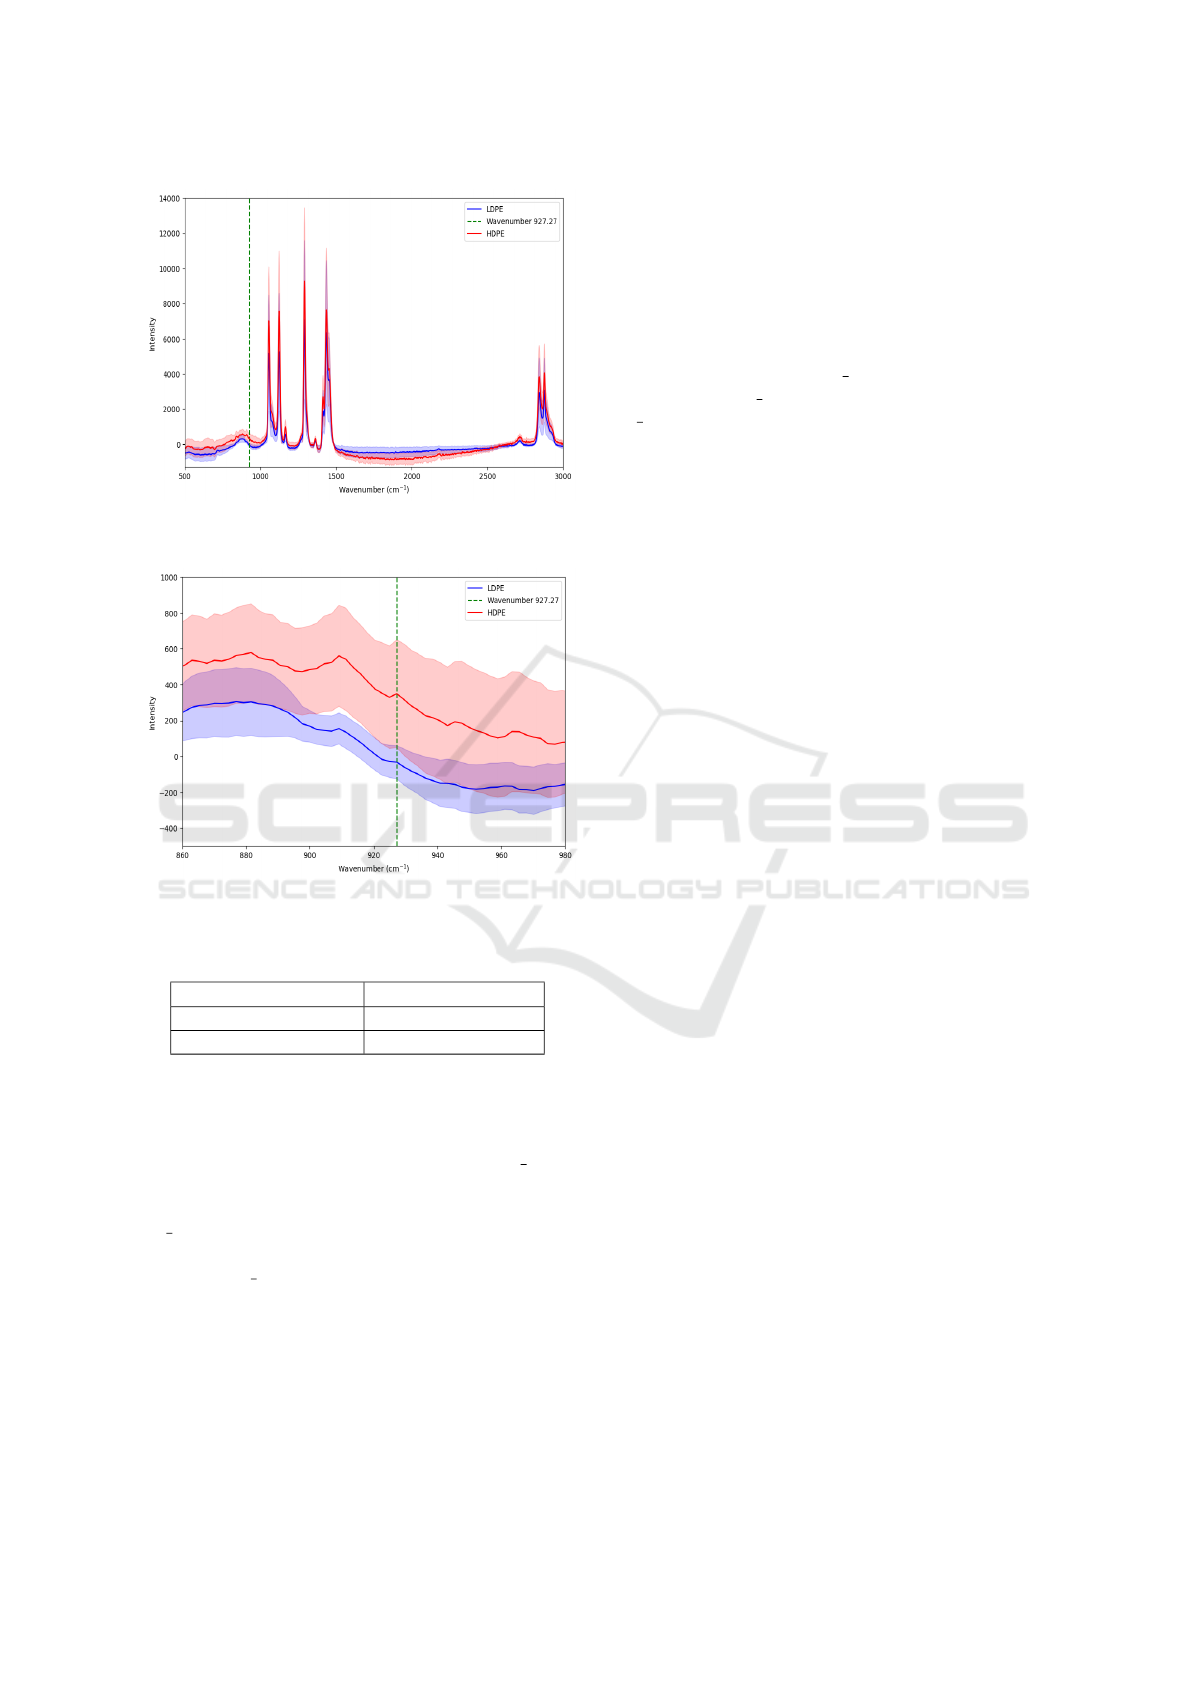
Figure 5: Comparison of Two Mean Raman Spectra with
Standard Deviation.
Figure 6: Comparison of Two Mean Raman Spectra with
Standard Deviation.
Table 7: Feature Importance for Raman Shift Values.
Wavenumber (cm
−1
) Feature Importance
927.27 0.43
Rest of the Peaks <0.1
4.2 Limitations
The comparatively low accuracy (76%) where been
found in the prediction of the dataset with M t of 3
seconds is a limitation of the current investigation.
The model was particularly trained on data with a
M t of 2 seconds, which is probably why the accu-
racy was lower. More noise is added to the spectrum
signals as M t rises, making it harder for the trained
model in different circumstances to manage. This in-
dicates susceptibility to changes in the measurement
interval and suggests that performance may decline
when acquisition times increase from the training cir-
cumstances.
5 CONCLUSION AND FUTURE
WORK
A data-driven method with data from Raman Spec-
troscopy and the evaluation of the gradient boosting
model algorithm were been used to predict the cate-
gories of the PE. The model showed different values
of accuracy for different M t with the highest being
for the data of M t 2 seconds and the lowest being at
M t 3 seconds. Furthermore, the model showed high
accuracy on random types of PE plastics.
So we conclude from the above that a machine
learning model with its training through a large
amount of Raman spectroscopy data, can predict with
a high success rate the category of an unknown PE
sample both in the form of granule and in the form of
commercial plastic.
Also, in the features’ importance values, it is noted
that the peak 927.27 cm
−1
had a crucial role in the
classification decisions of the model. Also, the spe-
cific peak appeared mostly on HDPE samples. This
finding should be studied further in order to under-
stand the reason for these peak differences in the com-
plex study of PE classification and in the literature
so far, regarding the characteristic Raman peaks of
PE (Jin et al., 2017).
The Raman method, as it is shown to yield ex-
cellent results after the training carried out in the
present project, offers interesting horizons for fur-
ther research. In particular, an additional study of
the method could lead to an improvement of its ac-
curacy and efficiency, to significantly reduce analysis
times. This perspective would be a significant advan-
tage, paving the way for its use in real-time (online)
production processes, making the method suitable for
integration into production lines where rapid and reli-
able analysis is required.
Ultimately, according to the presented study, more
PE categories could be used with the aim to classifi-
cation of a wider range of plastic materials.
ACKNOWLEDGEMENTS
This research was financially supported by the Euro-
pean Union’s Horizon Europe research and innova-
tion program under grant agreement No 101058540
(project PLASTICE).
REFERENCES
Baxter, L., Herrman, K., Panthi, R., Mishra, K., Singh,
R., Thibeault, S., Benton, E., and Vaidyanathan,
Machine Learning-Driven Classification of Polyethylene (HDPE, LDPE) via Raman Spectroscopy
333

R. (2020). Chapter 3 - thermoplastic micro- and
nanocomposites for neutron shielding.
Bruns, B. (2022). 1. atr-ftir spectroscopy combined
with chemometric methods for the classification of
polyethylene residues containing different contami-
nants. Journal of Polymers and The Environment.
da Silva, D. J. and Wiebeck, H. (2017). Using pls, ipls and
sipls linear regressions to determine the composition
of ldpe/hdpe blends: a comparison between confocal
raman and atr-ftir spectroscopies. Vibrational Spec-
troscopy, 92:259–266.
Gallagher, N. B. (2020). Savitzky-golay smoothing and dif-
ferentiation filter. Eigenvector Research Incorporated.
Jin, Y., Kotula, A. P., Snyder, C. R., Hight Walker, A. R.,
Migler, K. B., and Lee, Y. J. (2017). Raman iden-
tification of multiple melting peaks of polyethylene.
Macromolecules, 50(16):6174–6183.
Katharina Eberhardt, Clara Stiebing, C. M. M. S. and Popp,
J. (2015). Advantages and limitations of raman spec-
troscopy for molecular diagnostics: an update. Ex-
pert Review of Molecular Diagnostics, 15(6):773–
787. PMID: 25872466.
Konstantinidis, F. K., Myrillas, N., Tsintotas, K. A.,
Mouroutsos, S. G., and Gasteratos, A. (2023a). A
technology maturity assessment framework for indus-
try 5.0 machine vision systems based on systematic
literature review in automotive manufacturing. Inter-
national Journal of Production Research, pages 1–37.
Konstantinidis, F. K., Sifnaios, S., Arvanitakis, G., Tsimik-
lis, G., Mouroutsos, S. G., Amditis, A., and Gaster-
atos, A. (2023b). Multi-modal sorting in plastic and
wood waste streams. Resources, Conservation and
Recycling, 199:107244.
Konstantinidis, F. K., Sifnaios, S., Tsimiklis, G., Mourout-
sos, S. G., Amditis, A., and Gasteratos, A. (2023c).
Multi-sensor cyber-physical sorting system (cpss)
based on industry 4.0 principles: A multi-functional
approach. Procedia Computer Science, 217:227–237.
Sato, H., Shimoyama, M., Kamiya, T., Amari, T.,
ˇ
Sa
ˇ
sic, S.,
Ninomiya, T., Siesler, H. W., and Ozaki, Y. (2002).
Raman spectra of high-density, low-density, and lin-
ear low-density polyethylene pellets and prediction of
their physical properties by multivariate data analysis.
Journal of applied polymer science, 86(2):443–448.
Shebani, A., Klash, A., Elhabishi, R. G., Abdsalam, S.,
Elbreki, H., and Elhrari, W. (2018). 1. the influ-
ence of ldpe content on the mechanical properties of
hdpe/ldpe blends.
Sifnaios, S., Arvanitakis, G., Konstantinidis, F. K., Tsimik-
lis, G., Amditis, A., and Frangos, P. (2024). A deep
learning approach for pixel-level material classifica-
tion via hyperspectral imaging.
Silva, D. J. d. and Wiebeck, H. (2019). Predicting ldpe/hdpe
blend composition by cars-pls regression and confocal
raman spectroscopy. Pol
´
ımeros, 29:e2019010.
Vollmert, B. (2012). Polymer chemistry. Springer Science
& Business Media.
Workman Jr, J. J. (1999). Quantification of ldpe [low den-
sity poly (ethylene)], lldpe [linear low density poly
(ethylene)], and hdpe [high density poly (ethylene)] in
polymer film mixtures “as received” using multivari-
ate modeling with data augmentation (data fusion) and
infrared, raman, and near-infrared spectroscopy. Spec-
troscopy Letters, 32(6):1057–1071.
Zhang, J. and Yin, K. (2023). Application of gradient boost-
ing model to forecast corporate green innovation per-
formance. Frontiers in Environmental Science.
ICPRAM 2025 - 14th International Conference on Pattern Recognition Applications and Methods
334
