
Development of WHO Guideline-Complying CD4 Diagnostic Chip
Hee Sik Shin and Sungyoung Choi
Hanyang University, Seoul, Korea
Keywords: HIV, Automated Cell Counting, Lego-based Smartphone Microscope, Microfluidics, Negative Selection.
Abstract: Accurate HIV diagnosis using current WHO complying diagnostic chips that measure CD4 protein expression
faces challenges due to donor variability in expression levels and difficulties in isolating target cells with high
purity. To overcome these limitations, quantitative measurement of CD4
+
and CD8
+
T cells, along with the
effective removal of red blood cells (RBCs) and granulocytes, is essential. We present a self-powered CD4
diagnostic chip platform designed for high0purity target cell separation using a small volume of whole blood.
The CD4 diagnostic chip employs magnetic separation to remove non-target cells through negative selection,
utilizing ferromagnetic particle-filled inlets and a magnet positioned beneath the inlet. Excessive RBCs and
target cells are further separated by size using a microfluidic lattice. This rapid separation process, facilitated
by a degassed polydimethylsiloxane (PDMS) chip, achieves efficient target cell isolation within 20 minutes.
During separation, the LEGO-integrated smartphone microscope records a real-time video, which is analyzed
using Python-based code. The code distinguishes and removes excess granulocytes based on pixel intensity
and precisely counts pure target cells, enabling analysis and potential diagnosis within 1 minute post-
separation. The cD4 diagnostic chip is a simple, precise, and rapid platform requiring minimal blood volume,
compliant with WHO guidelines for HIV diagnosis.
1 INTRODUCTION
Detection of CD4 expression from whole blood is
critical technology for the clinical diagnosis of human
immunodeficiency virus (HIV). Curren diagnostic
methods that comply with World Health Organization
(WHO) guidelines, such as the ‘VISITECT CD4’
assay, typically involve lysing whole blood and
measuring the total CD4 protein expression (Lechiile
et al., 2022). However, these approaches have
significant limitations.
CD4 protein expression levels on CD4
+
T cells
exhibit significant interindividual variability. As a
result, individuals with lower CD4 expression can be
misdiagnosed, despite having CD4
+
T cell counts
within the normal range. Furthermore, CD4
expression is not restricted to T lymphocytes;
monocytes also express CD4, potentially
confounding diagnostic accuracy. Additionally, when
whole blood is processed without lysis and traditional
microfluidic methods are used to isolate target T cells,
sample purity issues may arise, further affecting
diagnostic reliability. Positive selection methods for
CD4
+
T cell isolation inadvertently include CD4-
expressing monocytes, as previously described,
whereas negative selection methods, while yielding
higher purity, may co-isolate excess granulocytes,
given their higher relative abundance in whole blood.
To address these limitations, it is crucial to rely on
quantitative CD4
+
T cell counts, rather than CD4
expression levels, for unbiased assessments.
Quantitative measurements for HIV diagnosis require
a CD4
+
T cell concentration under 200 cells/µL and a
CD4/CD8 T cell ratio below 1. However, existing
studies on quantitative CD4+ T cell assessment do not
consistently comply with WHO guidelines (Yeh et al.,
2017).
To meet WHO standards, diagnostic platforms
must achieve detection at concentrations as low as
200 cells/µL using a minimum whole blood sample
volume of 100 µL and involve a preparation-to-assay
time under 5 minutes.
Here, we developed a CD4 diagnostic chip for a
rapid, precise, and simplified HIV diagnostic platform
suitable for point-of-care testing (POCT). Requiring
only 5 µL of whole blood, the CD4 diagnostic chip
detects concentrations as low as 100 cells/µL. Using
a smartphone microscope integrated with a LEGO-
based setup, real-time video capture and Python-
based software enable quantitative cell counting at the
target cell outlet. The distinct pixel intensity
differences between granulocytes and lymphocytes
Shin, H. S. and Choi, S.
Development of WHO Guideline-Complying CD4 Diagnostic Chip.
DOI: 10.5220/0013254700003911
Paper published under CC license (CC BY-NC-ND 4.0)
In Proceedings of the 18th International Joint Conference on Biomedical Engineering Systems and Technologies (BIOSTEC 2025) - Volume 1, pages 175-179
ISBN: 978-989-758-731-3; ISSN: 2184-4305
Proceedings Copyright © 2025 by SCITEPRESS – Science and Technology Publications, Lda.
175

facilitate visual and software-based cell type
differentiation. Our three-step separation process
yields high-purity CD4
+
and CD8 T
+
cells with
quantitative counts in under 25 minutes, meeting high
precision and purity requirements with Python-based
data analysis.
2 METHODS
2.1 Design and Development of the
Lego-Integrated Smartphone
Microscope
Lego bricks were utilized as a structural framework to
stabilize the various components of the setup. A
smartphone (iPhone SE) was mounted in an inverted
position and aligned with the 10X eyepiece lens. A
mirror was used to connect the 20X objective lens to
the eyepiece lens. An LED light source was
positioned at the top of the Lego structure. The CD4
diagnostic chips were securely placed on a
mechanical stage integrated into the framework.
2.2 Fabrication of the CD4 Diagnostic
Chip
The CD4 diagnostic chip was designed following
previously reported methods (Shin et al., 2023). The
chip was fabricated using standard SU-8
photolithography and polydimethylsiloxane (PDMS)
molding techniques. To assemble the chip, it was
positioned on top of a cover glass and affixed. The
assembled chips were then stored in an oven at 65°C
for future use.
2.3 CD4 Diagnostic Chip Procedure
The entire chip was degassed for 20 minutes in a
vacuum chamber, with the outlet reservoirs covered
by cover glass. For long-term storage and portable use,
the chip could be packaged in an aluminum vacuum
seal (yeh et al., 2017). Whole blood was collected in
10 mL BD EDTA Vacutainer tubes, then diluted 1:10
in 0.1% BSA. The blood was mixed with either a
human CD4
+
T cell isolation kit or a human CD8
+
T
cell isolation kit and incubated for 15 minutes at 4°C.
Upon removal of the chip from the chamber, 40 μL of
the blood mixture and 100 μL of 0.1% BSA buffer
were pipetted into the respective blood and buffer
inlets. To assess the purity, precision, and recovery of
the target cells, CD45 (FITC) and either CD4 (APC)
or CD8 (APC) antibodies were added to 100 μL of
0.1% BSA before being loaded onto the chip. After 30
minutes, the target cell outlet was imaged using a
fluorescence microscope (Ti2, Nikon) equipped with
a motorized stage and a scientific CMOS camera
(Andor Inc.).
2.4 Characterization of the Cell
Separation Process
Whole blood samples were serially diluted from 1X
to 1/16X concentrations, and cell separations were
performed using CD4 diagnostic chips. All processes
were recorded in slow-motion mode using a
smartphone, with video frames focused on the region
immediately preceding the target outlet. Post-capture,
cell identification and quantification were conducted
using Python-based code.
3 RESULTS
3.1 Characterization of Target Cell
Separation in the CD4 Diagnostic
Chip
To minimize cost and simplify construction, we
designed an optical setup using a smartphone,
integrated with a modular LEGO-based framework
(Fig. 1A). The CD4 diagnostic chip is positioned on
the objective lens and fixed with a mechanical stage,
enabling cell imaging via smartphone as they flow
through the device. Target cells are isolated by
loading 40µL of whole blood sample and 100µL of
0.1% BSA buffer into the blood and buffer inlets,
respectively.
We further enabled detection of the marker of the
target cells separated from the CD4 diagnostic chip by
imaging the chip’s outlet. This was achieved by adding
a fluorescent antibody to the 0.1% BSA buffer prior to
loading it onto the chip (Fig. 1B). Non-target cells in
the blood sample are magnetically labeled with a
negative selection kit reagent. Upon loading the blood
sample, target cells and non-labeled red blood cells
(RBCs) pass through the microfluidic lattice, while
labeled non-target cells are trapped in the blood inlet,
which contains ferromagnetic particles and a magnet
positioned beneath the blood inlet. The RBCs are
directed to a waste outlet, while target cells are washed
with buffer and sorted into the target outlet (Fig. 1C).
Measurement of CD4
+
and CD8
+
T cell separation
throughput over time revealed a consistent decline after
sample loading. This is because of the gradual
reduction in negative pressure over time during the
BIODEVICES 2025 - 18th International Conference on Biomedical Electronics and Devices
176
PDMS degassing process (Fig. 1D).
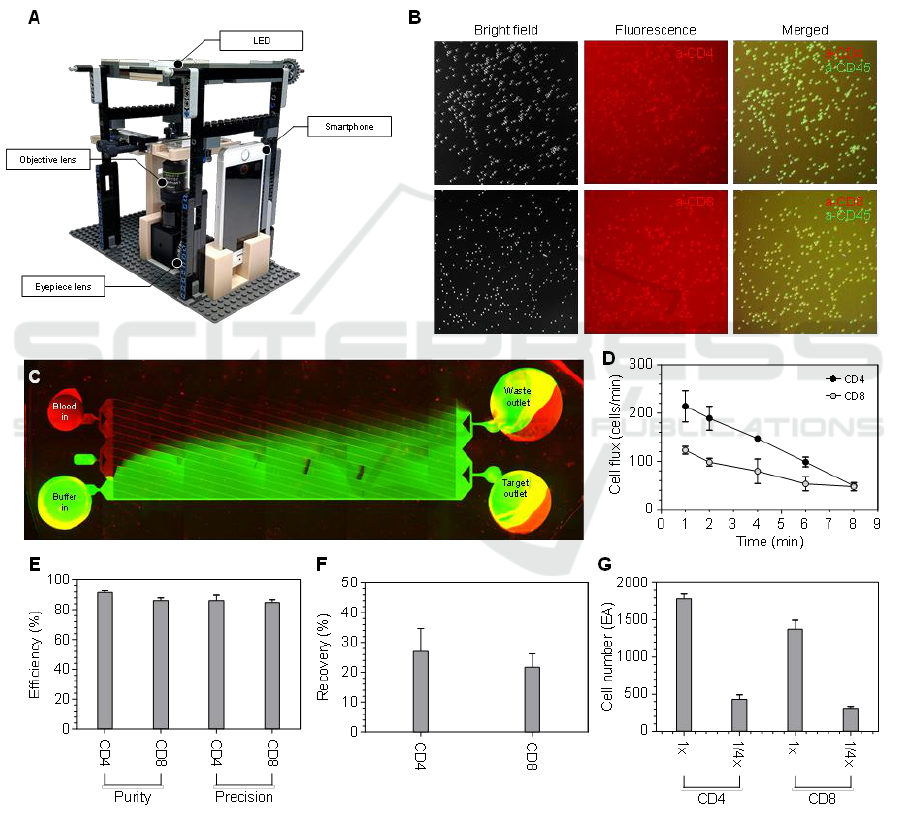
We then evaluated the effectiveness of target cell
separation from whole blood by assessing the purity
and precision of the sorted cells. Purity was calculated
as the ratio of target cells to the total cell count in the
target cell outlet, while precision was calculated as the
ratio of target cells in the target cell outlet to the total
number of target cells across both outlets. As a result,
we achieved successful separation using CD4
diagnostic chips, obtaining an average purity of
91.7% and precision of 86.2% for CD4
+
cells, and a
purity of 86.2% and precision of 84.8% for CD8
+
cells,
all within 30 minutes (Fig. 1E). Additionally, we
assessed the recovery rates of target cells, which were
27.0% for CD4
+
T cells and 21.7% for CD8
+
T cells
(Fig. 1F). Recovery was calculated as the ratio of
target cells collected in the target cell outlet to the
total number of target cells loaded at the inlet.
Because of the vacuum pump driven system, the
separation throughput gradually decreased over time.
However, throughput could be enhanced by simply
reducing the volume of the blood sample.
Figure 1: Separation of CD4
+
and CD8
+
T cell using the CD4 diagnostic chip. (A) Image of the smartphone microscope setup
with Lego-integrated components. (B) Fluorescence images of sorted CD4
+
and CD8
+
T cell. (C) Fluorescence image
depicting microfluidic washing process. (D) Throughput of CD4
+
and CD8
+
T cell separation flux over time. (E) Purity and
precision of sorted CD4
+
and CD8
+
T cell. (F) Recovery rates of sorted CD4
+
and CD8
+
T cell. (H) Repeatability analysis of
the CD4 diagnostic chip for separating CD4
+
and CD8
+
T cell.
Development of WHO Guideline-Complying CD4 Diagnostic Chip
177
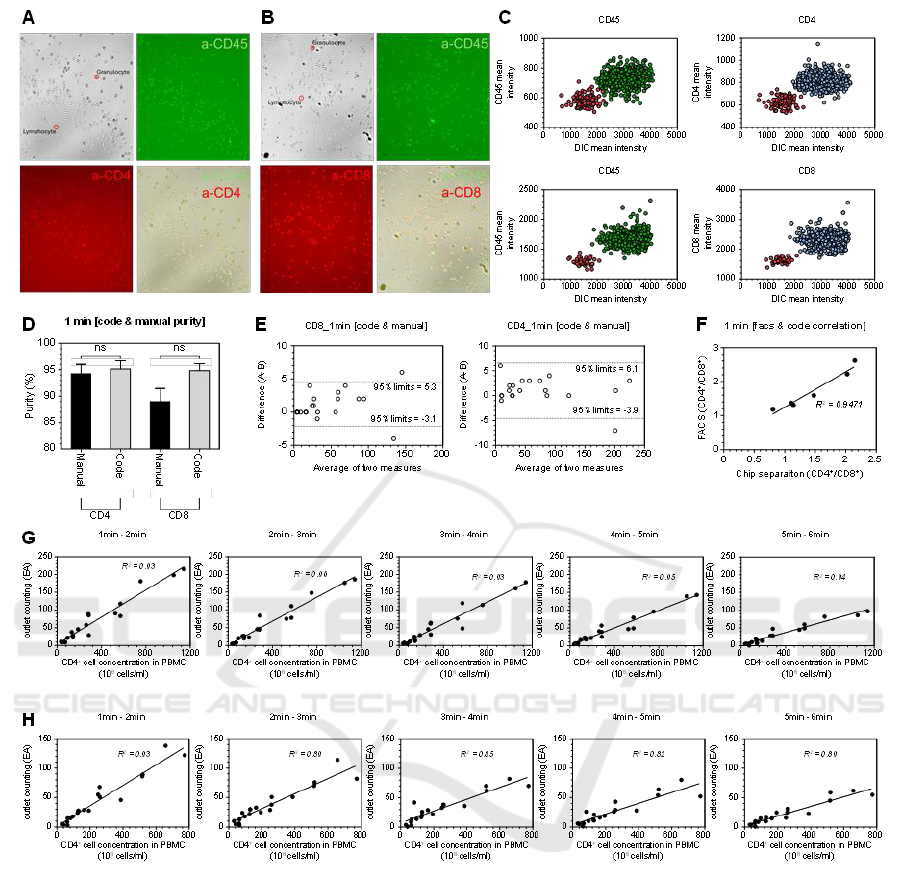
Figure 2: Quantification of CD4
+
and CD8
+
T cell following separation via the CD4 diagnostic chip. (A) Fluorescence imaging
of sorted CD4
+
T cell and (B) CD8 T
+
cell, showing residual granulocytes. (C) Plot of pixel intensity differences distinguishing
cell types. (D) Comparison of CD4
+
and CD8
+
T cell purity assessed via Python-based automated counting versus manual
counting over a 1-minute video segment. (E) Evaluation of Python code and manual counting methods. (F)Ratio comparison
of CD4
+
and CD8
+
T cell between Python-based automated code counting and FACS analysis. (G) Quantitative counts of
CD4
+
T cells and (H) CD8
+
T cells obtained from serially diluted whole blood samples, as analyzed by Python code.
We also investigated the repeatability of the CD4
diagnostic chips to assess potential performance
variability. Utilizing whole blood samples from the
same donor, we processed undiluted (1X) and 1/4X
diluted whole blood supplemented with 0.1% BSA
and quantified the CD4
+
and CD8
+
cell counts at the
garget cell outlet (Fig. 1G). The results demonstrated
no significant differences in chip performance across
measurements, indicating high repeatability.
3.2 Detection of Target Cell with
Python-Based Code in the CD4
Diagnostic Chip
To detect CD4
+
T cells at concentrations below 100
cells/µL, it is essential to achieve precise separation,
eliminating non-target cells entirely. However, some
granulocytes persist in the target outlets alongside
CD4
+
and CD8
+
T cell (Fig. 2A and 2B).
BIODEVICES 2025 - 18th International Conference on Biomedical Electronics and Devices
178

Given that target cells are isolated using a negative
selection kit, donor variability influences cell
separation outcomes. Although the purity of CD4
+
and CD8
+
T cell approaches 90%, the remaining 10%
impurity arises from non-target cells that are not fully
eliminated. In donors with a high abundance of
granulocytes or reduced expression of granulocyte-
specific markers, these granulocytes are inadvertently
collected in the target cell fraction, thereby increasing
the impurity. Notably, brightfield imaging reveals a
significant difference between lymphocytes and
granulocytes. Granulocytes exhibit lower pixel
intensity due to granules, appearing as dark spots, in
contrast to the more transparent appearance of
lymphocytes (Fig. 2C).
The Python-based code, capable of distinguishing
lymphocytes from granulocytes based on pixel
intensity, was utilized to analyze 1-minute segmented
videos recorded via smartphone to assess the purity of
CD4
+
and CD8
+
T cell separation. A comparison
between manual counting and Python-based
automated counting methods revealed no significant
differences between the two approached (Fig. 2D). To
further evaluate the precision of cell counting, a
comparative analysis of manual and automated
methods was conducted, demonstrating that the
Python-based code provides accurate and reliable
counts, with no significant discrepancies observed
(Fig. 2E). Given the clinical importance of the CD4
+
/
CD8
+
T cell ratio for diagnosing HIV patients, we
compared the Python-based automated counting
method to conventional FACS analysis. The high
correlation (R
2
=0.95) between the two methods
indicates strong agreement and confirms the
reliability of the automated approach (Fig. 2F).
To assess the performance of the CD4 diagnostic
chip, whole blood was serially diluted from 1X to
1/16X. Videos were analyzed using the Python-based
code, with recordings segmented into 1-minute
intervals starting from the initiation of the separation
process. We observed a strong correlation between the
concentration of CD4
+
T cells in PBMCs and the
number of target cells counted using the automated
method, yielding and R
2
value of 0.93 (Fig. 2G).
Similarly, the concentration of CD8
+
T cells in
PBMCs showed a high correlation with the automated
cell count, also with an R
2
value of 0.93 (Fig. 2H).
4 DISCUSSION
We developed a CD4 diagnostic chip integrated with
a LEGO-based smartphone microscope platform,
offering a cost-effective, precise, and straightforward
solution for target T cell separation. The Python-based
code enables accurate counting of target cells at
concentrations below 100 cells/μL, using a minimal
blood volume of just 5 μL. The entire separation and
counting process is completed within 30minutes,
making it well-suited for point-of-care (POC)
applications.
REFERENCES
Lechiile, K., Leeme, T. B., Tenforde, M. W., Bapabi, M.,
Magwenzi, J., Maithamako, O., ... & Jarvis, J. N. (2022).
Laboratory evaluation of the VISITECT advanced
disease semiquantitative point-of-care CD4 test. JAIDS
Journal of Acquired Immune Deficiency
Syndromes, 91(5), 502-507.
Watkins, N. N., Hassan, U., Damhorst, G., Ni, H., Vaid, A.,
Rodriguez, W., & Bashir, R. (2013). Microfluidic CD4+
and CD8+ T lymphocyte counters for point-of-care HIV
diagnostics using whole blood. Science translational
medicine, 5(214), 214ra170-214ra170.
Shin, H. S., Park, J., Lee, S. Y., Yun, H. G., Kim, B., Kim,
J., ... & Choi, S. (2023). Integrative Magneto‐
Microfluidic Separation of Immune Cells Facilitates
Clinical Functional Assays. Small, 19(43), 2302809.
Development of WHO Guideline-Complying CD4 Diagnostic Chip
179
