Connection Is all You Need! Mining and Linking Disparate Data Sources
for Collaboration Network Analysis
Benjamin Vehmeyer
a
and Michaela Geierhos
b
Research Institute CODE, University of the Bundeswehr Munich, Neubiberg, Germany
Keywords:
Institutional Networks, Knowledge Discovery, Community Detection.
Abstract:
Business networks are a key driver of innovation and economic growth. However, a major challenge is how
to discover these network relationships in heterogeneous data sources. In this paper, we present an IT arti-
fact that unifies different data types, including patent, research funding, and publication information, into a
unified graph database. This allows a comprehensive analysis of cooperation patterns. Community detection
algorithms are used to identify research clusters, while centrality measures reveal key players. Visualizations
facilitate the interpretation of research results and provide a user-friendly way to display data about research
communities and institutional behavior. A prototype visualization of these results provides a proof of concept
for the practicality of the method. The proposed design provides a robust framework for understanding the
dynamics of collaborative networks.
1 INTRODUCTION
Collaboration networks between companies, research
institutions, and other entities are crucial drivers of
innovation, knowledge sharing, and economic growth
(Ozcan and Islam, 2017). While analyzing these
networks provides valuable insights into cooperation
patterns and helps identify key players (Long et al.,
2014), institutions face significant challenges in find-
ing research partners.
Essential information is scattered across heteroge-
neous data sources, such as patent databases, project
funding records, and publication repositories (Wang,
2017). Each source provides only a partial view of
the capabilities of potential partners, making it dif-
ficult to gain a comprehensive understanding of the
collaborative landscape (Angles et al., 2017). Impor-
tant relationships between institutions often go unde-
tected because they are only visible when multiple
data sources are analyzed together. Research insti-
tutions seeking to establish collaborations face chal-
lenges with these hidden networks (Schwartz et al.,
2012). Traditional methods for collecting and analyz-
ing collaboration data are labor-intensive and ineffi-
cient (Hogan et al., 2021). While current tools such
a
https://orcid.org/0009-0009-7974-8479
b
https://orcid.org/0000-0002-8180-5606
as Patsnap
1
and istari.ai
2
automate certain processes
by using patent or web data (Huang et al., 2022), a
comprehensive system for analyzing complete collab-
oration networks based on disparate data sources has
yet to be developed.
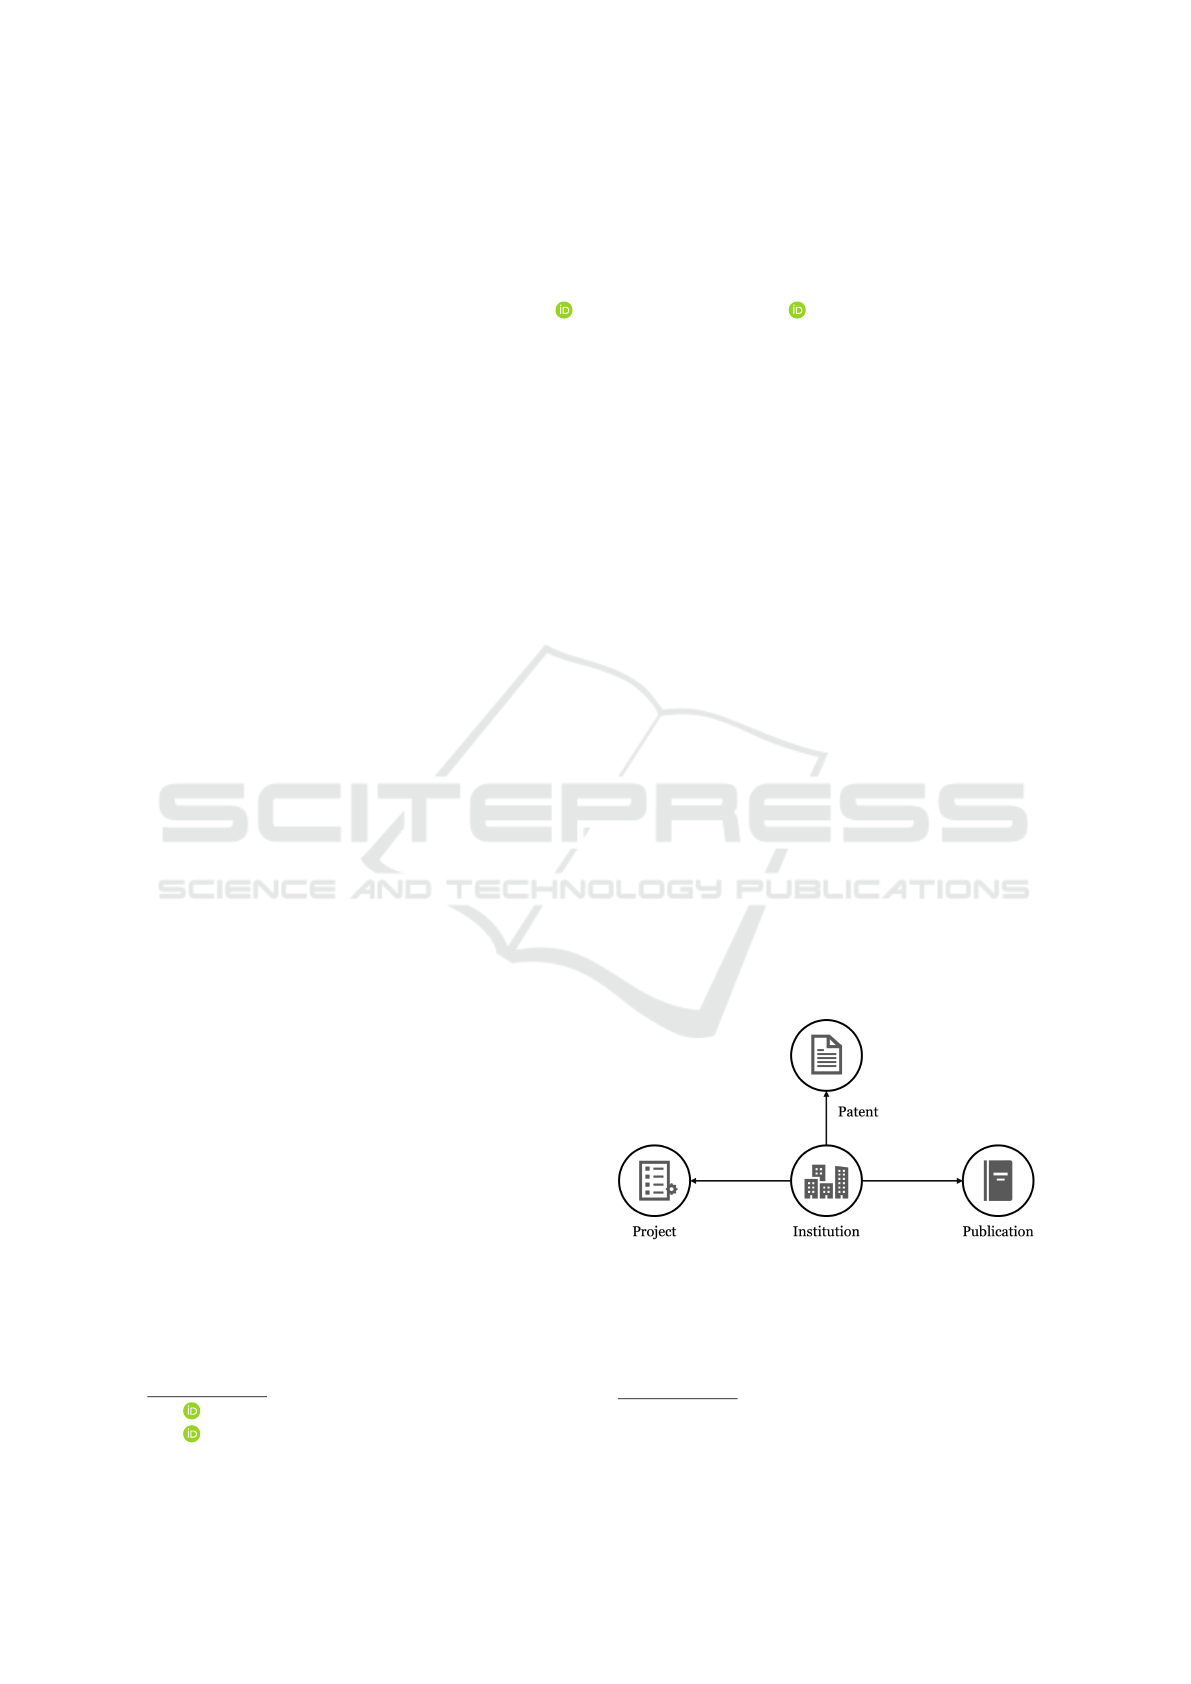
Therefore, we propose a system design for analyz-
ing complete collaboration networks by linking three
main data sources (i.e., patents, projects, and publica-
tions) characterizing an R&D-oriented entity to rep-
resent collaborations at the institutional level.
Figure 1: Representation of an institution by its individual
patent, project, and publication portfolio.
The information needed to describe the institu-
tions, as shown in Figure 1, is derived from three pri-
mary sources:
1
https://www.patsnap.com/ (Last accessed 2024-10-29)
2
https://www.istari.ai/ (Last accessed 2024-10-29)
210
Vehmeyer, B. and Geierhos, M.
Connection Is all You Need! Mining and Linking Disparate Data Sources for Collaboration Network Analysis.
DOI: 10.5220/0013255200003929
In Proceedings of the 27th International Conference on Enterprise Information Systems (ICEIS 2025) - Volume 1, pages 210-217
ISBN: 978-989-758-749-8; ISSN: 2184-4992
Copyright © 2025 by Paper published under CC license (CC BY-NC-ND 4.0)

PATSTAT for Patents. The European Patent Of-
fice’s global patent database containing biblio-
graphic data on patent applications and grants. It
allows the identification of technological collabo-
rations through joint patent applications and cita-
tions (European Patent Office, 2024).
F
¨
orderkatalog for Projects. The German govern-
ment’s database for publicly funded research,
providing insight into institutional partnerships
through joint projects and research initiatives
(Bundesministerium f
¨
ur Bildung und Forschung,
2024).
Scopus for Publications. Elsevier’s bibliometric
database indexing scholarly publications, au-
thors, and institutional affiliations, revealing
academic partnerships through co-authorship and
cross-institutional publications (Elsevier, 2024).
Through this work, we provide a practical proof
of concept (PoC) for a system design to identify re-
search collaborations. Our initial focus is on identi-
fying potential partnerships with German institutions.
For this reason, we have included the funding cata-
log (F
¨
orderkatalog) and conducted a corresponding
showcase, but the system is open to integrate any
other resource covering project portfolios.
The remaining sections are organized as follows:
Section 2 reviews related work, Section 3 presents our
methodology and system design, Section 4 demon-
strates practical value through a showcase, and Sec-
tion 5 closes with achievements and future potential.
2 RELATED WORK
In this section, we review related work on collabora-
tion network architecture, community detection, and
data linkage strategies.
2.1 Collaboration Network Architecture
Collaboration networks have long been a subject of
interest in various fields, including scientific research,
business, and social sciences. These networks rep-
resent the interconnected relationships between en-
tities, such as companies, research institutions, or
individuals, and can provide valuable insights into
the flow of knowledge, resources, and innovation
(Long et al., 2014). Choosing the right data archi-
tecture is crucial for effectively representing and ana-
lyzing these complex collaboration networks. Tradi-
tional databases are often constrained by predefined
schemas, making it difficult to flexibly integrate het-
erogeneous data sources (Ahuja et al., 2012). Ex-
isting approaches to collaboration network analysis
often rely on traditional databases. However, these
systems struggle with the complexity and intercon-
nectedness of data from multiple sources. In con-
trast, graph databases model data as nodes (entities)
and relationships (edges), which are well suited to
capturing the intricate connections within collabora-
tion networks (Angles et al., 2017). By using graph
databases, researchers can integrate and represent col-
laboration data from multiple sources within a uni-
fied graph structure, enabling the exploration of cross-
domain relationships and patterns. Recent studies
have explored the use of patent data to analyze co-
inventor collaboration networks (Huang et al., 2022),
highlighting the potential of integrating different data
sources for a more comprehensive analysis. Despite
the advantages of graph databases for representing
and analyzing highly connected data, there has been
limited research on using this technology to integrate
and analyze heterogeneous collaboration data from
multiple sources. Most existing studies focus on spe-
cific domains or data sources and fail to provide a
comprehensive and scalable solution for integrating
and exploring collaboration networks across multiple
data sources.
2.2 Community Detection in Networks
In the context of collaboration network analysis, the
identification of communities, or densely connected
groups of nodes, is a key aspect. These communities
may represent research clusters, industry sectors, or
other meaningful groupings that provide researchers
with valuable insights into the structure and dynamics
of collaboration networks (Javed et al., 2018). Com-
munity detection algorithms are widely used in net-
work analysis to discover such communities. For this
reason, it is necessary that the structure of the input
data is compatible with the algorithms used for the
data analysis. Therefore, graphs are the optimal rep-
resentation for this task. Commonly used algorithms
include modularity-based methods, label propaga-
tion, and graph partitioning approaches. Modularity-
based algorithms, such as the Louvain method or the
Girvan-Newman algorithm, aim to maximize a mea-
sure called modularity, which quantifies the density
of edges within communities relative to the density
between communities (Kumar and Hanot, 2021; Que
et al., 2015). These algorithms iteratively optimize
the modularity score by merging or splitting commu-
nities until an optimal partition is achieved. Label
propagation algorithms, such as the one proposed by
Raghavan et al. (2007), assign unique labels to nodes
and iteratively update these labels based on the labels
Connection Is all You Need! Mining and Linking Disparate Data Sources for Collaboration Network Analysis
211

of neighboring nodes. Over time, densely connected
groups of nodes converge on the same label, form-
ing communities. Graph partitioning algorithms di-
vide the network into disjoint partitions or commu-
nities based on various criteria, such as minimizing
edge cuts or maximizing intra-community connectiv-
ity (Kumar and Hanot, 2021). While these commu-
nity detection algorithms have been widely applied
in various domains, their effectiveness in the context
of heterogeneous collaboration network analysis re-
mains unexplored.
2.3 Data Linking and Enrichment
Data linking identifies connections between related
entities across different data sources, while data en-
richment combines complementary data from mul-
tiple sources to enhance information about entities
(Benjelloun et al., 2009). This is essential for col-
laboration network analysis because relevant data is
fragmented across sources such as patent databases,
project records, and publication data – each of which
provides only partial entity and relationship informa-
tion. A more comprehensive view of the collaboration
landscape is obtained by linking and enriching data
from disparate sources. Several linkage approaches
have been proposed for data enrichment, including:
Record Linkage and Entity Resolution. These tech-
niques identify and match records that refer to the
same real-world entity across different data sources
(Benjelloun et al., 2009). This involves comparing
attribute values, such as names, addresses, and iden-
tifiers, and using similarity measures and machine
learning models to determine potential matches.
Ontology Matching and Semantic Integration.
These methods align and integrate data from dis-
parate sources using semantic technologies (Shvaiko
and Euzenat, 2013). By mapping concepts and rela-
tionships across ontologies, entities and their proper-
ties are linked and enriched with additional informa-
tion.
Knowledge Graph Construction. Knowledge
graphs provide a structured representation of entities,
their attributes, and relationships (Hogan et al., 2021;
Noy et al., 2019). Techniques like knowledge graph
embedding and link prediction can be used to discover
new connections and enrich the graph with additional
information. While these approaches have been ex-
plored in various domains, their application to het-
erogeneous collaboration network analysis remains
largely unexplored. Challenges include the diversity
of data sources, the complexity of collaboration re-
lationships, and the need for efficient, scalable solu-
tions. There are opportunities to integrate domain-
specific knowledge and heuristics, such as common
collaboration patterns, organizational structures, and
research areas, to improve the accuracy and relevance
of linking and enrichment for this domain.
3 RESEARCH DESIGN
This section describes the research methodology and
the design of an IT artifact for a system that integrates
and analyzes data from patents, research funding, and
scientific publications.
3.1 Research Methodology
The research methodology follows the principles of
design science research according to Hevner et al.
(2004) and delivers a collaboration network analy-
sis and visualization tool as an IT artifact. Further-
more, we provide a methodological contribution to
improve the exploration and analysis of research net-
works in Germany. The IT artifact addresses the prob-
lem of fragmented and heterogeneous data sources
that complicate comprehensive collaboration analy-
sis. We plan to evaluate our tool on its ability to unify
disparate data sources and reveal complex network
structures. The development is currently a work-
in-progress, with evaluation planned as future work.
Since design science requires methodical approaches
to both design and evaluation, we see our contribu-
tion as a response to the existing state of research,
proceeding iteratively until we find an appropriate so-
lution. The primary output is a proof-of-concept im-
plementation that demonstrates the feasibility of our
proposed solution, serving as a validation of our de-
sign approach while providing practical insights into
collaboration network analysis.
3.2 IT Artifact
The design of our IT artifact addresses the challenge
of identifying and analyzing research collaboration
networks by providing a comprehensive tool that in-
tegrates data from multiple sources. The core con-
cept follows a straightforward approach: Users enter
the name of an institution, and the system reveals not
only its research activities, but also its position within
various collaboration networks. In this way, we trans-
form fragmented data on patents, publicly funded
projects, and scientific publications into actionable in-
sights about research communities and potential col-
laboration opportunities. Conceptually, the IT artifact
serves three main purposes. First, it provides a unified
ICEIS 2025 - 27th International Conference on Enterprise Information Systems
212
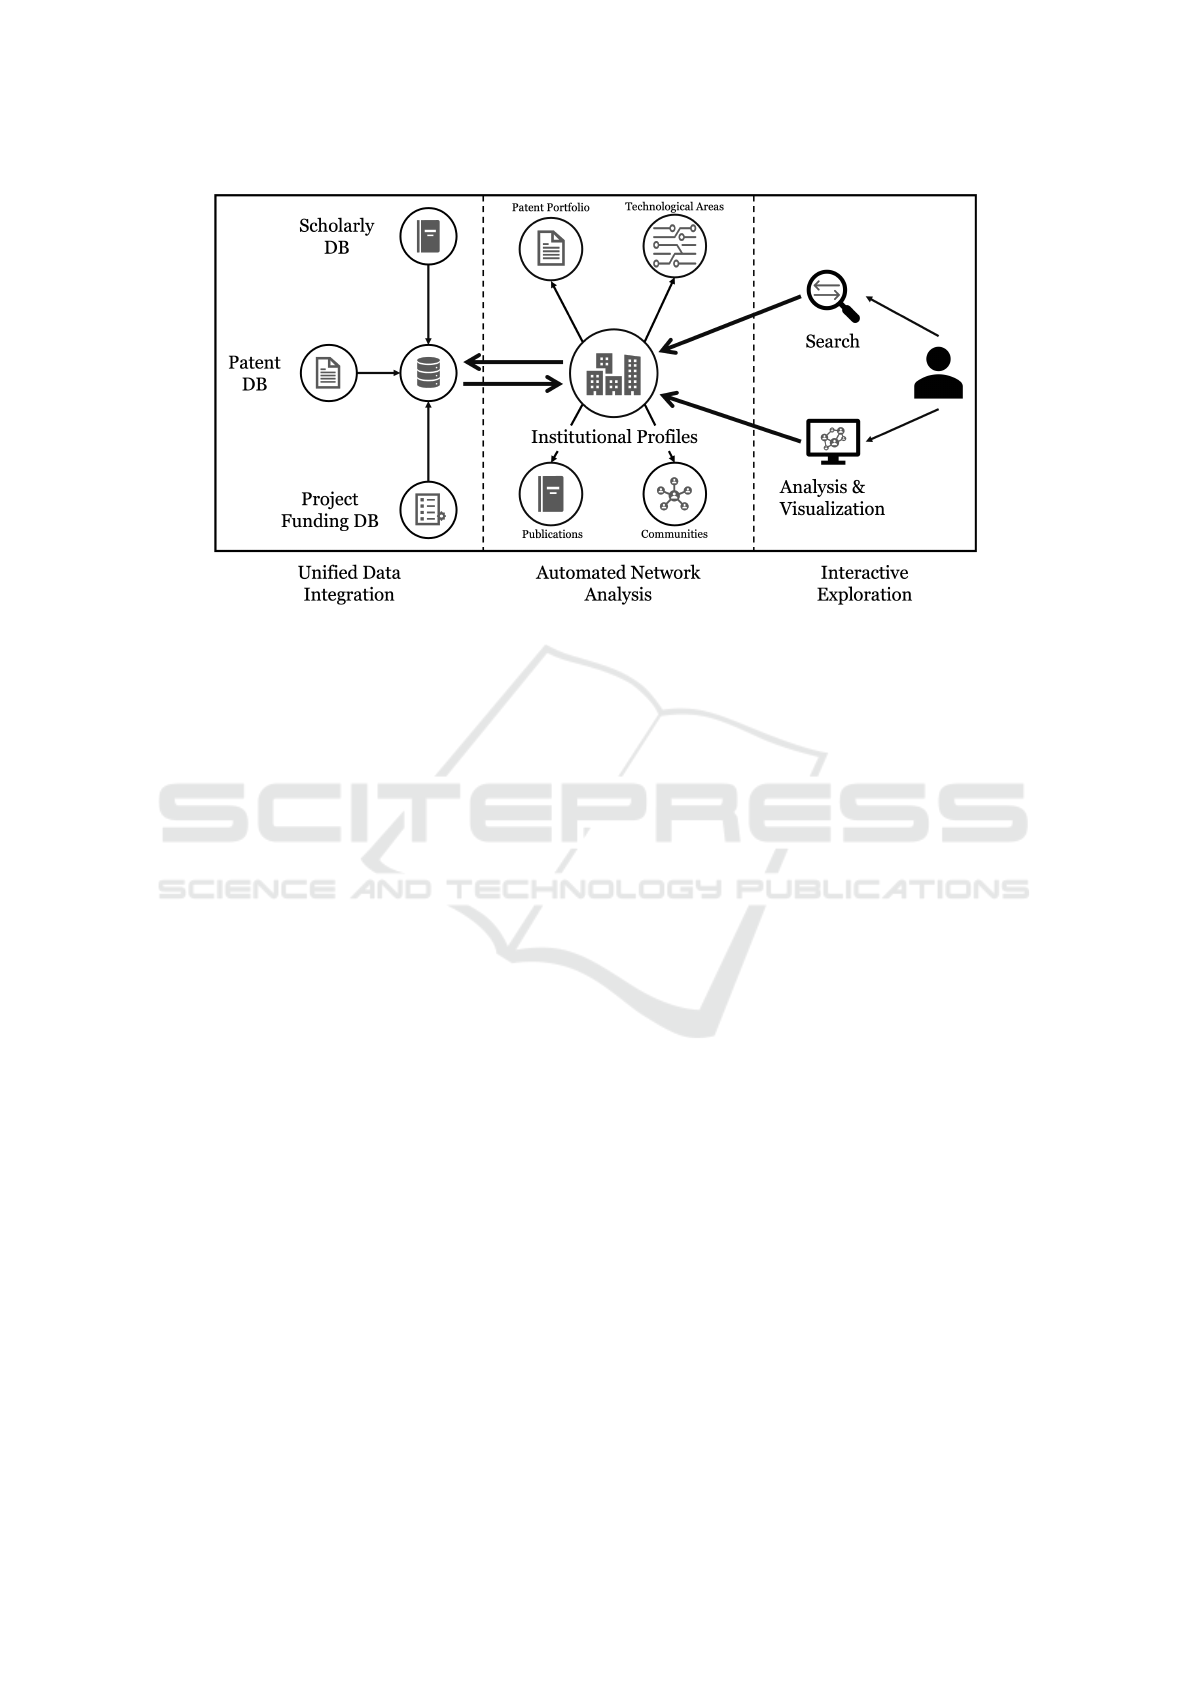
Figure 2: System architecture showing the main components and data flow.
view of an institution’s research activities by com-
bining data from patents, scientific publications, and
publicly funded projects. Second, it reveals collab-
oration networks by analyzing connections between
institutions across these different data sources, iden-
tifying research communities and industry clusters.
Third, it enables interactive exploration of these net-
works, allowing users to discover potential research
partners based on shared interests, technological ex-
pertise, and existing cooperation patterns. The sys-
tem architecture consists of three main components,
as shown in Figure 2: The unified data integra-
tion component forms the foundation by integrating
heterogeneous data sources from scholarly databases
(e.g., Scopus), patent databases (e.g., PATSTAT), and
project funding databases (e.g., F
¨
orderkatalog) into
a unified structure, ensuring consistent entity reso-
lution and data quality. The automated network
analysis component serves as the central processing
unit, generating comprehensive institutional profiles
and performing multiple analyses. It processes patent
portfolios, maps technology areas, creates publica-
tion summaries, and identifies research communities
through network analysis. The interactive explo-
ration component provides the user interface for in-
stitution queries, analysis and visualization tools for
exploring network structures, and interactive displays
of profiles and connections. After selecting an institu-
tion, the user is presented with a comprehensive pro-
file page (see Figure 4) that presents three key aspects:
1. Institutional Context. This section provides ba-
sic metadata about the institution, including loca-
tion and contact information, primary technology
areas, and key research areas.
2. Research Output. A structured outline presents
the institution’s patents (which indicate techno-
logical innovation capability), scientific publica-
tions (which show academic research strength),
and federally funded projects (which indicate re-
search priorities and funding success).
3. Collaboration Networks. Through visual and
interactive representations, users can explore di-
rect collaborators across all data sources, research
communities to which the institution belongs,
and potential collaboration opportunities based on
shared interests and indirect connections.
Through this integrated approach, our IT artifact
transforms the traditionally complex task of analyz-
ing multiple databases into a streamlined process for
identifying and evaluating potential research collabo-
rations. The technical implementation details of these
components are described in the following sections.
3.2.1 Data Preparation
The proposed design integrates data from three main
sources: PATSTAT (bibliographic and legal patent
data from the European Patent Office), F
¨
orderkatalog
(over 140,000 records of federal project funding), and
Scopus (comprehensive scientific literature database).
As part of this integration, data preparation tech-
niques enhance the quality of the combined datasets.
These include data linking (Benjelloun et al., 2009) to
link related entities across sources, and data enrich-
ment (Shvaiko and Euzenat, 2013) to combine com-
plementary information. We applied entity resolu-
tion techniques (Getoor and Machanavajjhala, 2012)
to reconcile representations of researchers, patents,
Connection Is all You Need! Mining and Linking Disparate Data Sources for Collaboration Network Analysis
213
projects, and publications, along with data cleaning
methods (Rahm and Do, 2000) to handle missing val-
ues and inconsistencies (C
ˆ
ot
´
e et al., 2023). Initial as-
sessments indicate significant improvements in data
consistency and reliability, with detailed validation
processes planned for the next phase.
3.2.2 Graph Database Modeling
Neo4j
3
serves as our primary graph database, chosen
for its robust capabilities and Cypher query language
(Francis et al., 2018), which enables efficient explo-
ration of complex relationship patterns (Angles et al.,
2017). The model implements nodes representing
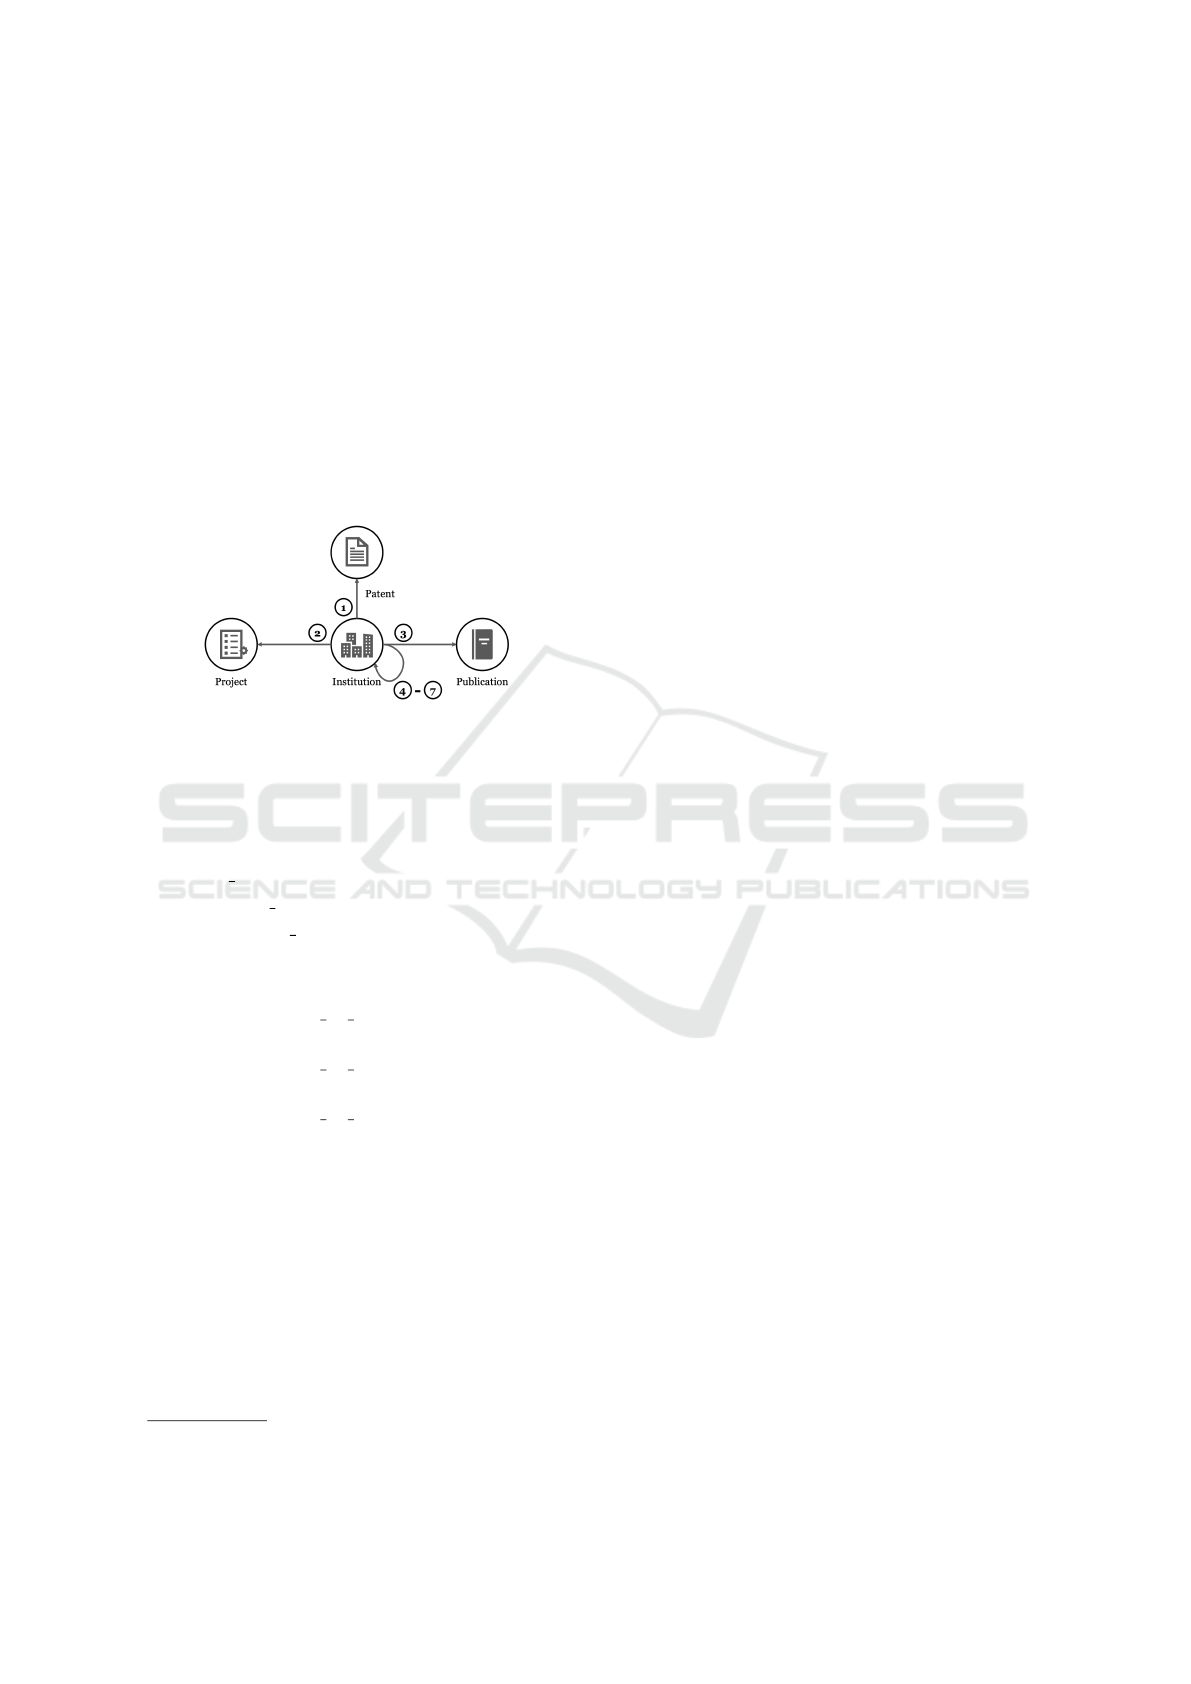
Figure 3: Graph model representation of an institution.
institutions, patents, projects, and publications, with
edges representing relationships. Figure 3 shows the
core components with seven relationship types:
(a) Direct Entity Relationships
(1) HAS PATENT relates institutions to their patents
(2) PARTNER IN links institutions to their projects
(3) PUBLISHED BY connects institutions to publica-
tions
(b) Collaborative Relationships
(4) COLLABORATES ON PATENT for joint patent ac-
tivities
(5) COLLABORATES ON PROJECT for project collab-
orations
(6) COLLABORATES ON PUBLICATION for co-
authorship
(7) COLLABORATES for general institutional collab-
oration
This structure enables complex analysis such as com-
munity detection, centrality calculations, and pattern
discovery in collaboration networks.
3.2.3 Community Detection
The system uses community detection algorithms to
identify densely connected groups of nodes within
the graph database that represent research commu-
3
https://www.neo4j.com/ (Last accessed 2024-11-08)
nities, industry clusters, or other meaningful group-
ings. To identify communities within the collabora-
tion network, we implemented the Louvain algorithm
(Kumar and Hanot, 2021), which was chosen for its
fast processing capabilities and high quality results
on large datasets. This method efficiently identifies
densely connected groups while allowing examina-
tion of community structures at different levels, criti-
cal for detailed analysis of cooperation patterns (Sat-
tar and Arifuzzaman, 2022). Once communities are
identified, network analysis techniques explore coop-
eration patterns and identify key players. The IT ar-
tifact uses betweenness centrality to identify influen-
tial entities and potential knowledge brokers (Valente
et al., 2008). This measure identifies nodes that fre-
quently appear on the shortest paths between other
nodes, highlighting their role as information brokers.
It was chosen for its reliability and scalability, requir-
ing no predefined parameters, and its ability to iden-
tify key entities that connect disparate groups (Kumar
and Hanot, 2021).
In addition, the integration of heterogeneous data
sources enables the exploration of cross-domain re-
lationships between patent activity, research collab-
orations, and scientific publications, potentially pro-
viding insights into research-to-application transla-
tion and academic-industry collaborations.
4 SHOWCASE
To validate the practical application of our PoC, this
showcase examines the identification of potential re-
search partnerships in the aircraft manufacturing sec-
tor. The scenario demonstrates how our IT artifact
can be used to discover collaboration opportunities
through network analysis, using a specific example in
materials research and manufacturing processes.
The showcase uses a systematic approach to part-
ner identification with the following steps:
1. Initial partner analysis using the system’s search
functionality
2. Investigation of existing collaboration networks
3. Detailed analysis of potential partner profiles
4. Evaluation of collaboration potential based on his-
torical project data
4.1 Initial Search
The starting point for this scenario is MTU Aero En-
gines AG, a German aero engine manufacturer that
develops, manufactures, and services military and
commercial aircraft engines. When the institution is
ICEIS 2025 - 27th International Conference on Enterprise Information Systems
214
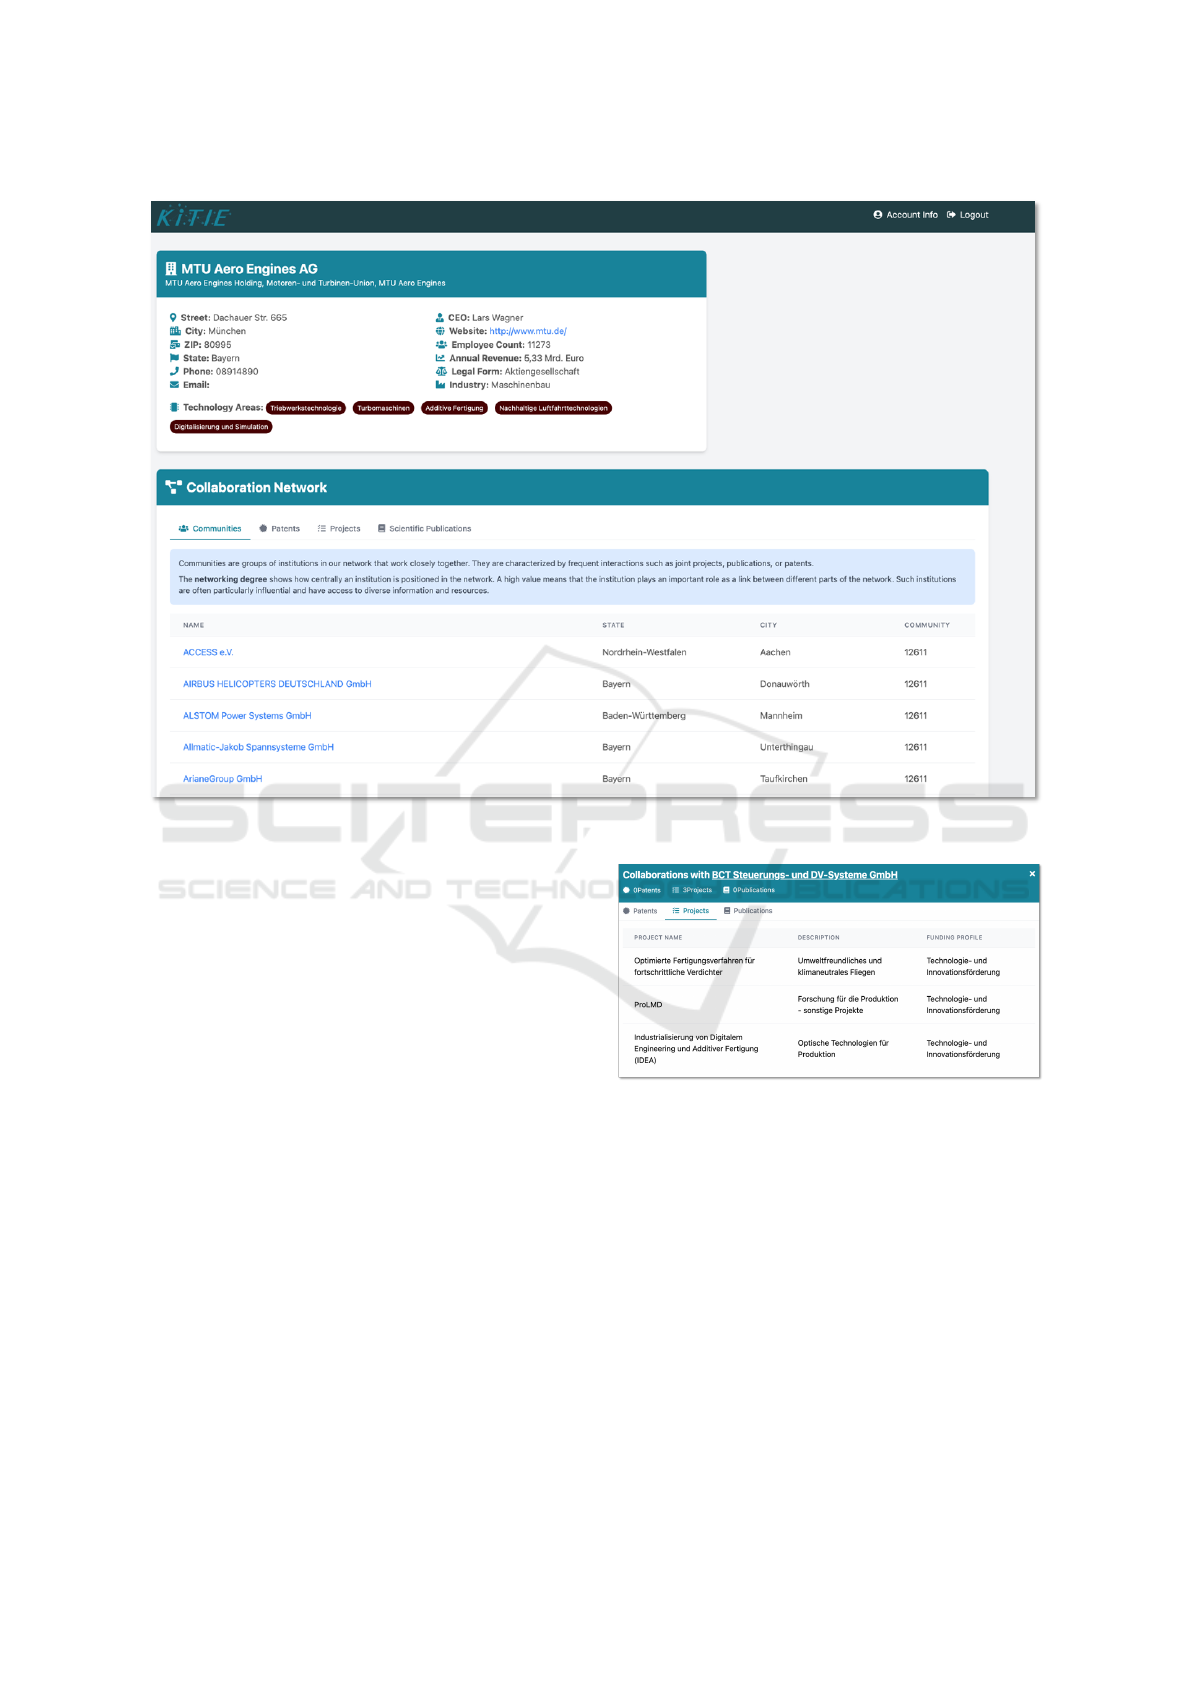
Figure 4: Institutional profile of MTU Aero Engines AG.
selected, the system displays a comprehensive institu-
tional profile in Figure 4.
At the top of the profile is a structured visual-
ization of the company’s institutional data. This in-
formation includes institutional data such as location,
annual revenue, industry classification, and core tech-
nology areas. Below the company profile, the inter-
face transitions to a collaboration network section.
4.2 Network Analysis
The Collaboration Network section in Figure 4 pro-
vides structured access to collaboration data through
specialized tabs for Communities, Patents, Projects
and Scientific Publications. The Communities tab
shows institutions that have significant collabora-
tive relationships with MTU Aero Engines. Sys-
tematic analysis of the network data identified sev-
eral institutions as potential collaboration partners.
Among these, BCT Steuerungs- und DV-Systeme
GmbH stood out due to its significant involvement in
research-oriented manufacturing projects with MTU
Aero Engines. As shown in the collaboration profile
in Figure 5, BCT and MTU Aero Engines have collab-
orated on three major research projects, all supported
Figure 5: Overview of joint research projects between BCT
Steuerungs- und DV-Systeme GmbH and MTU Aero En-
gines AG.
by Technology and Innovation funding. The projects
cover manufacturing-related topics: optimized man-
ufacturing processes for advanced compressors, pro-
duction research (ProLMD) and the industrializa-
tion of digital engineering and additive manufactur-
ing (IDEA). While the collaboration shows strong
project-based ties, there are no joint patents or sci-
entific publications, indicating a focus on applied re-
search and development. These collaborative activi-
ties demonstrate BCT’s extensive experience in man-
ufacturing processes and digital transformation in the
aerospace industry. The nature and scope of these
Connection Is all You Need! Mining and Linking Disparate Data Sources for Collaboration Network Analysis
215

projects suggest that BCT has relevant expertise for
potential research partnerships, especially given its
successful track record with MTU Aero Engines.
4.3 Discussion
The showcase demonstrates several key capabilities
of our developed IT artifact, while also highlighting
certain limitations and areas for future development.
The PoC successfully facilitated the identification of
potential research partners through its structured ap-
proach to data analysis and visualization. Of par-
ticular note is the ability to trace collaboration net-
works across different types of relationships – patents,
projects, and publications – providing a multifaceted
view of institutional capabilities and cooperation pat-
terns. The underlying graph database model is partic-
ularly advantageous here, as it allows efficient traver-
sal of relationship chains and the matching of patterns
that would be difficult to achieve with conventional
relational databases. The case of BCT Steuerungs-
und DV-Systeme GmbH illustrates how the system
can uncover non-obvious opportunities for collabora-
tion by analyzing existing network relationships that
only become visible when multiple data sources are
analyzed together. While the PoC is effective in iden-
tifying collaborations, there are several areas where
the current implementation could be improved. The
current version lacks mechanisms for qualitative eval-
uation of partnerships and temporal analysis capabil-
ities to track how relationships evolve over time. A
major limitation is the lack of automated complemen-
tarity analysis between institutions – future versions
should be able to identify synergies in research capa-
bilities and technological expertise between potential
partners. In addition, the current focus on German re-
search institutions limits the usefulness of the system
for international research partnerships.
5 CONCLUSION
Our approach provides researchers, policymakers,
and industry leaders with deeper insights into col-
laboration landscapes, potentially informing strate-
gic decisions about research partnerships and innova-
tion strategies. While previous approaches have typi-
cally focused on single data sources, our IT artifact
uniquely integrates patent, project, and publication
information into a comprehensive analytical frame-
work. This holistic approach distinguishes our work
from existing solutions that often provide only partial
views of the collaboration landscape. Some of the key
features of our IT artifact include
1. Unified Data Integration Framework. Our
approach integrates heterogeneous data from
patents, projects, and publications into a compre-
hensive knowledge base, with a flexible architec-
ture that allows seamless integration of additional
data sources.
2. Advanced Analysis Capabilities. The system
implements sophisticated network analysis tech-
niques, including
• Community detection using the Louvain
method to identify research clusters
• Betweenness centrality measures to reveal in-
fluential institutions
• Interactive visualizations to explore collabora-
tion networks
3. Graph-based Architecture. By modeling col-
laboration networks as graphs, our IT artifact en-
ables sophisticated network analysis capabilities
that would be difficult to achieve with traditional
relational databases.
While our PoC demonstrates the feasibility of this
approach, future work will focus on comprehensive
evaluation and enhancement. This will include quan-
titative evaluation of data integration accuracy, user
studies with research institutions, and integration of
additional data sources. We also aim to conduct com-
prehensive scalability analyses across different net-
work scales and domains, including comparative per-
formance evaluations with existing systems and in-
vestigation of integration challenges with real-world
IT infrastructures. We plan to develop more sophis-
ticated partnership recommendation algorithms and
temporal analysis capabilities to better understand the
evolution of research networks over time. This will
include a complementarity analysis component that
examines synergies between institutions to identify
partnerships with the greatest potential for mutual sci-
entific progress. As the complexity and importance of
research collaborations continues to grow in our inter-
connected world, tools for understanding and foster-
ing these partnerships become increasingly important.
Our work provides a foundation for transforming the
way institutions discover and evaluate potential re-
search partnerships, ultimately contributing to more
effective collaborative research ecosystems.
ACKNOWLEDGEMENTS
This work was funded by the German Federal Min-
istry of Education and Research under grant no.
01IO2208E.
ICEIS 2025 - 27th International Conference on Enterprise Information Systems
216

REFERENCES
Ahuja, G., Soda, G., and Zaheer, A. (2012). The genesis
and dynamics of organizational networks (march, pg
434, 2012). Organization Science, 23:1211–1211.
Angles, R., Arenas, M., Barcel
´
o, P., Hogan, A., Reutter, J.,
and Vrgo
ˇ
c, D. (2017). Foundations of modern query
languages for graph databases. ACM Computing Sur-
veys, 50(5):68:1–68:40.
Benjelloun, O., Garcia-Molina, H., Menestrina, D., Su, Q.,
Whang, S. E., and Widom, J. (2009). Swoosh: a
generic approach to entity resolution. The VLDB Jour-
nal, 18(1):255–276.
Bundesministerium f
¨
ur Bildung und Forschung (2024).
F
¨
orderkatalog - Database of Public Research Funding
in Germany. Federal database of publicly funded re-
search projects in Germany.
C
ˆ
ot
´
e, P.-O., Nikanjam, A., Ahmed, N., Humeniuk, D., and
Khomh, F. (2023). Data cleaning and machine learn-
ing: A systematic literature review. Publisher: [object
Object] Version Number: 1.
Elsevier (2024). Scopus. Abstract and citation database of
peer-reviewed literature.
European Patent Office (2024). PATSTAT - Worldwide
Patent Statistical Database. Global patent database
maintained by the European Patent Office.
Francis, N., Green, A., Guagliardo, P., Libkin, L., Lin-
daaker, T., Marsault, V., Plantikow, S., Rydberg, M.,
Selmer, P., and Taylor, A. (2018). Cypher: An evolv-
ing query language for property graphs. Proceedings
of the 2018 International Conference on Management
of Data.
Getoor, L. and Machanavajjhala, A. (2012). Entity resolu-
tion: Theory, practice & open challenges. Proceed-
ings of the VLDB Endowment, 5(12):2018–2019.
Hevner, A., R, A., March, S., T, S., Park, Park, J., Ram, and
Sudha (2004). Design science in information systems
research. Management Information Systems Quar-
terly, 28:75.
Hogan, A., Blomqvist, E., Cochez, M., D’amato, C., Melo,
G. D., Gutierrez, C., Kirrane, S., Gayo, J. E. L., Nav-
igli, R., Neumaier, S., Ngomo, A.-C. N., Polleres, A.,
Rashid, S. M., Rula, A., Schmelzeisen, L., Sequeda,
J., Staab, S., and Zimmermann, A. (2021). Knowledge
graphs. ACM Computing Surveys, 54(4):71:1–71:37.
Huang, Y., Li, R., Zou, F., Jiang, L., Porter, A. L., and
Zhang, L. (2022). Technology life cycle analysis:
From the dynamic perspective of patent citation net-
works. Technological Forecasting and Social Change,
181:121760.
Javed, M. A., Younis, M. S., Latif, S., Qadir, J., and Baig,
A. (2018). Community detection in networks: A mul-
tidisciplinary review. Journal of Network and Com-
puter Applications, 108:87–111.
Kumar, S. and Hanot, R. (2021). Community detection al-
gorithms in complex networks: A survey. In Thampi,
S. M., Krishnan, S., Hegde, R. M., Ciuonzo, D.,
Hanne, T., and Kannan R., J., editors, Advances in Sig-
nal Processing and Intelligent Recognition Systems,
pages 202–215. Springer.
Long, J. C., Cunningham, F. C., Carswell, P., and Braith-
waite, J. (2014). Patterns of collaboration in complex
networks: the example of a translational research net-
work. BMC Health Services Research, 14(1):225.
Noy, N., Gao, Y., Jain, A., Narayanan, A., Patterson, A., and
Taylor, J. (2019). Industry-scale knowledge graphs:
Lessons and challenges: Five diverse technology com-
panies show how it’s done. Queue, 17(2):Pages
20:48–Pages 20:75.
Ozcan, S. and Islam, N. (2017). Patent information re-
trieval: approaching a method and analysing nan-
otechnology patent collaborations. Scientometrics,
111(2):941–970.
Que, X., Checconi, F., Petrini, F., and Gunnels, J. A. (2015).
Scalable community detection with the louvain algo-
rithm. In 2015 IEEE International Parallel and Dis-
tributed Processing Symposium, pages 28–37. ISSN:
1530-2075.
Raghavan, U. N., Albert, R., and Kumara, S. (2007).
Near linear time algorithm to detect community struc-
tures in large-scale networks. Physical Review E,
76(3):036106.
Rahm, E. and Do, H. H. (2000). Data cleaning: Problems
and current approaches. IEEE Data Engineering Bul-
letin, 23(4):3–13.
Sattar, N. S. and Arifuzzaman, S. (2022). Scalable dis-
tributed louvain algorithm for community detection
in large graphs. The Journal of Supercomputing,
78(7):10275–10309.
Schwartz, M., Peglow, F., Fritsch, M., and G
¨
unther, J.
(2012). What drives innovation output from subsi-
dized r&d cooperation?—project-level evidence from
germany. Technovation, 32(6):358–369.
Shvaiko, P. and Euzenat, J. (2013). Ontology match-
ing: State of the art and future challenges. IEEE
Transactions on Knowledge and Data Engineering,
25(1):158–176. Conference Name: IEEE Transac-
tions on Knowledge and Data Engineering.
Valente, T. W., Coronges, K., Lakon, C., and Costenbader,
E. (2008). How correlated are network centrality mea-
sures? Connections (Toronto, Ont.), 28(1):16–26.
Wang, L. (2017). Heterogeneous data and big data ana-
lytics. Automatic Control and Information Sciences,
3(1):8–15. Number: 1 Publisher: Science and Educa-
tion Publishing.
Connection Is all You Need! Mining and Linking Disparate Data Sources for Collaboration Network Analysis
217
