
Co-Activation Graph Analysis of Safety-Verified and Explainable Deep
Reinforcement Learning Policies
Dennis Gross and Helge Spieker
Simula Research Laboratory, Norway
Keywords:
Explainable Reinforcement Learning, Model Checking, Co-Activation Graph Analysis.
Abstract:
Deep reinforcement learning (RL) policies can demonstrate unsafe behaviors and are challenging to interpret.
To address these challenges, we combine RL policy model checking—a technique for determining whether
RL policies exhibit unsafe behaviors—with co-activation graph analysis—a method that maps neural network
inner workings by analyzing neuron activation patterns—to gain insight into the safe RL policy’s sequential
decision-making. This combination lets us interpret the RL policy’s inner workings for safe decision-making.
We demonstrate its applicability in various experiments.
1 INTRODUCTION
Deep Reinforcement Learning (RL) has improved var-
ious industries (Liu et al., 2024; Ji et al., 2024;
Wang et al., 2024), enabling the creation of agents
that can outperform humans in sequential decision-
making tasks (Mnih et al., 2015).
In general, an RL agent aims to learn a near-
optimal policy to achieve a fixed objective by taking
actions and receiving feedback through rewards and
state observations from the environment (Sutton and
Barto, 2018). Each state is described in terms of fea-
tures, which can be considered characteristics of the
current environment state (Strehl et al., 2007). We call
a policy a memoryless policy if it only decides based
on the current state (Sutton and Barto, 2018).
A neural network (NN) commonly represents the
policy that, given the observation of the environment
state as input, yields values that indicate which ac-
tion to choose (Mnih et al., 2013). These values are
called Q-values (Watkins and Dayan, 1992), repre-
senting the expected cumulative reward an agent pol-
icy expects to obtain by taking a specific action in a
particular state.
Unfortunately, trained policies can exhibit unsafe
behavior (Gross et al., 2022) like collisions (Ban
and Li, 2024), as rewards often do not fully cap-
ture complex safety requirements (Vamplew et al.,
2022), and are hard to interpret because the complex-
ity of NNs hides crucial details affecting decision-
making (Bekkemoen, 2024).
To resolve the issues mentioned above, formal
verification methods like model checking (Baier and
Katoen, 2008) have been proposed to reason about the
safety of RL policies (Wang et al., 2020; Hasanbeig
et al., 2020; Br
´
azdil et al., 2014; Hahn et al., 2019)
and explainable RL methods to interpret trained RL
policies (Milani et al., 2024).
Model checking is not limited by the proper-
ties that rewards can express. Instead, it supports a
broader range of properties that can be expressed by
probabilistic computation tree logic (PCTL) (Hans-
son and Jonsson, 1994). PCTL formalizes reason-
ing about probabilistic systems, such as Markov de-
cision processes (MDPs). It enables the specification
of (safety) properties that relate to the probability of
events occurring over discrete time steps, as applica-
ble in our RL setting.
Explainable RL involves methods that make RL
policies interpretable, such as clarifying how the pol-
icy makes decisions (Sieusahai and Guzdial, 2021).
Local explanations clarify decision-making for spe-
cific states, while global explanations offer a holistic
view of the policy and its actions (Milani et al., 2024).
Some research combines safety with explainabil-
ity by creating simpler surrogate models of poli-
cies (Schilling et al., 2023), pruning neural network
interconnections and re-verifying the pruned network
to identify which connections influence safety prop-
erties (Gross and Spieker, 2024b). Other approaches
use external systems to explain failures and propose
alternative actions, enhancing the safety of trained RL
policies (Gross and Spieker, 2024a).
Unfortunately, there remains a gap between local
Gross, D. and Spieker, H.
Co-Activation Graph Analysis of Safety-Verified and Explainable Deep Reinforcement Learning Policies.
DOI: 10.5220/0013255500003890
In Proceedings of the 17th International Conference on Agents and Artificial Intelligence (ICAART 2025) - Volume 2, pages 611-621
ISBN: 978-989-758-737-5; ISSN: 2184-433X
Copyright © 2025 by Paper published under CC license (CC BY-NC-ND 4.0)
611

and global explanations, as, to the best of our knowl-
edge, no current methodology offers nuanced safety
explanations for RL policies within specific regions
of the environment.
Co-activation graph analysis (Horta et al., 2021;
Selani and Tiddi, 2021; Horta et al., 2023; Horta and
Mileo, 2021) can be such methodology. While co-
activation graph analysis was successfully applied in
classification tasks, no work has applied it to RL nor
in the context of safety.
In general, co-activation graph analysis explores
how NN classifiers learn by extracting their acquired
knowledge (Horta et al., 2021). The method creates a
graph in which the nodes represent neurons, and the
weighted connections show the statistical correlations
between their activations. Correlations are derived by
applying the trained NN classifier to a labeled dataset
(labels come from external knowledge) and measur-
ing the relationships between neuron activations.
However, the main challenge in RL is identifying
and integrating the missing external knowledge into
the co-activation graph analysis to extract valuable in-
formation from the trained NN policies.
In this work, we tackle the problem of generat-
ing external knowledge via safety verification and ex-
plainable RL methods to allow co-activation graph
analysis in the context of RL safety. This approach
creates a new category of explainable RL methods,
which we call semi-global safety explanations. We
achieve this through the following steps.
First, we create the unlabeled dataset containing
the states of the environment that are reachable by
the trained RL policy and for which a user-specific
safety property holds. In more detail, given a model-
based RL environment, a user-specified safety prop-
erty, and a trained RL policy, the formal model of the
interactions between the RL environment and trained
RL policy is built and verified in the following way.
We query for an action for every state reachable via
the trained policy relevant to the given safety prop-
erty. Only states reachable via that action are ex-
panded in the underlying environment. The resulting
formal model is fully deterministic, with no open ac-
tion choices. It is passed to the model checker Storm
for verification, yielding the exact safety property and
all its relevant states Gross et al. (2022).
Second, we label the whole state dataset with the
safety property as the label and compare it with other
labeled state datasets (such as another safety property
labeled dataset), or we label each state individually in
the dataset via an explainable metric (for instance, if
the state is critical or not critical for the trained pol-
icy (Milani et al., 2024; Vouros, 2023)) or another
user-specified metric.
Finally, we investigate the neuron activations of
the trained RL policy for the labeled datasets via co-
activation graph analysis methods (Horta et al., 2021;
Selani and Tiddi, 2021; Horta et al., 2023; Horta and
Mileo, 2021) to gain insights into the trained NN
policy inner-workings by analyzing the neuron co-
activations per labeled dataset and compare.
Our experiments show that RL co-activation graph
analysis is a valuable tool for interpreting NNs in RL
policies, especially for safety applications. It offers
insights into neuron importance and feature rankings,
and it identifies densely connected neuron clusters, or
functional modules, within the network. This reveals
how different parts of the neural network contribute
to safe decision-making, enhancing our understand-
ing of the model’s behavior in critical areas and fu-
eling human curiosity in the pursuit of explainable
AI (Hoffman et al., 2023, 2018; Miao et al., 2018).
Therefore, our main contribution is a framework
that allows us to apply co-activation graph analysis
specifically for RL safety interpretations.
2 RELATED WORK
In this section, we review work related to our ap-
proach. First, we position our method within the
broader field of explainable techniques for NNs.
Next, we examine research focused on the formal ver-
ification of RL policies. Finally, we discuss studies
integrating explainability with formal verification of
RL policies, highlighting where our approach con-
tributes within this combined framework.
2.1 Explainable NN Methods
Drawing inspiration from neuroscience, which uses
network analysis and graphs to understand the brain,
Horta et al. (2021) explore how NNs learn by extract-
ing the knowledge they have acquired. They devel-
oped a co-activation graph analysis in the context of
classification tasks. The authors suggest that this co-
activation graph reflects the NN’s knowledge gained
during training and can help uncover how the NN
functions internally. In this graph, the nodes represent
neurons, and the weighted connections show the sta-
tistical correlations between their activations. These
correlations are derived by applying the trained NN
classifier to a labeled dataset (labels come from exter-
nal knowledge) and measuring the relationships be-
tween neuron activations. This method enables iden-
tifying, for instance, the most important neurons for
classifying a specific class or which features are es-
sential for a specific class type.
ICAART 2025 - 17th International Conference on Agents and Artificial Intelligence
612

Building upon the foundational work by Horta
et al. (2021) on co-activation graphs in classifica-
tion tasks, (Selani and Tiddi, 2021) uses co-activation
graph analysis to investigate it in the context of au-
toencoders used in anomaly detection.
Further work exists combining explainable ar-
tificial intelligence with co-activation graph analy-
sis (Horta et al., 2023; Horta and Mileo, 2021). Their
co-activation graph analysis focuses on providing tex-
tual explanations for convolutional NNs in image
classification tasks by connecting neural representa-
tions from trained NNs with external knowledge, us-
ing the co-activation graph to predict semantic at-
tributes of unseen data, and then generating factual
and counterfactual textual explanations for classifica-
tion mistakes.
We extend the branch of co-activation graph re-
search by setting co-activation graph analysis in the
context of RL. The challenge is identifying and inte-
grating the missing external knowledge into the co-
activation graph analysis to extract valuable informa-
tion from the trained NN policies.
In RL, local explanations focus on why an RL pol-
icy selects a particular action at a specific state (Mi-
lani et al., 2024). Our approach extends these lo-
cal explanations into larger state sets by creating the
co-activation graph dataset using RL policy model
checking, combining explainability with safety. Com-
pared to global explanations that aggregate the overall
policy behavior, co-activation allows us to get a more
fine-grained analysis of the original trained RL policy.
Leading to so-called semi-global explanations.
2.2 Formal Verification of RL Policies
Various studies use model checking to verify that RL
policies do not exhibit unsafe behavior (Eliyahu et al.,
2021; Kazak et al., 2019; Corsi et al., 2021; Dr
¨
ager
et al., 2015; Zhu et al., 2019; Jin et al., 2022; Gross
et al., 2022). We build on top of the work of Gross
et al. (2022) and augment their tool to support co-
activation RL policy graph analysis (Cassez et al.,
2005; David et al., 2015).
2.3 Formal Verification and
Explainability
In the context of MDPs, there exists work (Elizalde
et al., 2007, 2009) that analyzes the feature impor-
tance (a type of explainability) of MDPs manually
and automatically. However, we focus on the inner
workings of trained RL policies for states that satisfy
user-specified safety properties.
In the context of classification tasks, work exists
that extends the PCTL language by itself to support
more trustworthiness of explanations (Termine et al.,
2021). However, we focus on sequential decision-
making of RL policies.
In the context of explainable and verified RL, ex-
isting work iteratively prunes trained NN policies to
interpret the feature importance for safety at a global
level (Gross and Spieker, 2024b). We support vari-
ous graph algorithms applied to the inner workings of
NN policies, including a way to measure the feature
importance. Additionally, some work leverages large
language models to identify safety-critical states and
apply counterfactual reasoning to explain why the RL
policy violated a safety property while proposing al-
ternative actions (Gross and Spieker, 2024a). How-
ever, this approach provides only local explanations
via an external large language model.
3 BACKGROUND
First, we introduce probabilistic model checking.
Second, we present the basics for explainable RL.
Finally, we give an introduction to co-activation
graph analysis.
3.1 Probabilistic Model Checking
A probability distribution over a set X is a function
µ: X → [0, 1] with
∑
x∈X
µ(x) = 1. The set of all dis-
tributions on X is Distr(X ).
Definition 1 (MDP). A MDP is a tuple M =
(S, s
0
, Act, Tr, rew,
AP, L) where S is a finite, nonempty set of states;
s
0
∈ S is an initial state; Act is a finite set of actions;
Tr : S×Act → Distr(S) is a partial probability transi-
tion function; rew: S ×Act → R is a reward function;
AP is a set of atomic propositions; L : S → 2
AP
is a
labeling function.
We employ a factored state representation where
each state s is a vector of features ( f
1
, f
2
, ..., f
d
) where
each feature f
i
∈ Z for 1 ≤ i ≤ d (state dimension).
Definition 2. A memoryless deterministic policy π
for an MDP M is a function π : S → Act that maps
a state s ∈ S to action a ∈ Act.
Applying a policy π to an MDP M yields an in-
duced DTMC D where all non-determinism is re-
solved.
Storm (Hensel et al., 2022) is a model checker.
It enables the verification of properties in induced
DTMCs, with reachability properties being among
the most fundamental. These properties assess the
Co-Activation Graph Analysis of Safety-Verified and Explainable Deep Reinforcement Learning Policies
613
system
system description
model
requirements
properties
model checking
satisfied
violated
modeling
translates to
formalizing
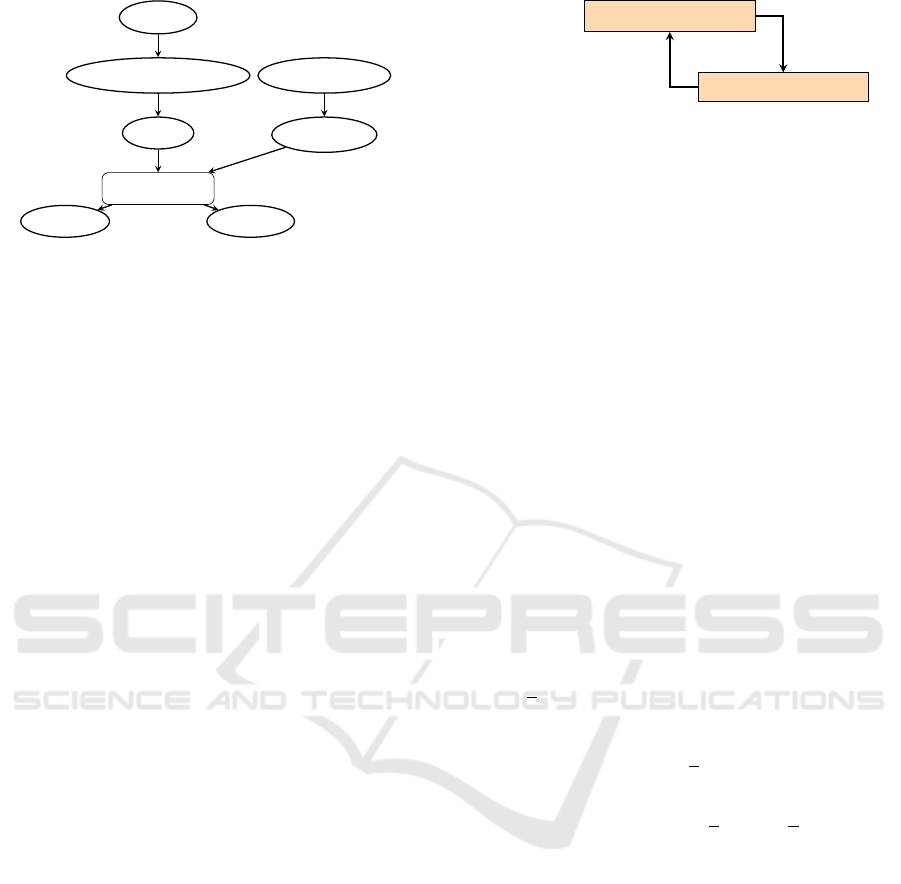
Figure 1: Model checking workflow (Hensel et al., 2022).
First, the system needs to be formally modeled, for instance,
via PRISM. Then, the requirements are formalized, for in-
stance, via PCTL. Eventually, both are inputted into the
model checker, like Storm, which verifies the property.
probability of a system reaching a particular state. For
example, one might ask, “Is the probability of the sys-
tem reaching an unsafe state less than 0.1?” A prop-
erty can be either satisfied or violated.
The general workflow for model checking with
Storm is as follows (see Figure 1): First, the system is
modeled using a language such as PRISM (PRISM,
2023). Next, a property is formalized based on the
system’s requirements. Using these inputs, the model
checker Storm verifies whether the formalized prop-
erty is satisfied or violated within the model.
In probabilistic model checking, there is no
universal “one-size-fits-all” solution (Hensel et al.,
2022). The most suitable tools and techniques depend
significantly on the specific input model and proper-
ties being analyzed. During model checking, Storm
can proceed “on the fly”, exploring only the parts of
the DTMC most relevant to the verification.
3.2 Explainable Reinforcement
Learning
The standard learning goal for RL is to learn a pol-
icy π in an MDP such that π maximizes the accumu-
lated discounted reward (Bekkemoen, 2024), that is,
E[
∑
N
t=0
γ
t
R
t
], where γ with 0 ≤ γ ≤ 1 is the discount
factor, R
t
is the reward at time t, and N is the total
number of steps.
To approximate the optimal policy π
∗
concerning
the objective, RL algorithms employ NN, which con-
tains multiple layers of neurons, as function approxi-
mators (Mnih et al., 2013).
Explainability methods are used to understand
trained RL policies (Milani et al., 2024). Global ex-
plainable RL methods, for instance, build understand-
able surrogate policies of the original policy that are
better understandable, but perform less well (Sieusa-
hai and Guzdial, 2021). Local explanation methods
RL Agent
Environment
Action
New State, Reward
Figure 2: This diagram represents an RL system in which
an agent interacts with an environment. The agent receives
a state and a reward from the environment based on its pre-
vious action. The agent then uses this information to select
the next action, which it sends to the environment.
explain the decision-making of a policy in a given en-
vironment state.
Critical State. A common approach to explana-
tions in RL is to highlight the most critical states
in a trajectory (Milani et al., 2024; Vouros, 2023),
i.e., those states where the choice of action has
a large impact on the accumulated rewards of the
episode. A measure that has been used to locate
critical states from the output of policies is the state
importance (Torrey and Taylor, 2013; Huang et al.,
2018). The state importance judges a state’s relevance
by the policy network’s outputs, i.e., the scores the
policy assigns to each action. For instance, the dis-
tance between the highest and lowest scores above a
threshold can be considered critical.
3.3 Co-Activation Graph Analysis
The co-activation values are extracted over a set of
inputs S. A co-activation value W
kl
i j
between a neuron
i in layer k and a neuron j in layer l is defined as
the correlation of the activation values A of the two
neurons for a set of inputs S (Selani and Tiddi, 2021,
see Equation 1).
W
kl
i j
= Corr(A(i, k, S), A( j, k, S)) (1)
A co-activation graph is an undirected network where
each node represents a neuron from the NN, and
the connection weights indicate co-activation val-
ues (Horta et al., 2021).
PageRank. In graph theory, centrality measures
quantify the importance of nodes within a graph.
The graph’s domain and the chosen centrality met-
ric determine the importance. In the context of the
co-activation graph, centrality measures can high-
light neurons critical for the NN’s performance (Horta
et al., 2021).
The PageRank centrality assigns an importance
score to each node by considering both its direct con-
nections and the importance of its neighbors (Page,
1999). Let N be the total number of nodes in G,
and let PR = [PR(n
1
), PR(n
2
), . . . , PR(n
N
)]
⊤
be the
ICAART 2025 - 17th International Conference on Agents and Artificial Intelligence
614

PageRank vector initialized with PR(n
i
) = 1 for all i.
The PageRank is computed iteratively using (Selani
and Tiddi, 2021):
PR(n
i
) =
1 − d
N
+ d
∑
n
j
∈N (n
i
)
A
ji
· PR(n
j
)
D(n
j
)
, (2)
where:
• d ∈ (0, 1) is the damping factor (typically d =
0.85),
• N (n
i
) is the set of neighbors of node n
i
,
• A
ji
= W
ji
is the weight of the edge between nodes
n
j
and n
i
,
• D(n
j
) is the weighted degree of node n
j
, defined
as:
D(n
j
) =
∑
n
k
∈N (n
j
)
A
jk
. (3)
The iterative process continues until convergence, i.e.,
when ∥PR
(t)
−PR
(t−1)
∥ < ε for a predefined ε > 0. In
the co-activation graph, a node with a high PageRank
score corresponds to a neuron that is strongly corre-
lated with many other influential neurons.
Louvain Community Detection. The Louvain
community detection algorithm (Blondel et al., 2023)
is employed to identify community structures within
the co-activation graph. This method optimizes the
modularity Q of the partitioning, which measures the
density of links inside communities compared to links
between communities. Modularity is defined as:
Q =
1
2m
∑
i, j
A
i j
−
k
i
k
j
2m
δ(c
i
, c
j
), (4)
where:
• A
i j
= W
i j
is the weight of the edge between nodes
i and j,
• k
i
=
∑
n
j
∈N (n
i
)
A
i j
is the weighted degree of node
i,
• m =
1
2
∑
i, j
A
i j
is the total weight of all edges in the
graph,
• c
i
is the community assignment of node i,
• δ(c
i
, c
j
) is the Kronecker delta, δ(c
i
, c
j
) = 1 if
c
i
= c
j
and 0 otherwise.
The modularity Q ranges between −1 and 1, where
higher values indicate a stronger community struc-
ture. A high modularity implies that nodes are
more densely connected within communities than be-
tween them.
4 METHODOLODGY
Our methodology consists of two main steps: gener-
ating a labeled dataset based on safety properties or
other explainable RL or user-specified methods and
applying co-activation graph analysis on the labeled
dataset to interpret the NN policy. The steps are de-
tailed in the first two subsections, followed by a limi-
tation analysis of our methodology.
4.1 Labeled Dataset Generation
In the first step, we create a dataset of states reflect-
ing a user-specified safety property. Given an MDP
of the RL environment, a trained RL policy π, and a
desired safety property, we first incrementally build
the induced DTMC of the policy π, and the MDP M
as follows.
For every reachable state s via the trained policy
π, we query for an action a = π(s). In the underly-
ing MDP M, only states s
′
reachable via that action
a ∈ A(s) are expanded. The resulting DTMC D in-
duced by M and π is fully deterministic, with no open
action choices, and is passed to the model checker
Storm for verification, yielding the exact results con-
cerning satisfying the safety property or violating it,
and the states S belonging to the specific safety prop-
erty (Gross et al., 2022).
Now, we have two options to proceed.
Option 1. We label the entire dataset by associat-
ing each state s ∈ S with the specific safety property.
In addition to this labeling, we also create alterna-
tive labeled datasets for comparative analysis. For
instance, we may label the dataset according to a dif-
ferent safety property or specify a particular metric of
interest (such as states with specific properties). This
enables us to explore policy behavior variations under
different metrics.
Option 2. By introducing other metrics, we can also
classify each state s ∈ S individually. For example,
we may categorize each state s as “critical” or “non-
critical” based on the policy’s outputs. These met-
rics can also be user-defined, allowing customization
to reflect the policy’s inner workings for the initial
safety property.
4.2 Co-Activation Graph Analysis
We apply co-activation graph analysis on the labeled
dataset to interpret the RL policy’s neural network’s
internal structure and decision-making process. For
Co-Activation Graph Analysis of Safety-Verified and Explainable Deep Reinforcement Learning Policies
615

each label, we conduct the analysis separately, exam-
ining all data points associated with that label. This
allows us to understand how the network behaves dif-
ferently across distinct labels. By comparing the re-
sults across labels, we can identify label-specific in-
fluences within the NN and highlight structural and
functional differences in its inner workings.
In this analysis, each neuron in the NN is repre-
sented as a node, and the connections between neu-
rons are weighted by the statistical correlations in
their activation patterns. By examining this graph’s
structure and community relationships, we identify
key neurons, rank influential state features, and as-
sess the density of connections within and between
neuron communities. We refer to the background sec-
tion for details about the specific graph analysis algo-
rithms (see Section 3.3).
These insights are crucial for interpretability, as
they reveal decision-making pathways within the neu-
ral network, clarifying how specific inputs drive pol-
icy actions.
Co-Activation Graphs in Classification and Se-
quential Decision-Making. Co-activation graph
analysis relies on a labeled dataset, with the labeling
process differing between classification tasks and se-
quential decision-making. In our RL safety setting,
the dataset is generated via policy model checking and
labeled by a user-defined function.
When combined with model checking, coactiva-
tion graph analysis provides more global insights than
local explanation methods focusing on a single state.
At the same time, it offers a more fine-grained under-
standing than typical global explanation methods by
revealing the policy’s behavior in specific regions of
the RL environment where safety properties are held.
4.3 Advantages and Limitations
RL policy co-activation graph analysis without safety
properties is also possible for model-free RL environ-
ments (without rigorous model checking) by collect-
ing states s for S by executing the policy in the envi-
ronment and labeling them just via local RL explana-
tion methods.
Our explainable RL safety method with co-
activation graph analysis supports memoryless NN
policies within modeled MDP environments, limited
by its model checking for large state space and tran-
sition counts (Gross et al., 2022). The co-activation
graph analysis works with any layer in the NN archi-
tecture and supports labeled datasets of different sizes
that can be found in labeled datasets for classification
tasks (Horta et al., 2021).
While we built our work on top of the COOL-
MC (Gross et al., 2022), we do not see any limita-
tions in replacing this specific verification tool with
other ones, such as MoGym (Gros et al., 2022).
5 EXPERIMENTS
In this section, we evaluate our proposed method and
show that it is applicable in the context of explain-
able RL safety. We begin by introducing the RL en-
vironments used in our experiments. Next, we de-
scribe the trained RL policies. We then explain the
technical setup. After that, we apply our method for
co-activation graph analysis in various RL safety set-
tings. The first setting uses co-activation graph analy-
sis for two different safety properties, the second set-
ting uses it for an explainable RL method in the con-
text of a specific safety property. The final subsection
summarizes additional observations of applying co-
activation graph analysis in RL safety.
Environments. In the experiments, we use a taxi
and a cleaning robot environment that are described
below.
The taxi agent has to pick up passengers and trans-
port them to their destination without running out of
fuel. The environment terminates as soon as the taxi
agent does the predefined number of jobs or runs out
of fuel. After the job is done, a new guest spawns ran-
domly at one of the predefined locations (Gross et al.,
2022). For the first job, the passenger location and
destination is always the same, afterwards the passen-
ger location and destination is set to four locations
randomly.
S = {(x, y, passenger loc x, passenger loc y,
passenger dest x,
passenger dest y, f uel,
done, on board,
jobs done, done),
...}
Act = {north, east, south, west, pick up, drop}
Penalty =
0, if passenger successfully dropped.
21, if passenger got picked up.
21 + |x − passenger dest x|+
|y − passenger dest y|,
if passenger on board.
21 + |x − passenger loc x|+
|y − passenger loc y|, otherwise
ICAART 2025 - 17th International Conference on Agents and Artificial Intelligence
616

A robotic agent cleans rooms while avoiding col-
lisions and conserving energy. Collisions refer to
cleaning a room that has been cleaned by another en-
tity. The state includes room cleanliness, slipperiness,
and the agent’s battery level. The agent can apply dif-
ferent cleaning options for different types of dirt that
vary in their strength and effect on the environment.
The agent is rewarded for correct actions, and the en-
vironment terminates upon collisions, energy deple-
tion, or cleaning an already clean room (Gross and
Spieker, 2024a).
S = {(dirt1, dirt2, energy, slippery level,
room blocked), . . . }
Act = {next room,charge option1, charge option2,
clean1 option1, clean1 option2, clean2 option1,
clean2 option2, all purpose clean, idle}
Reward =
20 · dirt∗,
if clean* operation for dirt* successful.
20 · dirt1 · dirt2,
if all purpose clean operation successful.
20,
if changing room correctly.
10,
if idle when slippery level>0
an room not blocked.
10,
if charging starts between
energy¿0 and energy≤ 2.0,
otherwise.
Trained RL Policies. For the taxi environment, we
train all RL policies using the deep Q-learning algo-
rithm (Mnih et al., 2013). In the taxi environment,
the trained RL policy received an average penalty of
−615 over 100 episodes across 72,975 epochs.
For the cleaning robot environment, we train an
RL policy using deep Q-learning (Mnih et al., 2013)
with 4 hidden layers of 512 neurons each. Training
parameters were a batch size of 64, epsilon decay
of 0.99999, minimum epsilon 0.1, initial epsilon 1,
γ 0.99, and target network updates every 1024 steps.
The policy achieved an average reward of 67.8 over
100 episodes in 27,709 epochs.
Technical Setup. We executed our benchmarks in
a docker container with 16 GB RAM, and an AMD
Ryzen 7 7735hs with Radeon graphics × 16 proces-
sor with the operating system Ubuntu 20.04.5 LTS.
For model checking, we use Storm 1.7.1 (dev). The
code can be found on https://github.com/LAVA-LAB/
COOL-MC/tree/co
activation.
Figure 3: The 50 most significant neurons identified for
each safety property.
5.1 Comparative Analysis of Trained
RL Policies Across Different Safety
Scenarios
In this experiment, we show, using the taxi environ-
ment, that it is possible to use co-activation graph
analysis with model checking to gain safety insights
into the trained RL policy and observe NN inner
workings for different safety properties.
Setup. In this experiment, we compare the co-
activation graphs of a policy that differs for the
datasets associated with the safety property of fin-
ishing with a reachability probability of 1 one
job (P
=1
(♢ jobs = 1)) vs. finishing two jobs
(P
=1
(♢ jobs = 2)). This can give us, for instance, in-
sights into what features are more relevant in the be-
ginning of the taxi policy execution compared to later
steps in the environment.
Execution. We first create the two labeled datasets
by building the formal model for each and verify each
model with the corresponding PCTL queries. The la-
beled dataset for safety property P
=1
(♢ jobs = 1) has
12 data points and the labeled dataset for safety prop-
erty P
=1
(♢ jobs = 2) has 206 data points.
We apply the PageRank algorithm to rank all neu-
rons in the neural network and use the Louvain com-
munity detection algorithm to identify neuron com-
munities and calculate modularity values.
Results. In Figure 3, we observe that the 50 most
important neurons differ across safety properties. The
most important neuron for the safety property of fin-
ishing one job is in hidden layer 1, while it is in hidden
layer 3 for finishing two jobs.
Co-Activation Graph Analysis of Safety-Verified and Explainable Deep Reinforcement Learning Policies
617
The most important state features for the property
of finishing two jobs are the passenger’s destination
and the number of jobs completed, and indeed, when
you prune the outgoing connections from these fea-
ture neurons (Gross and Spieker, 2024b), the safety
property gets violated, and the reachability probabil-
ity of finishing two jobs is only 0.25 indicating that
it just randomly selects one out of the four different
passenger targets.
For finishing one job, the most significant features
are the fuel level, the passenger’s x-coordinate desti-
nation, and the number of jobs completed. And in-
deed, when pruning these feature neurons, the safety
property gets violated and the reachability probability
of finishing one jobs drops to zero. The initial lo-
cation of the passenger is irrelevant for the first job
because the starting location and destination are con-
sistent in the environment; however, it becomes rel-
evant for subsequent passengers, which may also ex-
plain the importance of the number of jobs completed.
Community analysis reveals stronger interactions
among neurons, with a modularity of 0.29 for
P
=1
(♢ jobs = 1) and 0.25 for P
=1
(♢ jobs = 2). The
community overlap is approximately 97%, indicating
that the same regions of the neural network process
both properties.
5.2 Critical vs. Non-Critical State
Analysis for a Specific Safety
Scenario
In this experiment, we target a specific safety property
for applying co-activation graph analysis. We catego-
rize the states using a local explainable RL method
to label the dataset. This approach demonstrates that
integrating model checking and established local ex-
plainable RL methods with co-activation graph anal-
ysis can yield deeper insights into neural network
policy decision-making. Experiments are again per-
formed on the taxi environment.
Setup. We focus on a dataset of states linked to the
safety property of completing two jobs with a reacha-
bility probability of 1 (P
=1
(♢ jobs = 2)). Labeling is
performed through critical state classification, where
a threshold of 100 is set for the distance between the
highest and lowest predicted Q-values of the policy.
Each state is labeled as critical if this Q-value distance
meets or exceeds the threshold.
Execution. We collect the states associated with
P
=1
(♢ jobs = 2) and label each state as either criti-
cal or non-critical based on its classification criteria.
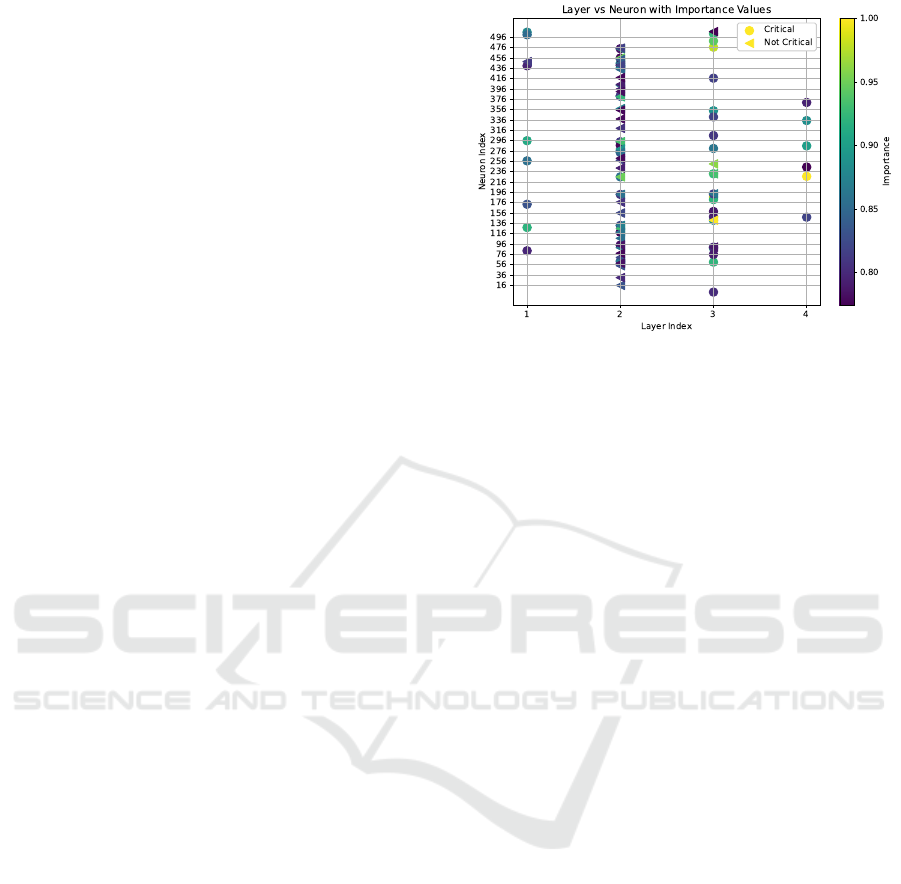
Figure 4: The 50 most significant neurons for the safety
property P
=1
(♢ jobs = 2) identified for critical and non-
critical states.
In total, we got 206 data points, where 22 data points
are labeled as critical and 184 as non-critical.
We apply the PageRank algorithm to rank all neu-
rons in the neural network and use the Louvain com-
munity detection algorithm to identify neuron com-
munities and calculate modularity values.
Results. In Figure 4, we observe the 50 most im-
portant neurons for critical and non-critical states. We
observe that the most influential neuron is located in
layer 3 for non-critical states. In contrast, for criti-
cal states, it is in layer 4, providing insights into the
neural network’s internal processing.
In analyzing the key features from the centrality
analysis, we find that the top three features for critical
states involve the passenger’s destination and whether
the passenger is on board. In contrast, the most sig-
nificant features for non-critical states are the passen-
ger’s destination and current x-coordinate.
Community analysis reveals stronger interactions
among neurons for critical states, with a modularity
of 0.25 compared to 0.23 for non-critical states. Com-
munity overlap is approximately 93%, indicating that
both critical and non-critical states are processed in
largely the same neural network regions.
5.3 Additional Observations
Next to the two different ways to apply co-activation
graph analysis in the context of RL safety, we made
the following observations.
Common Observations in Both Environments.
Interestingly, hidden layer 2 appears to be the most
relevant in both experiments on average. This sug-
gests that most of the decision-making process is
ICAART 2025 - 17th International Conference on Agents and Artificial Intelligence
618

completed at this stage, with the final layer primarily
serving to route the decision to the appropriate action.
Comparative Method Analysis. Further, we com-
pared our approach with an alternative explainable RL
safety approach from Gross and Spieker (2024b).
In our experiment in Section 5.1, we show that the
most relevant features for satisfying the safety prop-
erty P
=1
(♢ jobs = 2) are the passenger’s destination
and the number of jobs completed, and indeed, when
you prune the outgoing connections from these fea-
ture neurons, the safety property gets violated, and the
reachability probability of finishing two jobs is only
0.25 indicating that it just randomly selects one out of
the four different passenger targets.
For finishing one job, the most significant features
are the fuel level, the passenger’s x-coordinate des-
tination, and the number of jobs completed. Indeed,
when pruning these feature neurons, the safety prop-
erty gets violated, and the reachability probability of
finishing one job drops to zero.
These findings conform that our method correctly
identifies significant and highly relevant neurons for
the safety properties.
Different RL Environments. Finally, we ap-
plied co-activation analysis to the cleaning robot
environment. Here, for a labeled dataset for
the safety property P
=0.6
(♢energy = 0) and
P
=0.02
(♢wrong room switch), we observe that
the communities overlap in 0.95 of the cases
while the feature importance ranking is the
same. The modularity for the first safety prop-
erty P
=0.6
(♢energy = 0) is 0.37 an for the second
property P
=0.02
(♢wrong room switch) is 0.35.
While we focus in our investigation mainly on the
taxi environment, this experiment confirms that our
method is similarly applicable to other environments.
6 CONCLUSION
In this paper, we introduced a methodology that inte-
grates RL policy model checking (Gross et al., 2022)
with co-activation graph analysis to improve the ex-
plainable safety of RL policies. By generating labeled
datasets through model checking and local explain-
able RL methods, we extended co-activation graph
analysis (Horta and Mileo, 2019) to apply it within
RL safety. Our approach enables examining NN poli-
cies by analyzing neuron activation patterns in states
associated with specific safety properties and local ex-
plainable RL method results.
For future work, we plan to examine how co-
activation graph analysis can be applied within multi-
agent RL settings (Zhu et al., 2024) or to be used for
safe NN policy pruning (Gross and Spieker, 2024b).
REFERENCES
Baier, C. and Katoen, J.-P. (2008). Principles of model
checking. MIT press.
Ban, J. and Li, G. (2024). Training is execution: A re-
inforcement learning-based collision avoidance algo-
rithm for volatile scenarios. IEEE Access, 12:116956–
116967.
Bekkemoen, Y. (2024). Explainable reinforcement learning
(XRL): a systematic literature review and taxonomy.
Mach. Learn., 113(1):355–441.
Blondel, V. D., Guillaume, J., and Lambiotte, R. (2023).
Fast unfolding of communities in large networks: 15
years later. CoRR, abs/2311.06047.
Br
´
azdil, T., Chatterjee, K., Chmelik, M., Forejt, V.,
Kret
´
ınsk
´
y, J., Kwiatkowska, M. Z., Parker, D., and
Ujma, M. (2014). Verification of markov decision pro-
cesses using learning algorithms. In ATVA, volume
8837 of LNCS.
Cassez, F., David, A., Fleury, E., Larsen, K. G., and Lime,
D. (2005). Efficient on-the-fly algorithms for the anal-
ysis of timed games. In CONCUR, volume 3653
of Lecture Notes in Computer Science, pages 66–80.
Springer.
Corsi, D., Marchesini, E., and Farinelli, A. (2021). For-
mal verification of neural networks for safety-critical
tasks in deep reinforcement learning. In de Campos,
C. and Maathuis, M. H., editors, Proceedings of the
Thirty-Seventh Conference on Uncertainty in Artifi-
cial Intelligence, volume 161 of Proceedings of Ma-
chine Learning Research, pages 333–343. PMLR.
David, A., Jensen, P. G., Larsen, K. G., Mikucionis, M., and
Taankvist, J. H. (2015). Uppaal stratego. In TACAS,
volume 9035 of Lecture Notes in Computer Science,
pages 206–211. Springer.
Dr
¨
ager, K., Forejt, V., Kwiatkowska, M. Z., Parker, D.,
and Ujma, M. (2015). Permissive controller synthe-
sis for probabilistic systems. Log. Methods Comput.
Sci., 11(2).
Eliyahu, T., Kazak, Y., Katz, G., and Schapira, M.
(2021). Verifying learning-augmented systems. In
SIGCOMM, pages 305–318. ACM.
Elizalde, F., Sucar, L. E., Noguez, J., and Reyes, A. (2009).
Generating explanations based on markov decision
processes. In MICAI, volume 5845 of Lecture Notes
in Computer Science, pages 51–62. Springer.
Elizalde, F., Sucar, L. E., Reyes, A., and deBuen, P. (2007).
An MDP approach for explanation generation. In
ExaCt, volume WS-07-06 of AAAI Technical Report,
pages 28–33. AAAI Press.
Gros, T. P., Hermanns, H., Hoffmann, J., Klauck, M., K
¨
ohl,
M. A., and Wolf, V. (2022). Mogym: Using formal
models for training and verifying decision-making
Co-Activation Graph Analysis of Safety-Verified and Explainable Deep Reinforcement Learning Policies
619

agents. In CAV (2), volume 13372 of Lecture Notes
in Computer Science, pages 430–443. Springer.
Gross, D., Jansen, N., Junges, S., and P
´
erez, G. A. (2022).
COOL-MC: A comprehensive tool for reinforcement
learning and model checking. In SETTA, volume
13649 of Lecture Notes in Computer Science, pages
41–49. Springer.
Gross, D. and Spieker, H. (2024a). Enhancing rl safety with
counterfactual llm reasoning. In ICTSS 2024, 36th In-
ternational Conference on Testing Software and Sys-
tems.
Gross, D. and Spieker, H. (2024b). Safety-oriented prun-
ing and interpretation of reinforcement learning poli-
cies. In Proceedings of the 32nd European Symposium
on Artificial Neural Networks, Computational Intelli-
gence and Machine Learning (ESANN 2024).
Hahn, E. M., Perez, M., Schewe, S., Somenzi, F., Trivedi,
A., and Wojtczak, D. (2019). Omega-regular objec-
tives in model-free reinforcement learning. In TACAS
(1), volume 11427 of LNCS, pages 395–412. Springer.
Hansson, H. and Jonsson, B. (1994). A logic for reasoning
about time and reliability. Formal Aspects Comput.,
6(5):512–535.
Hasanbeig, M., Kroening, D., and Abate, A. (2020). Deep
reinforcement learning with temporal logics. In FOR-
MATS, volume 12288 of LNCS.
Hensel, C., Junges, S., Katoen, J., Quatmann, T., and Volk,
M. (2022). The probabilistic model checker Storm.
Int. J. Softw. Tools Technol. Transf., 24(4):589–610.
Hoffman, R. R., Mueller, S. T., Klein, G., and Litman, J.
(2018). Metrics for explainable AI: challenges and
prospects. CoRR, abs/1812.04608.
Hoffman, R. R., Mueller, S. T., Klein, G., and Litman,
J. (2023). Measures for explainable AI: explanation
goodness, user satisfaction, mental models, curiosity,
trust, and human-ai performance. Frontiers Comput.
Sci., 5.
Horta, V. A. C. and Mileo, A. (2019). Towards explain-
ing deep neural networks through graph analysis. In
DEXA Workshops, volume 1062 of Communications
in Computer and Information Science, pages 155–
165. Springer.
Horta, V. A. C. and Mileo, A. (2021). Generating local tex-
tual explanations for cnns: A semantic approach based
on knowledge graphs. In AI*IA, volume 13196 of
Lecture Notes in Computer Science, pages 532–549.
Springer.
Horta, V. A. C., Sobczyk, R., Stol, M. C., and Mileo,
A. (2023). Semantic interpretability of convolutional
neural networks by taxonomy extraction. In NeSy,
volume 3432 of CEUR Workshop Proceedings, pages
118–127. CEUR-WS.org.
Horta, V. A. C., Tiddi, I., Little, S., and Mileo, A.
(2021). Extracting knowledge from deep neural net-
works through graph analysis. Future Gener. Comput.
Syst., 120:109–118.
Huang, S. H., Bhatia, K., Abbeel, P., and Dragan, A. D.
(2018). Establishing appropriate trust via critical
states. In 2018 IEEE/RSJ international conference
on intelligent robots and systems (IROS), pages 3929–
3936. IEEE.
Ji, Z., Liu, G., Xu, W., Yao, B., Liu, X., and Zhou, Z.
(2024). Deep reinforcement learning on variable stiff-
ness compliant control for programming-free robotic
assembly in smart manufacturing. Int. J. Prod. Res.,
62(19):7073–7095.
Jin, P., Wang, Y., and Zhang, M. (2022). Efficient LTL
model checking of deep reinforcement learning sys-
tems using policy extraction. In SEKE, pages 357–
362. KSI Research Inc.
Kazak, Y., Barrett, C. W., Katz, G., and Schapira, M.
(2019). Verifying deep-rl-driven systems. In Ne-
tAI@SIGCOMM, pages 83–89. ACM.
Liu, L., Yang, J., and Yan, B. (2024). A dynamic mission
abort policy for transportation systems with stochastic
dependence by deep reinforcement learning. Reliab.
Eng. Syst. Saf., 241:109682.
Miao, C., Zeng, Z., Wu, Q., Yu, H., and Leung, C. (2018).
Humanized artificial intelligence: What, why and
how. International Journal of Information Technol-
ogy, 24(2).
Milani, S., Topin, N., Veloso, M., and Fang, F. (2024). Ex-
plainable reinforcement learning: A survey and com-
parative review. ACM Comput. Surv., 56(7):168:1–
168:36.
Mnih, V., Kavukcuoglu, K., Silver, D., Graves, A.,
Antonoglou, I., Wierstra, D., and Riedmiller, M. A.
(2013). Playing atari with deep reinforcement learn-
ing. CoRR, abs/1312.5602.
Mnih, V., Kavukcuoglu, K., Silver, D., Rusu, A. A., Ve-
ness, J., Bellemare, M. G., Graves, A., Riedmiller,
M. A., Fidjeland, A., Ostrovski, G., Petersen, S.,
Beattie, C., Sadik, A., Antonoglou, I., King, H., Ku-
maran, D., Wierstra, D., Legg, S., and Hassabis, D.
(2015). Human-level control through deep reinforce-
ment learning. Nat., 518(7540):529–533.
Page, L. (1999). The pagerank citation ranking: Bringing
order to the web. Technical report, Technical Report.
PRISM (2023). PRISM Manual. www.prismmodelchecker.
org. Accessed: 03/14/2024.
Schilling, C., Lukina, A., Demirovic, E., and Larsen, K. G.
(2023). Safety verification of decision-tree policies in
continuous time. In NeurIPS.
Selani, D. and Tiddi, I. (2021). Knowledge extraction from
auto-encoders on anomaly detection tasks using co-
activation graphs. In K-CAP, pages 65–71. ACM.
Sieusahai, A. and Guzdial, M. (2021). Explaining deep
reinforcement learning agents in the atari domain
through a surrogate model. In AIIDE, pages 82–90.
AAAI Press.
Strehl, A. L., Diuk, C., and Littman, M. L. (2007). Efficient
structure learning in factored-state mdps. In AAAI,
pages 645–650. AAAI Press.
Sutton, R. S. and Barto, A. G. (2018). Reinforcement learn-
ing: An introduction. MIT press.
Termine, A., Primiero, G., and D’Asaro, F. A. (2021).
Modelling accuracy and trustworthiness of explaining
agents. In LORI, volume 13039 of Lecture Notes in
Computer Science, pages 232–245. Springer.
ICAART 2025 - 17th International Conference on Agents and Artificial Intelligence
620

Torrey, L. and Taylor, M. E. (2013). Teaching on a budget:
agents advising agents in reinforcement learning. In
AAMAS, pages 1053–1060. IFAAMAS.
Vamplew, P., Smith, B. J., K
¨
allstr
¨
om, J., de Oliveira Ramos,
G., Radulescu, R., Roijers, D. M., Hayes, C. F.,
Heintz, F., Mannion, P., Libin, P. J. K., Dazeley, R.,
and Foale, C. (2022). Scalar reward is not enough:
a response to silver, singh, precup and sutton (2021).
AAMAS, 36(2):41.
Vouros, G. A. (2023). Explainable Deep Reinforcement
Learning: State of the Art and Challenges. ACM Com-
puting Surveys, 55(5):1–39. arXiv:2301.09937 [cs].
Wang, Y., Liu, A., Yang, J., Wang, L., Xiong, N.,
Cheng, Y., and Wu, Q. (2024). Clinical knowledge-
guided deep reinforcement learning for sepsis antibi-
otic dosing recommendations. Artif. Intell. Medicine,
150:102811.
Wang, Y., Roohi, N., West, M., Viswanathan, M., and
Dullerud, G. E. (2020). Statistically model checking
PCTL specifications on markov decision processes via
reinforcement learning. In CDC, pages 1392–1397.
IEEE.
Watkins, C. J. and Dayan, P. (1992). Q-learning. Machine
learning, 8:279–292.
Zhu, C., Dastani, M., and Wang, S. (2024). A survey of
multi-agent deep reinforcement learning with commu-
nication. Auton. Agents Multi Agent Syst., 38(1):4.
Zhu, H., Xiong, Z., Magill, S., and Jagannathan, S. (2019).
An inductive synthesis framework for verifiable rein-
forcement learning. In PLDI, pages 686–701. ACM.
Co-Activation Graph Analysis of Safety-Verified and Explainable Deep Reinforcement Learning Policies
621
