
Comparative Study of Data Processing Techniques for Pancreatic Islets
in Organ-on-Chip Applications
Roland Giraud
1 a
, Dorian Chapeau
1 b
, Jochen Lang
2 c
, Matthieu Raoux
2 d
,
Sylvie Renaud
2 e
and Antoine Pirog
3 f
1
Univ. Bordeaux, CNRS, Bordeaux INP, IMS, UMR 5218, F-33400 Talence, France
2
Univ. Bordeaux, CNRS, Bordeaux INP, CBMN, UMR 5248, F-33600 Pessac, France
3
Junia, Electronics-Physics-Acoustics Department, F-59000 Lille, France
Keywords:
Organ-on-Chips, MEA, Beta Cells, GLR, DWT, FFT.
Abstract:
Organ-on-chip technology presents a promising platform to study complex physiological processes in a con-
trolled environment. However organ-on-chip devices bring considerable constraints to online monitoring in-
strumentation. This study investigates methods for leveraging data from organ-on-chip systems designed for
diabetic studies by processing recorded extracellular signals from pancreatic islets. The signal processing
techniques used are designed to address the inherent constraints of microfluidics, particularly to provide on-
line (real-time) readings and operate effectively in low Signal-to-Noise Ratio (SNR) conditions. This study
assesses the performance of different algorithms using several detection approaches. Synthetic and experi-
mental data were utilized to evaluate algorithm robustness to best account for biological variability. Among
the algorithms tested, those based on frequency and time-frequency methods performed best when compared
to conventional filtering and thresholding approaches, especially regarding robustness to noise and biological
variability.
1 INTRODUCTION
Organ-on-Chips (OoC) are miniature systems repli-
cating human organ structure and function on a mi-
croscale. Constructed using microfabrication tech-
niques, these chips house animal or human cells that
mimic organ function in micro- to milli-meter scale
culture chambers. Microfluidic channels control the
flow of nutrients, oxygen, and other substances, cre-
ating a dynamic microenvironment. Equipped with
sensors for real-time monitoring, OoC technology is
invaluable for studying physiological processes, mod-
eling diseases, and testing drug responses in a more
physiologically accurate in vitro setting (Clapp et al.,
2021). This innovation holds the potential to advance
drug development and personalized medicine by of-
fering relevant and reliable experimentation models in
a
https://orcid.org/0009-0009-5639-0697
b
https://orcid.org/0000-0002-5998-2905
c
https://orcid.org/0000-0001-6847-5641
d
https://orcid.org/0000-0001-8791-2034
e
https://orcid.org/0000-0001-5632-7991
f
https://orcid.org/0000-0002-7913-003X
a wide range of application cases (Mastrangeli et al.,
2019). However, Organ-on-Chip technology faces
notable challenges (Wikswo et al., 2013). First, in-
tegrating sensors onto the chip poses significant chal-
lenges due to its small size and the biological nature
of the cultured material (Fuchs et al., 2021). Second,
microfluidic equipment and flow introduce substan-
tial noise during data acquisition. Additionally, the
system requires fast data processing algorithms to ad-
dress the demand for online monitoring (Moya et al.,
2018) and feedback (either automated or performed
by the experimenter).
This study was conducted in the context of OoC
for diabetes and establishes a comparison of algo-
rithmic solutions to process electrophysiological data
from pancreatic islets recorded on MicroElectrode
Arrays (MEA). In response to glucose, pancreatic
beta cells activate and produce an oscillatory electri-
cal signal that synchronizes with neighboring cells via
a gap-junction protein (connexin36) (Lebreton et al.,
2015). The resulting electrical signature resembles
Action Potentials in shape, but with a broader and
slower profile known as Slow Potentials (SP). SP os-
cillatory frequency (ranging between 0.2-2 Hz) corre-
Giraud, R., Chapeau, D., Lang, J., Raoux, M., Renaud, S. and Pirog, A.
Comparative Study of Data Processing Techniques for Pancreatic Islets in Organ-on-Chip Applications.
DOI: 10.5220/0013255700003911
Paper published under CC license (CC BY-NC-ND 4.0)
In Proceedings of the 18th International Joint Conference on Biomedical Engineering Systems and Technologies (BIOSTEC 2025) - Volume 1, pages 957-963
ISBN: 978-989-758-731-3; ISSN: 2184-4305
Proceedings Copyright © 2025 by SCITEPRESS – Science and Technology Publications, Lda.
957
lates with the insulin production of Langherans islets
and therefore gives precious insight of islet physiol-
ogy (Jaffredo et al., 2021). This research aims at
finding a precise, robust, and real-time method of
measurement for the Slow Potential (SP) frequency,
within the context of monitoring OoC devices for di-
abetes research.
2 MATERIAL AND METHODS
2.1 Electrophysiology Setup and Data
Acquisition
The signal generated by beta cells was recorded us-
ing a Micro Electrode Array bonded to a PDMS
microfluidic chip. Electrophysiological data were
recorded using two widely used acquisition frontends
: MCS 1060 preamplifier and USB-ME64 acquisition
board as described in (Lebreton et al., 2015), or Intan
RHD2132 pre-amplifiers (Abarkan et al., 2022) con-
nected to a FPGA board for recording. All signal ac-
quisition was performed at a sampling rate of 10 kHz.
This study presents results from diverse (static and
microfluidic) experiments and protocols.
2.2 Pancreatic Islet Signal Preliminary
Analysis
Preliminary studies were carried out to determine the
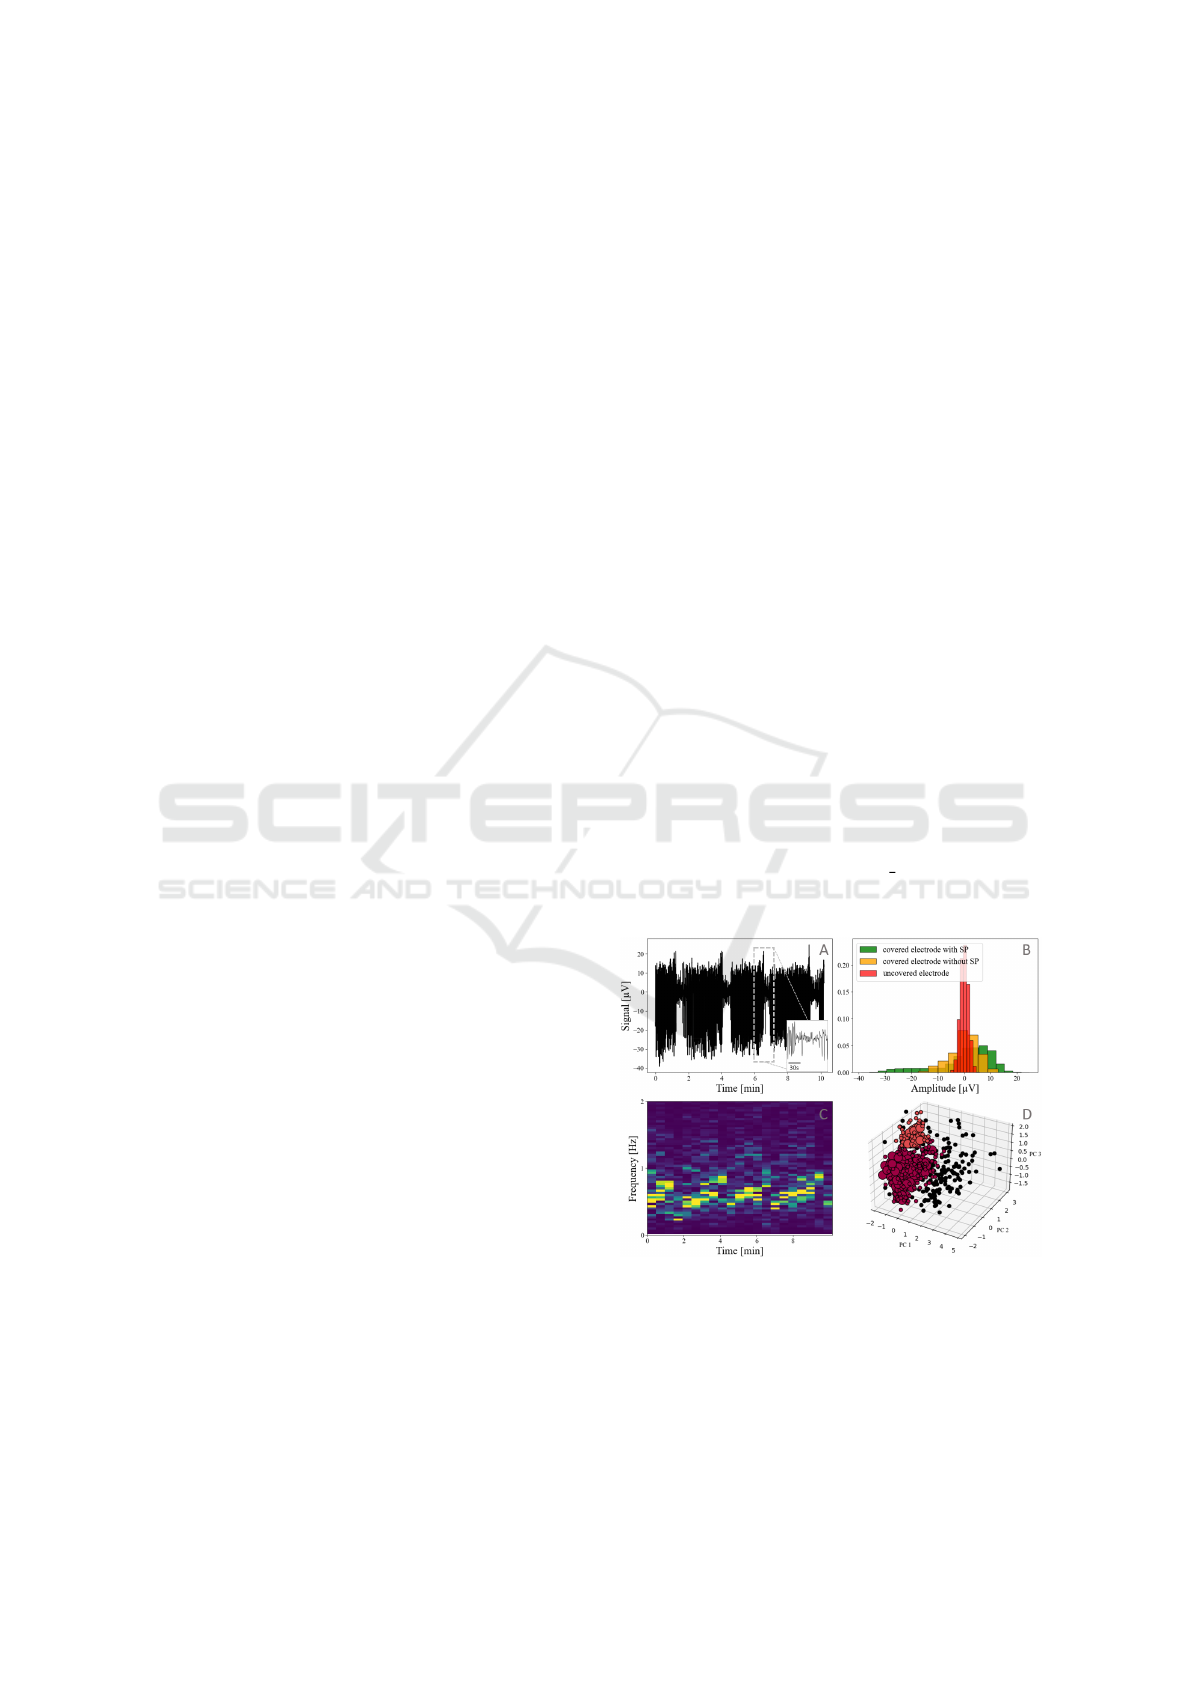
relevant parameters for SP identification. Fig. 1 illus-
trates key identification criteria for SP. In Fig. 1.A, the
islet signal exhibits a pulsatile behavior, alternating
between silent and active phases. SP are character-
ized by a specific high depolarization phase (Fig. 1.B,
covered electrodes with SP) and occur in a frequency
band of 0.2 Hz to 2.0 Hz (Fig. 1.C). With islet
activity being modulated by glucose concentration,
these measurements were conducted using a culture
medium containing 11 mMol/l of glucose in which
islets exhibit sustained activity. A Principal Com-
ponent Analysis (PCA) and dbscan clustering was
performed on metrics extracted from detected events
: amplitude, frequency, amplitude of neighbouring
events, frequency of neighbouring events, and wave-
form (waveform data points resampled to the dimen-
sions of the shortest waveform detected) (Fig. 1.D).
This is intended to highlight, based on event prop-
erties, clusters separating false detections of noisy
events from physiological SP events. This cluster-
ing proved highly variable and did not - by itself -
provide a robust method for separating biological sig-
natures (SPs) from noise, which indicated that noise
and SP share similar characteristics ; therefore, more
sophisticated detection algorithms are needed to dif-
ferentiate them.
2.3 Algorithmic Solutions
Taking into account signal characteristics, several al-
gorithmic solutions were tested to evaluate the fre-
quency of SPs. All signal processing and algorithmic
tests were performed in Python 3.11.1 and libraries
Scipy 1.10.0, Numpy 1.24.1, and PyWavelets 1.4.1.
The algorithmic solutions (described individually
below) were tested and compared via parametric anal-
yses mimicking a range of acquisition parameters
(e.g. signal-to-noise ratio) and detection parameters
(e.g. detection threshold). For a fair comparison of
performance between algorithmic solutions, their de-
tection parameters were normalized relative to their
value of best performance (normalized parameter ex-
pressed as ∆/∆
0
where ∆ is the absolute value of
the parameter and ∆
0
its value at best performance).
Recorded signals were downsampled to 100 Hz to en-
hance computational efficiency without loss of rele-
vant biological information considering the frequency
range of interest for SP (0.2 Hz to 2.0Hz).
2.3.1 Offline Peak Detection
Slow Potentials were detected as local minima in the
signal, found using Scipy’s find peaks (further re-
ferred to as FP) algorithm from Scipy 1.10.0 This
function finds all local maxima by comparison of
Figure 1: Characteristics of recorded islets electrophysio-
logical data: (A) Filtered data from one MEA channel, (B)
Amplitude histogram of three different channels (C) Spec-
trogram of A (D) Principal Component Analysis and DB-
SCAN clustering. True detections of SPs are shown in dark
red, false detections caused by noise are shown in black and
light red shows detections that could not be identified as ei-
their noise or true detection.
BIOSIGNALS 2025 - 18th International Conference on Bio-inspired Systems and Signal Processing
958

neighboring values. As a baseline, prominence pa-
rameters were manually tuned to best match signal
characteristics and maximize detection rate. Before
peak detection, signals were filtered using Butter-
worth bandpass filter (0.2 Hz, 1
st
order to 2 Hz, 2
nd
order).
2.3.2 Online Peak Detection
To account for the real-time constraint of our study
and provide a comparison reference with previous
works, the next algorithms are either real-time or real-
time-compatible. This algorithm (further referred to
as RT), previously described in (Pirog et al., 2018), is
also based on extremum detection with a prominence
parameter. To include a validation period around
every local extremum detected and avoid false de-
tections caused by signal jittering, SP detected with
this algorithms are processed some milliseconds after
their actual appearance. Butterworth bandpass filter-
ing was applied before detection (0.2 Hz, 1
st
order to
2 Hz, 2
nd
order).
2.3.3 Discrete Wavelet Transform Filtering
In this detection algorithm, signals were filtered using
wavelet transformation before performing SP detec-
tion. The discrete wavelet transform (further referred
to as DWT) (Unser and Aldroubi, 1996) is a math-
ematical transformation used to break down a signal
into multiple sets of discretely sampled wavelets, that
describe how the signal evolves over time within a
specific frequency range. Therefore SP can be de-
tected by selecting the coefficient in the frequency
band of SP and applying prominence-based event de-
tection. The DWT was applied to the input signal us-
ing Daubechies wavelets (db4) and 10 transform lev-
els. Then for each set within the frequency band of
interest (levels 0 to 6), a threshold was applied and
only the coefficients above the threshold were kept.
Finally, the filtered signal was constructed by apply-
ing an inverse wavelet transform, and peak detection
was performed. The inputs parameters were the num-
ber of sets and the selected ones for filtering. Equally,
the prominence parameter and a threshold value were
required.
2.3.4 Generalized Likelihood Ratio Statistical
Test
This algorithm (further referred to as GLR) aims
at discerning between baseline noise and electro-
physiological activity using a model-based approach.
The Generalized Likelihood Ratio Test (GLR) as de-
scribed in (Mansouri et al., 2018) was used to com-
pare the goodness of fit of observed data against a sta-
tistical model of noise, thus helping detect changes in
a signal and make decisions. The GLR method calcu-
lated a ratio of likelihoods between a target hypothe-
sis (e.g., presence of a SP) and a reference hypothesis
(e.g., baseline condition). This ratio served as a sta-
tistical test, indicating how well the data aligned with
one hypothesis over another. Applying a threshold on
this ratio signal yielded a SP detection index. This
technique required a calibration phase (performed in
the absence of electrophysiological signals, ie. in-
hibitory conditions for the islets), a detection thresh-
old parameter, and an observation window to perform
the GLR. Before processing, signals were filtered us-
ing a Butterworth bandpass filter (0.2 Hz, 1
st
order to
2 Hz, 2
nd
order).
2.3.5 Online Frequency Analysis
This last approach (further referred to as FFT) does
not focus on event detection but rather aims at directly
assessing signal frequency. To that end, a Fast Fourier
Transform (FFT) algorithm was used with a 30 s slid-
ing window and a 1 s step. An adaptive threshold
was set according to a fraction of signal energy over
the observation window, and peaks in FFT coeffi-
cients were detected when they exceeded that thresh-
old. The frequency returned by the algorithm was the
weighted average of the detected peaks in each obser-
vation window. Before computing FFT signals were
filtered using a Butterworth bandpass filter (0.2 Hz,
1
st
order to 2 Hz, 2
nd
order).
2.4 Benchmarking
2.4.1 Performance Evaluation Metrics
Two distinct metrics were employed to evaluate the
algorithms performances.
• Root Mean Square error (RMS): RMS error testi-
fies for the difference between a model and an ob-
servation. RMS error was calculated as the square
root of the mean of the squares of the differences
between predicted values and observed values.
• Maximum of cross correlation: Cross correla-
tion is a measure of similarity of two series, as
a function of the displacement of one relative to
the other. Cross correlation was computed us-
ing Numpy 1.24.1 then the maximum value was
taken.
2.4.2 Test Scenarios
Detection algorithms were benchmarked across sev-
eral test scenarios, to account for the inherent sig-
Comparative Study of Data Processing Techniques for Pancreatic Islets in Organ-on-Chip Applications
959
nal processing difficulties encountered in electropysi-
ological signals recorded in microphysiological sys-
tems. First, synthetic signals mimicking the prop-
erties of electrophysiological data were used as test
inputs : as the frequency of the test signal was well
defined for each instant, it could be compared to mea-
sured outputs. The test signal consisted in a sine mod-
ulated in frequency and amplitude within the physio-
logical range of the signal (ie. modulated frequency
from 0.2 to 1.2 Hz and amplitudes between 5 to
30 µV ) and reproducing the alternating silent/active
phases. Gaussian white noise was added (SNR ∼
5 dB) to mimic measurement noise.
Parametric Study of Detection Parameters. The
sensitivity and variability of measured outputs in re-
sponse to changes in measurement parameters was
evaluated in a parametric study of their detection pa-
rameters. First, a preliminary parameter space study
was conducted to evaluate the settings leading to best
detection performance. Then, the most influential pa-
rameter (event-based methods FP, RT, DWT, GLR :
the detection threshold ; frequency-base method FFT
: the adaptive threshold) was systematically varied in
a defined range (0.1 to 10 times) around its point of
best performance. This study aimed at highlighting
the immunity, or lack thereof, of the benchmarked al-
gorithms to their detection parameters in an effort to
minimize biases caused by algorithm configuration.
Parametric Analyses on Signal-to-Noise Ratio.
To study the behaviour of the tested algorithms as the
signal-to-noise ratio (SNR) deteriorates, a parametric
study was conducted with added white noise, for a
SNR ranging from 45dB to -10dB. The white noise
applied during this study replaces the Gaussian white
noise originally set in the test scenario.
Validation Study. Finally, all algorithms were
tested on electrophysiological recordings of pancre-
atic islets, to account for experimental and biological
variability. To provide a reference for performance
evaluation, recorded signals were manually annotated
with SP events and converted to a reference signal de-
scribing the expected frequency measurements. Fur-
thermore, to emulate increasingly poor recording con-
ditions and monitor detection performance loss, a
parametric study was again done with added white
noise of increasing intensity (SNR from 40 to 0 dB).
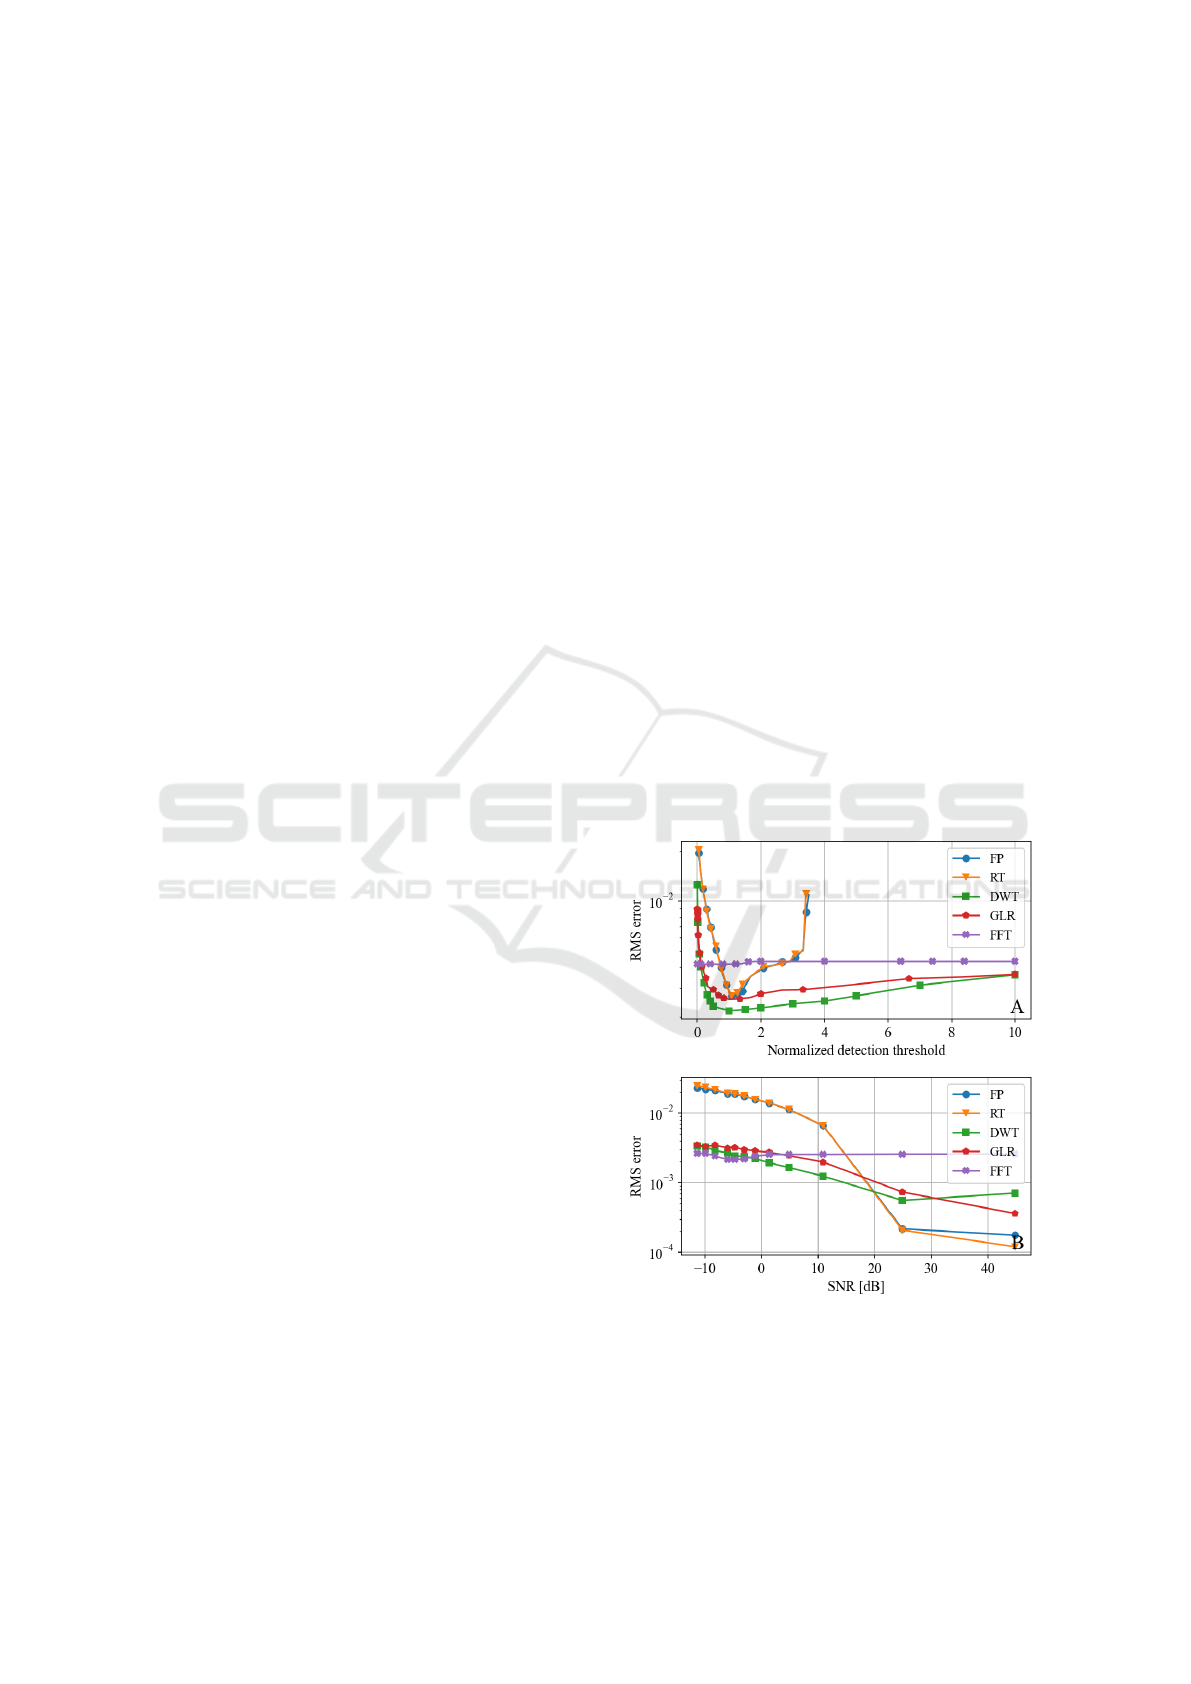
3 RESULTS
3.1 Parametric Study on Synthetic Data
The robustness of each algorithm against noise and
biological variability was evaluated by adjusting their
most sensitive parameter: the detection threshold.
Fig. 2.A highlights the detection performance when
tuning this parameter. The prominence-based algo-
rithms RT and FP yielded low error when the thresh-
old parameter was properly tuned, but were highly
sensitive to its variations. Indeed, false detections
abruptly occured when small variations were applied
to the detection threshold. FFT exhibited lower per-
formance but demonstrated very strong resilience to
variations in the threshold parameter, as performance
indicators remained almost constant regardless of the
threshold value. On the other hand, DWT and GLR
consistently delivered low error rates when compared
to the other algorithms, and maintained excellent per-
formance across a broad range of threshold values.
Fig 2.B reports the influence of noise on detection
performance. Results are consistant with Fig 2.A as
the FP and RT algorithms showed high sensitivity to
noise contrarily to FFT that showed very little pertur-
bation. GLR and DWT still performed better than FP
and RT at low SNR but were less robust than FFT.
Figure 2: Evaluation of the algorithms (FO, RT, DWT,
GLR, FFT) on synthetic signals. (A) Parametric analysis on
the detection threshold (detection threshold was normalized
according to ∆/∆
0
where ∆
0
is the threshold at best perfor-
mance and ∆ the threshold). (B) Parametric analysis on the
test signal SNR.
BIOSIGNALS 2025 - 18th International Conference on Bio-inspired Systems and Signal Processing
960
3.2 Parametric Study on Recorded Data
Next, the same technique was applied to recorded
electrophysiological data. Recorded signals were
manually annotated with SP events to serve as a ref-
erence for performance evaluation (Fig. 3).
As depicted in Fig. 3, the Fourier transform algo-
rithm (FFT) appeared to be the most robust to noise.
Both peak-finding algorithms (FP and RT) perfor-
mances degraded quickly under higher noise condi-
tions, despite maintaining a good overall correlation
with the reference signal. The GLR algorithm per-
formed the least favorably when compared to FFT and
DWT. DWT showed good error results but exhibited
a slightly lesser correlation fit compared to FFT.
Figure 3: Evaluation of the algorithms (FO, RT, DWT,
GLR, FFT) on recorded data with added white noise to
change SNR. (A) RMS error. (B) Maximum of cross-
correlation.
3.3 Validation Study
Finally the algorithms were tested on three recordings
from different experiments and electrodes to account
for the experimental and biological variability.
The overall behaviour of each algorithm matches
the frequency variation of the signal but their perfor-
mance level varies (Fig. 4). The detection follows
the variations in glucose concentration ie the SP fre-
quency increases from 4 to 12 mM and decreases
from 12 to 4 mM. The lesser performance of GLR
can be explained by a poor match between the noise
Figure 4: Comparison of the different algorithmic outputs
to a manually constructed reference signal (both averaged
over a 30 s window). (A) Single channel at constant glu-
cose concentration (11 mM). (B) Average from two chan-
nels with variable glucose level (4 to 12 mM).
hypotheses made and the actual distribution recorded
during the silent phases used for calibration.
4 DISCUSSION
This study offers insights into signal processing ap-
proaches for pancreatic islets in organs-on-chips. Re-
sults in Fig.5 show clear superiority of the FFT algo-
rithm exhibiting lower RMS error and higher correla-
tion with the reference. Performance with GLR was
comparable with other algorithms, provided the noise
model adequately matched the noise distribution of
the experiments, and otherwise declining sharply. FP
and RT showed good performances if correctly tuned
but were highly dependent of SNR shown in Fig. 2
and 3. In comparison DWT filtering showed simi-
lar performances but higher immunity to noise. Nev-
ertheless, the evaluation process on recorded data is
limited by the quality of reference signals. Consid-
ering the complexity and variability of organ-on-chip
devices, generating a reliable gold reference is a sig-
nificant challenge. Fig.5 was obtained using three ref-
erence signals, where SP were hand marked, a com-
mon procedure in electrophysiology. Therefore the
Comparative Study of Data Processing Techniques for Pancreatic Islets in Organ-on-Chip Applications
961

so-called reference can only be used as an indicator
subject to human error and not as an absolute refer-
ence.
Figure 5: Performance evaluation on experimental data
(mean of 3 recordings).
Through this study, we also compared two mea-
surement paradigms, based either on event detec-
tion (FP, RT, DWT and GLR) or frequency detec-
tion (FFT). Each of the tested algorithms employs
a distinct measurement approach : RT and FP are
simple prominence-based detection methods imple-
mented online and offline, respectively; GLRT uti-
lizes a statistical test based on noise characteristics;
DWT is a time-frequency method used as a filter-
ing tool; FFT is a purely frequency-based approach.
These approaches have specific advantages and draw-
backs. RT and FP offer excellent temporal resolu-
tion, dynamics, and computational efficiency but ex-
hibit poor robustness to noise and parameter changes.
GLRT is more reliable than FP and RT provided
that the excluded noise has Gaussian characteristics.
DWT filtering presents a good trade-off between tem-
poral resolution and performance; however, it still re-
quires fine tuning relative to the signal. Finally, FFT
consistently shows good performance : the sliding
window implemented within the FFT approach re-
duces sensitivity to isolated noise events, as the anal-
ysis is performed over a window of samples rather
than a single point. However this robustness comes
at the expense of poor dynamics and temporal reso-
lution, and therefore does not perform optimally dur-
ing transient states. Another benefit of this algorithm
is the weighted average of frequencies performed af-
ter the fft algorithm, which may be more relevant
than threshold-based approaches. Indeed, SPs likely
comprise multiple electrophysiological couplings at
slightly different frequencies. To that extent, while
event-based methods showed excellent performance,
the frequency-based method may reveal supplemen-
tary information; indeed, islet behaviour result from
multiple beta cell signals forming clusters of activa-
tion (Luchetti et al., 2023)(Jaffredo et al., 2018), with
periodic behaviours well suited to frequency analy-
sis. A frequency-based approach giving insight on the
frequency spread of a signal rather than a single fre-
quency measurement may thus be especially relevant
to fully characterize islet behavior.
ACKNOWLEDGEMENTS
We thank David Henry for his assistance with the
GLRT algorithm and Julien Gaitan for his help in bi-
ological experiments. This work was funded by the
ANR FUN-NET (ANR-21-CE14-0078) and the ANR
DIAMOCHIP (ANR-22-CE19-0032-05).
REFERENCES
Abarkan, M., Pirog, A., Mafilaza, D., Pathak, G., et al.
(2022). Vertical organic electrochemical transistors
and electronics for low amplitude micro-organ sig-
nals. Advanced Science, 9(8):2105211.
Clapp, N., Amour, A., Rowan, W. C., and Candarlioglu,
P. L. (2021). Organ-on-chip applications in drug dis-
covery: an end user perspective. Biochemical Society
Transactions, 49(4):1881–1890.
Fuchs, S., Johansson, S., Tjell, A.Ø., Werr, G., Mayr, T.,
and Tenje, M. (2021). In-line analysis of organ-on-
chip systems with sensors: Integration, fabrication,
challenges, and potential. ACS Biomaterials Science
& Engineering, 7(7):2926–2948. PMID: 34133114.
Jaffredo, M., Bertin, E., Pirog, A., Puginier, E., Gaitan, J.,
Oucherif, S., Lebreton, F., et al. (2021). Dynamic uni-
and multicellular patterns encode biphasic activity in
pancreatic islets. Diabetes, 70(4):878–888.
Jaffredo, M., Pirog, A., Bertin, E., Catargi, B., Renaud,
S., Lang, J., and Raoux, M. (2018). Differential beta
cell coupling patterns drive biphasic activity. In 54th
EASD Annual Meeting of the European Association
for the Study of Diabetes, volume 61, pages S17–S18.
Lebreton, F., Pirog, A., Belouah, I., Bosco, D., Berney, T.,
Meda, P., Bornat, Y., Catargi, B., Renaud, S., Raoux,
M., et al. (2015). Slow potentials encode intercellular
coupling and insulin demand in pancreatic beta cells.
Diabetologia, 58:1291–1299.
Luchetti, N., Filippi, S., and Loppini, A. (2023). Multilevel
synchronization of human β-cells networks. Frontiers
in Network Physiology, 3.
Mansouri, M., Baklouti, R., Harkat, M. F., et al. (2018).
Kernel generalized likelihood ratio test for fault de-
tection of biological systems. IEEE Transactions on
NanoBioscience, 17(4):498–506.
Mastrangeli, M., Millet, S., the ORCHID partners, and van
den Eijnden-van Raaij, J. (2019). Organ-on-chip in
development:towards a roadmap for organs-on-chip.
Preprints.
BIOSIGNALS 2025 - 18th International Conference on Bio-inspired Systems and Signal Processing
962

Moya, A., Ortega-Ribera, M., Guimer
`
a, X., Sowade, E.,
Zea, M., Illa, X., et al. (2018). Online oxygen mon-
itoring using integrated inkjet-printed sensors in a
liver-on-a-chip system. Lab on a Chip, 18(14):2023–
2035.
Pirog, A., Bornat, Y., Perrier, R., Raoux, M., Jaffredo, M.,
Quotb, A., Lang, J., Lewis, N., and Renaud, S. (2018).
Multimed: An integrated, multi-application platform
for the real-time recording and sub-millisecond pro-
cessing of biosignals. Sensors, 18(7):2099.
Unser, M. and Aldroubi, A. (1996). A review of wavelets
in biomedical applications. Proceedings of the IEEE,
84(4):626–638.
Wikswo, J. P., Block III, F. E., Cliffel, D. E., Goodwin,
C. R., Marasco, C. C., Markov, D. A., McLean, D. L.,
and others. (2013). Engineering challenges for instru-
menting and controlling integrated organ-on-chip sys-
tems. IEEE Transactions on Biomedical Engineering,
60(3):682–690.
Comparative Study of Data Processing Techniques for Pancreatic Islets in Organ-on-Chip Applications
963
