
Electroencephalograph Based Emotion Estimation
Using Multidimensional Directed Coherence and Neural Networks
Under Noise
Haruka Torii
1,2 a
, Takamasa Shimada
3
, Osamu Sakata
4
and Tadanori Fukami
5
1
Tokyo Denki University, 5, Senjuasahi-cho, Adachi-ku, Tokyo, 120-0026 Japan
2
Oki Electric Industry Co., Ltd. 1-16-8, Chuo, Warabi-shi, Saitama, 335-8510 Japan
3
Tokyo Denki University, 5, Senjuasahi-cho, Adachi-ku, Tokyo, 120-0026 Japan
4
Tokyo University of Science 6-3-1 Niijuku, Katsushika-ku, Tokyo 125-8585 Japan
5
Yamagata University, 4-3-16 Jonan, Yonezawa-shi, Yamagata, 992-8510 Japan
Keywords: Emotion Estimation, Electroencephalography (EEG), Multidimensional Directed Coherence, Neural Network
(NN), White Noise, Pink Noise.
Abstract: In recent years, research focused on emotion based on brain activity has yielded significant insights into the
mechanisms of information processing in the brain. Leveraging this knowledge, studies have increasingly
examined the effects of various stimuli on human emotions, with applications progressing in fields such as
neuromarketing. However, existing methods for emotion estimation from EEG—such as those using power
spectra, correlations, or deep learning—face challenges in generalizability due to considerable individual
differences. In this study, we applied multidimensional directed coherence analysis, which can analyze the
flow of information in the brain, to the measured EEG data. Following this, we trained a neural network using
data augmented with noise to simulate individual differences, proposing a method capable of generalizable
emotion inference. As a result, we achieved an average accuracy rate of 99.91% on training data and 90.83%
on test data.
1 INTRODUCTION
Emotion plays a crucial role in human decision-
making and social behavior, drawing increasing
attention to the relationship between emotion and the
brain, particularly in neuroengineering. This topic is
considered highly significant, as understanding the
connection between emotion and brain activity is
expected to yield applications in fields such as brain-
computer interfaces (BCI) and neuromarketing.
The relationship between brain activity and
emotion has been explored extensively through fMRI
studies. For example, Papez et al. examined the link
between human emotions and hippocampal activity
(Papez, 1937). Irwin conducted functional magnetic
resonance imaging (fMRI) studies and documented
amygdala activation at both poles in response to
specific stimuli (Irwin et al., 1996). George used
positron emission tomography (PET) on individuals
experiencing sadness and happiness (George et al.,
a
https://orcid.org/0009-0007-6668-6075
1995). Findings indicated marked activation in the
limbic system and brainstem during sadness, while no
similar increase in brain activity was found during
happiness. Fisher identified the activation of the
amygdala and hippocampus when subjects viewed
faces depicting fear. These studies highlight the
association between certain brain regions and specific
emotions (Fischer et al., 2003). Another study
assessed brain activity across various emotional states
in response to diverse facial and background images
(Shimada et al., 2009). However, due to the high cost
of fMRI, it is challenging to apply it extensively in
emotion-related brain activity studies across various
fields.
Therefore, electroencephalography (EEG) is
widely used as a more economical approach for brain
activity measurement, particularly in areas such as
psychiatry. EEG thus offers significant advantages
for studying brain activity related to a range of
emotions.
Torii, H., Shimada, T., Sakata, O. and Fukami, T.
Electroencephalograph Based Emotion Estimation Using Multidimensional Directed Coherence and Neural Networks Under Noise.
DOI: 10.5220/0013256000003911
Paper published under CC license (CC BY-NC-ND 4.0)
In Proceedings of the 18th International Joint Conference on Biomedical Engineering Systems and Technologies (BIOSTEC 2025) - Volume 1, pages 647-654
ISBN: 978-989-758-731-3; ISSN: 2184-4305
Proceedings Copyright © 2025 by SCITEPRESS – Science and Technology Publications, Lda.
647

If emotions can be estimated from brain waves,
this could lead to applications in neuromarketing,
such as product development based on consumers'
unconscious reactions, as well as in safe driving
assistance systems that monitor drivers' emotional
states to help prevent dangerous driving.
Although several studies have reported emotion
classification using EEG, many of them focused on
only 2 to 3 specific emotions (Alarcão & Fonseca,
2019). However, Plutchik previously reported that
human emotions can be expressed through a
combination of 8 basic emotions (Plutchik et al.,
1980). Thus, existing research using brainwave-based
emotion classification has not fully covered this
diverse range of emotions. This study aims to classify
four types of emotional states based on Plutchik's
eight basic emotions.
2 RELATED WORK
There are several challenges in using EEG for
emotion estimation. These include the fact that EEG
is a time-series signal with extensive information,
exhibits significant inter-individual variability, and
lacks clear patterns associated with specific
emotional states. Previous studies have attempted to
capture and classify emotional characteristics in EEG
through signal processing techniques. Common
approaches have relied on power spectral analysis and
electrode correlation information. More recently,
machine learning-based methods have been explored
to automatically extract previously unknown
emotion-related features from EEG signals.
Zheng proposed a method to estimate three
emotional states—positive, negative, and neutral—
using the GSCCA method, which identifies
correlations between electrodes and EEG frequencies
(Zheng, 2017). Li et al. proposed an estimation
method for quantifying happiness and sadness using
CSP and LinearSVM (Li & and Lu, 2009). In their
study, participants were shown facial images
representing specific emotions, and their EEG was
recorded. Emotion estimation with this classifier
achieved an average test accuracy of 93.5%. Saha
reports a method using CNN for emotion estimation
(Saha et al., 2022). However, because DNN-based
emotion estimation algorithms function as black
boxes, they cannot reliably estimate emotion based on
brain activity features identified in EEG and fMRI
studies. This limitation reduces the reliability of
EEG-based emotion estimation.
This study aims to analyze the relationship
between emotion and brain activity using EEG by
combining a signal processing method that visualizes
the correlation and direction of each frequency
between electrodes with a neural network (NN). In a
previous study, we proposed two method using
multidimensional directed coherence analysis to
visualize brain activity from EEG signals (Torii et al.,
2023; Torii et al., 2024). Multidimensional directed
coherence analysis tracks brain activity more
effectively than one-dimensional coherence and was
used to estimate joy, sadness, anger, and surprise.
With the exception of joy, multidimensional
coherence analysis achieved significantly higher
accuracy than one-dimensional coherence analysis,
which does not capture the multidimensional flow of
brain activity.
We extracted frequency and electrode
combinations that showed statistically significant
differences in the small/large relationship of
multidimensional directed coherence values across
emotions. These differences were used as rules for
emotion estimation, termed 'relative emotion rules,' as
detailed in Section 3.2. In the first method, each
extracted relative emotion rule was assigned equal
weight for emotion estimation. However, there are
varying levels of importance among these rules in
accurately estimating emotion.
We then explored a method to enhance accuracy
by focusing on relative emotion rules that are highly
effective for emotion estimation in the second
method. NNs are widely used in various fields to
provide optimal solutions by weighting data
appropriately. Previous research describes a method
for classifying the importance of relative emotion
rules across four emotions—joy, sadness, anger, and
surprise—using NNs.
This study also explored methods to classify four
emotional states—joy, sadness, anger, and surprise—
by combining multidimensional directed coherence
analysis, noise, and NNs. By incorporating noise, we
aimed to represent individual variability in EEG
signals, and by utilizing all values obtained from the
analysis—not just those used in the relative emotion
rule—we sought to extract features that, while not
statistically different, play a crucial role in accurate
emotion estimation.
The contributions of this study are as follows.
First, by combining multidimensional directed
coherence analysis with NNs, we achieved a higher
accuracy rate than previous methods in the test data.
Second, by analyzing the NN weights, we
demonstrated the potential to identify not only areas
with significant differences between emotions but
also subtle features that are important for emotion
classification. This approach, which leverages cost-
BIOINFORMATICS 2025 - 16th International Conference on Bioinformatics Models, Methods and Algorithms
648
effective and widely accessible EEG devices to
enable broader emotion classification, holds potential
for applications in diverse fields such as
neuromarketing, driver assistance, and robotic
collaboration through emotion state inference.
3 PROPOSED METHOD
We have previously reported on methods for
estimating emotion using EEG with
multidimensional directed coherence. In the initial
study, we applied multidimensional directed
coherence analysis to EEG data representing specific
emotional states, extracting statistically distinct
features for each frequency and electrode
combination. These features were termed 'relative
emotion rules, and unknown emotional states were
identified by comparing them with these rules and
employing a majority voting principle.
In the subsequent research, we suggested a
method for evaluating the importance of relative
emotion rules by applying weighting based on a NN,
rather than treating all rules as equal.
In this paper proposes an inference method that
directly applies a NN to the values obtained from
multidimensional directed coherence analysis
without using relative emotion rules. By
incorporating noise to represent individual variability,
we achieved high accuracy.
3.1 Multidimensional Directed
Coherence
First, multidimensional directed coherence analysis is
described (Sakata et al., 1998). Studies using fMRI on
emotion have reported that activity in specific regions
of the brain is associated with specific emotions
(Fischer et al., 2003). Therefore, in this study, a
multidimensional directed coherence analysis was
conducted to visualize information flow, as
considering the source of EEG signals is essential for
accurate emotion estimation. Other analytical
methods do not consider for information flow.
The coherence analysis method in signal
processing explains the level of coherence between
two time-series signals x(t) and y(t) (whether they are
in phase or correlated). Furthermore, the directed
coherence analysis method can be used to determine
the direction of coherence.
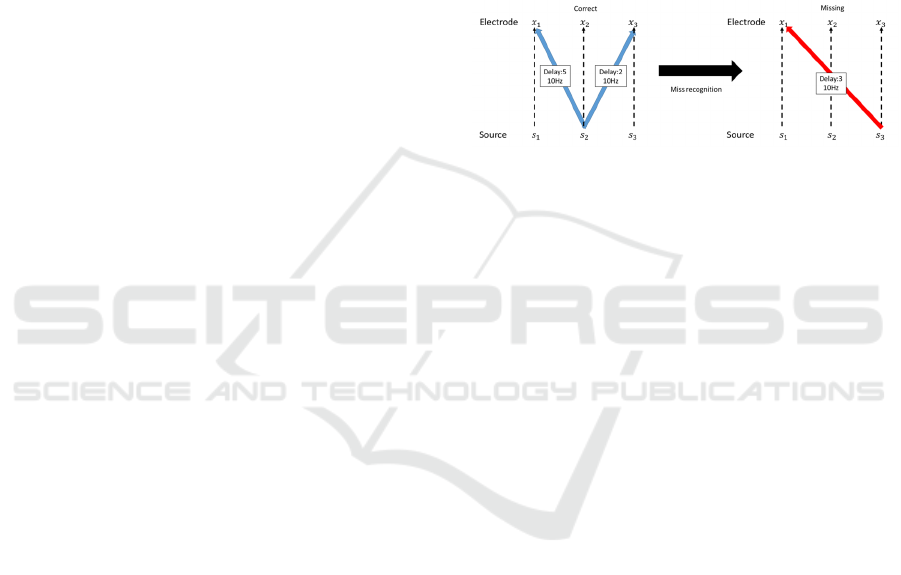
Multidimensional directed coherence analysis is
an extension of directed coherence analysis.
Multidimensional directed coherence analysis
estimates the direction of signal propagation at a
specific frequency between electrodes, assuming both
immediate, delay-free signals from sources near the
electrode where the EEG is measured and delayed,
attenuated signals from sources near other electrodes.
Directed coherence analysis, which takes into account
only signal propagation between two electrodes, can
incorrectly indicate apparent signal flow, such as a 10
Hz flow between electrodes x
and x
, as illustrated
in
Figure 1
(Kamitake et al., 1982). In contrast,
multidimensional directed coherence analysis can
eliminate this apparent signal flow by using phase
information across all electrodes and accounting for
the temporal relationship between them.
Figure 1: Instances of misinterpretation that may arise when
employing directed coherence analysis.
The formula for multidimensional directed
coherence analysis was derived in a previous study
(Sakata et al., 1998). Multidimensional directed
coherence analysis can not only detect the coherency
components that conventional coherence analysis
could detect, but also the temporal backward/forward
relationship among them. This relationship is
interpreted as information flow. Multidimensional
directed coherence is calculated with
multidimensional autoregressive (AR) model
estimation. An AR model regresses the current values
using historical data. Assume that the EEG time series
𝑥
𝑛 is represented by an AR model in Equation (1).
Here, 𝛼 is the AR coefficient, 𝛽 is the disturbance,
and 𝑀 is the AR order.
𝑥
𝛼
𝑥
𝛽𝜔
(1)
Let 𝐴
and 𝑏
be the AR coefficients for the
signal between electrodes 𝑖 and 𝑗 obtained by Fourier
transforming both sides of equation (1) and predictive
residual, respectively. Let the number of electrodes
for measuring EEG be k, frequency be f, white noise
with zero means and one variance be 𝜔
, power
spectrum at electrode 𝑖 be 𝑃
𝑓
, and cross-spectrum
between signals obtained from electrodes 𝑖 and 𝑗 be
𝑃
𝑓
. In this study, γ
𝑓 is the multidimensional
directed cross-spectrum and is defined in equation
(2). Furthermore, the multidimensional directed
Electroencephalograph Based Emotion Estimation Using Multidimensional Directed Coherence and Neural Networks Under Noise
649

coherence between measurement electrodes i and j
can be expressed as γ
𝑓
, where the direction of
information flow indicated by the multidimensional
directed coherence is 𝑥
→𝑥
.
𝛾
𝑓
𝑃
𝑓
𝑃
𝑓
⋅𝑃
A
𝑓
⋅𝑏
𝑃
𝑓
𝑖,
𝑗
1,2,⋅⋅⋅ ,𝑘
(2)
3.2 Relative Emotion Rules
For the selected EEG, the multidimensional directed
coherence analysis described in 3.1 was applied to
obtain the correlation and direction of information
flow (information flow in the brain) for each
combination of electrodes and each frequency.
Figure
2
displays the shape of analyzed data. The vertical
axis represents a combination of electrodes, and the
horizontal axis represents frequencies from 0 to 40.48
Hz. The number of subjects is represented in the
depth direction. Analysis data is obtained for all
subjects and each emotion. These data were divided
into training data to create an emotion estimation
algorithm and test data to verify the accuracy of
emotion estimation.
In the context of two emotions, if Welch’s t-test
at a significance level of 5% reveals a significant
difference in the mean values of multidimensional
directed coherence for each emotion at a certain
frequency for a specific combination of electrodes,
then a significant difference can occur in the amount
of information flow within the brain between the two
emotions for that electrode combination and
frequency.
We used this difference in significant information
flow between emotions (relative emotion rule) for
estimating emotions. All emotion combinations,
electrode combinations, and frequency patterns were
examined to obtain relative emotion rules.
3.3 Proposed Method
This section explains the conventional emotion
estimation method based on the relative emotion rules
established in Section 3.2, and compares it with the
proposed method, which does not rely on relative
emotion rules.
First, we describe the conventional method. Using
the EEG of a specific emotion in the training data, we
obtained the distribution of values of multi-
Figure 2: Shape of analyzed data using multidimensional
directed coherence.
dimensional directed coherence for a specific
combination of electrodes at a specific frequency,
which was approximated by a normal distribution.
Next, when estimating the emotion, the normal
distribution was compared with the test data for
which the emotion was unknown. When the value
obtained by integrating the probability density
function of the normal distribution from ∞ to the
value of multidimensional directed coherence of the
test data was larger than a predetermined smaller
percentage (discrimination threshold), the value is
determined to be considerably larger than the
distribution of directed coherence values of the
specific emotion. By, contrast, when the value
obtained by integrating the probability density
function of the normal distribution from -∞ to the
value of multidimensional directed coherence of the
test data was smaller than the discrimination
threshold, the value is determined to be considerably
smaller than the distribution of directed coherence
values of the specific emotion.
Based on the large/small relationship with the
specific emotion of the obtained training data, a
relative emotion rule was extracted for which this
large/small relationship was consistent. The relative
emotion rule indicates the large/small relationship of
values between two emotions, one of which was set
to a specific emotion of the training data such that the
other emotion can be inferred to be the emotion of the
test data. This procedure was performed for all
electrode combinations and frequencies, and the
emotion of the test data inferred from all extracted
relative emotion rules was used to determine the most
plausible emotion based on the principle of majority
rule voting, resulting in the final emotion estimation.
Figure 3 displays the flow of emotion estimation as
“Previous Method 1”.
The second method is shown as "Previous Method
2" in Figure 3. This method based on the large/small
relationship obtained by comparing testing data and
discrimination threshold, 1 was set when this
large/small relationship matched the relative emotion
BIOINFORMATICS 2025 - 16th International Conference on Bioinformatics Models, Methods and Algorithms
650

Figure 3: Estimation process of the two preceding methods and the proposed method.
rule and 0 when this condition was not satisfied.These
results were used as input data to estimate the
emotions using a NN. Using an NN, the rules are not
treated in the same rank when estimating each
emotion. However, the values are adjusted using the
weight coefficients. Larger coefficients can be
applied to rules that are more important for estimating
emotion, and smaller coefficients can be applied to
less important rules, allowing estimation to be
performed with sorting of rules.
The proposed method is shown in Figure 3 as
"Proposed Method". Two types of data are prepared:
data obtained after multidimensional directed
coherence analysis and data with added noise post-
analysis. These two datasets are shuffled and divided
into training and test data. Next, the two-dimensional
post-analysis data are converted into one-dimensional
data, and all values obtained from the analysis are
used as input data for the NN.
The NNs used in both the previous method 2 and
the proposed method were simple, consisting of only
two layers: an input layer and an output layer. We
used stochastic gradient descent (SGD) as the
optimizer, Softmax as the activation function, and
CrossEntropyLoss as the loss function. We stopped
the training when the loss stopped decreasing to avoid
overfitting.
4 EXPERIMENTS
The proposed method in this paper aims to evaluate a
broader range of emotions based on Plutchik's basic
emotions. Publicly available datasets did not include
emotions comparable to those targeted by this
method; therefore, specific emotional states were
generated using images based on techniques from
previous studies. (Torii, 2023).
Informed consent was obtained from the
participants regarding the purpose of the experiment
and the risks associated with participation in the
experiment by procedures approved by the Bioethics
Committee for Human Life at Tokyo Denki
University. Furthermore, their written consent was
obtained for participation.
EEG measurements were performed within 1 min
of image presentation. The electrode arrangement
was based on the international 10–20 method, and the
unipolar derivation method was used with the average
of the two earlobe electrodes as the reference
electrode. The measured data were digitized and
recorded at a sampling frequency of 200 Hz. The
measured EEG data were pre-processed using a high-
pass filter with a cutoff frequency of 0.5 Hz, and a
low-pass filter with a cutoff frequency of 60 Hz. EEG
data was measured at Fp1, Fp2, F3, F4, P3, P4, T3,
T4, O1, and O2 using the average potential of
earlobes A1 and A2 as a reference. During the
measurements, the participants were instructed to
minimize body movements and blinking. However, if
a significant artifact was detected, the measurements
were repeated. The subjects included 30 healthy
individuals, comprising 23 males and 7 females, with
an average age of 21.9 years (±1.57).
EEG data from the subsequent 20 s (from the 40th
to the 60th second) of the 1 min of the measured data
were used as EEG data.
In the analysis, 8096 frequencies, from 0 to 40.48
Hz at 0.005 Hz intervals were used. Two electrodes
were selected from 10 electrodes. Then, a total of 90
combinations of electrodes were evaluated.
Electroencephalograph Based Emotion Estimation Using Multidimensional Directed Coherence and Neural Networks Under Noise
651
To validate the proposed method, we compared
emotion estimation using relative emotion rules with
a method that generates relative emotion rules
through coherence analysis, which visualizes the
actual correlations between electrodes, rather than
using multidimensional directed coherence analysis.
The data used to create the relative emotion rules
and train the NN were designated as training data, and
the data that were not used were designated as test
data.
5 RESULTS
The dataset for training the neural networks (NNs)
was split into training (90%) and test (10%) sets,
using 10-fold cross-validation. Emotion estimation
was performed on both sets in each fold, and the
average accuracy was computed over 10 folds.
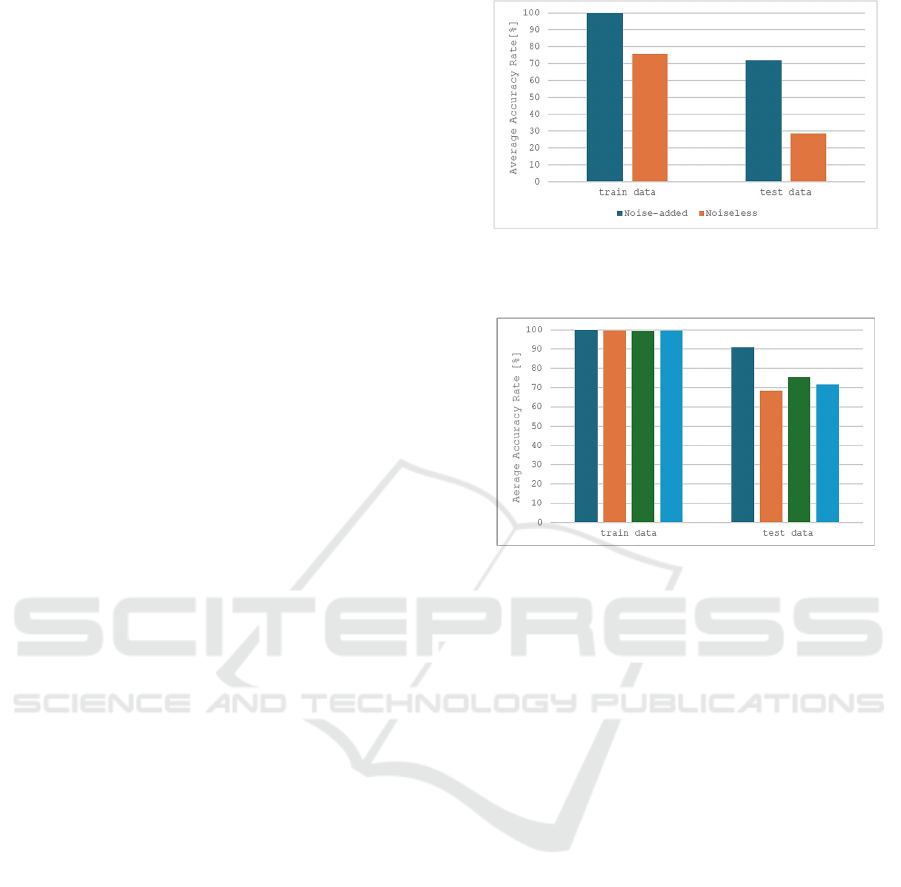
Figure
4
shows results of NN training and inference using
noiseless data from multidimensional directed
coherence analysis of EEG signals, as well as results
when combining this data with noise-augmented data.
White noise (mean: 0, variance: 1) was used as the
noise source. Training with only noiseless data
achieved average accuracies of 75.68% (±10.16) for
training and 28.33% (±10.67) for test sets. When
noiseless data was combined with noise-augmented
data, accuracies improved to 99.82% (±0.41) for
training and 71.67% (±5.20) for test sets, showing
noise addition enhances test accuracy.
Subsequently, different types of noise were
introduced to examine their effects on training and
inference performance. Unlike white noise, which has
a uniform power spectrum across all frequencies,
pink noise has higher power in low-frequency
components, with power spectral density decreasing
as frequency increases. The noise types used are as
follows:
White Noise (mean: 0, variance: 0.1)
White Noise (mean: 0, variance: 0.01)
Pink Noise
Figure 5
shows the results of adding these noise
types to the training data. With white noise (variance
0.1), the average accuracy was 99.49% (±0.73) for
training and 75.42% (±5.09) for test data. For white
noise (variance 0.01), training accuracy increased to
99.73% (±0.46), while test accuracy dropped to
68.33% (±6.77). Pink noise achieved the highest
accuracy rates, with 99.91% (±0.18) for training data
and 90.83% (±4.86) for test data. Among the tested
noise types, pink noise provided the best overall
performance.
Figure 4: Average accuracy rate of the proposed method
with noise and noiseless conditions.
Figure 5: Comparison using pink noise and white noise with
varying levels of variance is presented as follows: Blue:
pink noise, Orange: white noise with a variance of 0.01,
Green: white noise with a variance of 0.1, Cyan: white noise
with a variance of 1.
To confirm whether the proposed method
captures essential features for emotion representation
better than statistically significant relative emotion
rules, we compared several approaches: using only
the relative emotion rule (previous method 1),
combining the rule with NNs (previous method 2),
and coherence-based methods without considering
multidimensional flow.
Figure 6
shows the estimation
results. For the proposed method, we used pink noise,
as it demonstrated the highest accuracy rate.
The average accuracy rates for the previous
method 2 were 95.06% (±2.77) for training and
41.44% (±3.98) for test data, while for previous
method 1, they were 58.51% (±4.86) and 31.07%
(±3.42), respectively. The conventional coherence
analysis method with relative emotion rules yielded
accuracies of 45.95% (±2.81) for training and 37.98%
(±3.42) for test data.
Previous method 2 uses binary values (1 or 0) for
inference, whereas the proposed method incorporates
correlation values from multidimensional directed
coherence analysis. To examine the impact of input
data flexibility, we compared results using only
relative emotion rules with those using correlation
BIOINFORMATICS 2025 - 16th International Conference on Bioinformatics Models, Methods and Algorithms
652
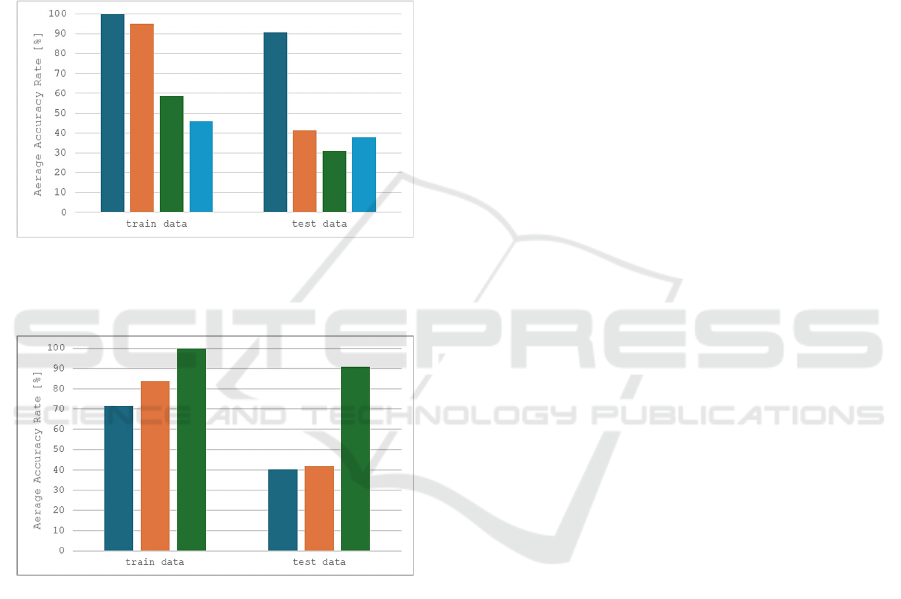
values post-analysis. For matches with the rules, the
correlation values were retained; for mismatches, the
values were set to 0.
Figure 7
shows the results. Using correlation
values for unknown emotions from all electrode
combinations and frequencies in the relative emotion
rules, the average accuracy was 71.31% (±19.13) for
training and 40.12% (±2.25) for test data. When
retaining correlation values for matches with the rules
and setting mismatches to 0, the training accuracy
was 83.57% (±7.78), and the test accuracy was
41.79% (±2.58).
Figure 6: Average accuracy rate: Blue: Proposed method
(pink noise), Orange: Previous method 2, Green: Previous
method 1, Cyan: Using coherence method
Figure 7: Comparison of the average accuracy rates: Blue:
using 0 or correlation values from multidimensional
directed coherence, Orange: using the correlation values
specified in the relative emotion rules, Green: using all the
correlation values.
6 DISCUSSIONS
Comparing the results of applying all correlation
values from multidimensional directed coherence
analysis to the NN showed that adding noise to the
data improved accuracy for both training and test sets
compared to using noiseless data. This improvement
likely stems from the inclusion of noise-augmented
data in the training set, which enhances learning by
better reproducing regions with significant individual
differences.
Among the four noise types tested, including
white noise with a mean of 0 and variance of 1, no
notable differences were observed in training
accuracy. However, in the test data, pink noise
improved accuracy by approximately 10% compared
to white noise conditions. This suggests that
individual differences are more concentrated in low-
frequency components than distributed across the
frequency spectrum.
In addition to pink and white noise, other colored
noises such as brown, blue, and violet noise were also
evaluated. Their definitions are based on Beran et al.
(2013) and Kasdin and N.J. (1995). When applied,
these noises resulted in lower test accuracies than
white noise.
Blue and violet noise increase power in high-
frequency components, which do not effectively
represent individual differences occurring in lower
frequencies. Brown noise, while similar to pink noise
in emphasizing low-frequency components, exhibits
a steep power decline at higher frequencies, limiting
its ability to retain necessary high-frequency
information. This limitation likely explains why
brown noise did not achieve the same performance as
pink noise.
These findings suggest that low-frequency noise
is critical for reproducing individual differences and
improving test accuracy, while specific high-
frequency components are also necessary. Pink noise,
which satisfies both conditions, is particularly
effective in capturing individual variability.
A comparison between the proposed method and
three conventional methods based on the relative
emotion rule showed that the proposed method
achieved the highest accuracy for both training and test
data. This suggests that incorporating noise during
training not only replicates individual differences but
also highlights subtle, non-statistically distinct features
essential for emotion differentiation.
Additionally, the proposed method was compared
to two other cases: one using only values from the
conditions recorded in the relative emotion rule, and
another assigning a value of 0 when the rule
conditions did not match the test data. The proposed
method, which used all correlation values,
outperformed both, achieving the highest accuracy
for training and test data. This result suggest that
using correlation values enhances the NN's flexibility
during training and enables the extraction of features
that, while not recorded in the relative emotion rule
or statistically distinct, are crucial for accurate
emotion estimation.
Electroencephalograph Based Emotion Estimation Using Multidimensional Directed Coherence and Neural Networks Under Noise
653

7 CONCLUSIONS
In this study, we propose an EEG-based method for
emotion estimation, where EEG data with and
without added noise are processed through
multidimensional directed coherence analysis and
then used to train a NN. Conventional methods have
relied on features with statistically significant
differences among emotions for estimation. In
contrast, our proposed method utilizes all data from
the coherence analysis, allowing the NN to identify
important features for emotion estimation even if
statistical differences between emotions are absent.
By incorporating noise to account for individual
differences, we aimed to capture more generalized
features.
The results show that training with noise-added
data achieved higher accuracy than methods without
noise or those based solely on the relative emotion
rule. Among the four noise types tested, pink noise
yielded the highest accuracy, suggesting its
effectiveness in representing individual differences.
Future work will focus on understanding the
relationship between brain activity and emotion by
analyzing information flow and frequency between
electrodes through NN weight analysis. This will help
identify key features for emotion discrimination, even
in the absence of statistical differences. Additionally,
comparisons with other NN-based methods will be
conducted to further evaluate the effectiveness of the
proposed approach.
REFERENCES
J. W. Papez (1937). A proposed mechanism of emotion.
Arch. Neurol. Psychiatry. 79. 217-224.
doi:/10.1001/archneurpsyc.1937.02260220069003
W. Irwin, R. J. Davidson, M. J. Lowe, B. J. Mock, J. A.
Sorenson, and P. A. Turski (1996). Human amygdala
activation detected with echo-planar functional
magnetic resonance imaging. Neuroreport, 7. 1765–
1769. doi:/10.1097/00001756-199607290-00014
M. S. George, T. A. Ketter, P. I. Parekh, B. Horwitz, P.
Herscovitch, and R. M. Post (1995). Brain activation
during transient sadness and happiness in healthy
women. Am. J. Psychiatr, 152, 341-351.
doi:10.1176/ajp.152.3.341
H. Fischer, C. L. Wright, P. J. Whalen, S. C. Mclnerney, L.
M. Shin, and S. L. Rauch (2003). Brain habituation
during repeated exposure to fearful and neutral faces: a
functional MRI study. Brain Res. Bull. 59. 387-392.
doi:10.1016/s0361-9230(02)00940-1
T. Shimada, T. Fukami, and Y. Saito (2009), Brain
activation in response to face images with backgrounds.
Int. J. Innov. Comput. Inf. Control. 5(3). 589-600.
doi:10.1007/978-3-540-36841-0_640
Soraia M. Alarcão and Manuel J. Fonseca (2019). Emotions
Recognition Using EEG Signals: A Survey. IEEE
Transaztions on Affective Computing. 10(3). July-
September. doi:10.1109/TAFFC.2017.2714671
R. Plutchik and H. Kellerman (1980). EMOTION Theory.
Research. and Experience. 3-33, ACADEMIC PRESS.
https://www.amazon.co.jp/Emotion-Research-
Experience-Robert-Plutchik/dp/0125587015
W.Zheng (2017). Multichannel EEG-Based Emotion
Recognition via Group Sparse Canonical Correlation
Analysis. IEEE Transactions on Cognitive and
Developmental Systems. 9(3). 281-290. doi:10.1109/
TCDS.2016.2587290
M. Li and B.-L. Lu (2009). Emotion classification based on
gamma band EEG. Proc. Annu. Int. Conf. IEEE Eng.
Med. Biology Soc.. 1223-1226, Minneapolis.
doi:10.1109/IEMBS.2009.5334139
O. Saha, M.S. Mahmud, S.A. Fattah, M. Saquib (2022).
Automatic Emotion Recognition from Multi-Band EEG
Data Based on a Deep Learning Scheme with Effective
Channel Attention. IEEE Access. doi:10.1109/
ACCESS.2022.3224725
H. Torii, T. Shimada, O. Sakata, and T. Fukami (2023).
Emotion estimation by EEG using multidimensional
directed coherence analysis. Inst. Electron. Inform.
Comm. Eng.. J-106-D(6). 401-408. https://search.ieice.
org/bin/summary.php?id=j106-d_6_401&category=D
&year=2023&lang=2&abst=j
H. Torii, T. Shimada, O. Sakata, and T. Fukami (2024).
Emotion Estimation Using Signal Processing and
Neural Network by EEG. In The International Council
on Electrical Engineering Conference 2024.
Kitakyushu. https://orbit-cs.net/icee2024/detailedprogr
am.pdf
O. Sakata, N. Imanishi, T. Shimada, T. Shiina, and Y. Saito
(1998). Causality analysis of alpha activities by
multidimensional directed coherence. Inst. Electrical
Eng. Jpn C. 118. 1016-1025. doi: 10.1541/ieejeiss198
7.118.7-8_1016
T. Kamitake, H. Harashima, H. Miyakawa and Y. Saito
(1982). Directed Coherence Analysis of Time Series
and Its Application to Biological Signal Processing.
Inst. Electron. Inform. Comm. Eng.. J-65-A(8). 779-786
https://search.ieice.org/bin/summary.php?id=j65-a_8_
779
Beran, J., Y. Feng, S. Ghosh, and R. Kulik (2013). Long-
Memory Processes: Probabilistic Properties and
Statistical Methods. NewYork: Springer. doi:
10.1007/978-3-642-35512-7
Kasdin, N.J. (1995). Discrete Simulation of Colored Noise
and Stochastic Processes and 1/fα Power Law Noise
Generation. Proceedings of the IEEE. 83(5). 802-827.
doi: 10.1109/5.381848
BIOINFORMATICS 2025 - 16th International Conference on Bioinformatics Models, Methods and Algorithms
654
