
CSV: Visual Support for Understanding Card Synergy in
Digital Collectible Card Games
Yicheng Xue
1
and Hiroshi Hosobe
2
1
Graduate School of Computer and Information Sciences, Hosei University, Tokyo, Japan
2
Faculty of Computer and Information Sciences, Hosei University, Tokyo, Japan
Keywords:
Graph Visualization, Video Game, Digital Collectible Card Game.
Abstract:
Digital Collectible Card Games (DCCGs) are a popular genre of video games that typically feature a contin-
uously expanding pool of cards, requiring players to construct their own decks in order to play. However, the
complexity of the game rules and the large number of cards cause information overload, resulting in various
issues. In this research, we propose a framework to help users overcome information overload by providing
a clear visualization of card synergies using 3D graphs. We employ text analysis and the co-occurrence net-
work to calculate synergy scores between cards, and then represent the cards as nodes and their synergies as
edges in our integrative 3D graph. In our experiment, we collected the decks of elite players as our dataset
and visualized the synergies among approximately 1,000 cards in “Yu-Gi-Oh! Master Duel”. To evaluate our
framework, we conducted a questionnaire survey and a usability test with people experienced in playing DC-
CGs. The results indicate that our framework effectively assists users in deck construction and understanding
of the game, and also provide valuable insights for the further development into a full-scale supporting tool.
1 INTRODUCTION
Digital collectible card games (DCCGs) are a popu-
lar genre of video games that typically emulate col-
lectible card games (CCGs, sometimes also known as
trading card games) on digital platforms. Because of
the advantages of being digital, the game mechan-
ics of DCCGs are usually more creative and flexi-
ble. Although traditional CCGs remain very popular,
the popularity of DCCGs has increased significantly
over the past few years, reaching millions of play-
ers around the world. “Hearthstone” and “Magic: The
Gathering” are two famous DCCGs that have been all
the rage in recent years (Turkay and Adinolf, 2018).
DCCGs inherit the characteristics of traditional
CCGs, which require players to build a personalized
deck to engage in turn-based one-versus-one matches.
In the same way as CCGs, deck building and match
gameplay are two key components that constitute the
core experience of DCCGs (e Silva Vieira et al.,
2024). However, DCCGs also inherit some of the is-
sues of CCGs, such as information overload (decision
making challenges due to too much information) and
power creep (updates causing older cards to become
underpowered) (Zuin et al., 2022).
Since the playability of CCGs largely depends on
the variety of cards, both DCCGs and CCGs typi-
cally have a large pool of cards that are frequently
updated. The extensive libraries of available cards,
often numbering in the thousands, can be overwhelm-
ing and confusing for beginners who are not yet fa-
miliar with the games. A case in point is the well-
known title “Yu-Gi-Oh! Master Duel”, which boasts
a card pool that exceeds 10,000 unique cards (Konami
Digital Entertainment, 2021). Although many card
databases offer powerful search functions, inexperi-
enced players may still struggle to identify potential
card combos due to the overwhelming volume of in-
formation, where a combo refers to a sequence of ac-
tions that provides significant benefit. From the per-
spective of game designers, the issue of imbalanced
card designs often arises due to power creep, leading
to a continuous cycle of needing stronger cards to re-
main competitive (Zuin et al., 2022). Even though
game designers utilize mathematical models to main-
tain the balance of card values, the additional effects
resulting from interactions between cards are some-
times overlooked, which can lead to certain cards be-
coming overpowered. To address this issue, designers
often implement a ban list or make direct modifica-
tions to card effects. However, there is still room for
improvement in the evaluation process during the de-
Xue, Y. and Hosobe, H.
CSV: Visual Support for Understanding Card Synergy in Digital Collectible Card Games.
DOI: 10.5220/0013256900003912
Paper published under CC license (CC BY-NC-ND 4.0)
In Proceedings of the 20th International Joint Conference on Computer Vision, Imaging and Computer Graphics Theory and Applications (VISIGRAPP 2025) - Volume 1: GRAPP, HUCAPP
and IVAPP, pages 611-618
ISBN: 978-989-758-728-3; ISSN: 2184-4321
Proceedings Copyright © 2025 by SCITEPRESS – Science and Technology Publications, Lda.
611

sign phase (Zuin et al., 2022; Vieira et al., 2020).
The main approach to addressing these issues typ-
ically involves the use of artificial intelligence (AI)
based on simulated combat data. However, these AI
models are usually black boxes, which means that
users do not significantly deepen their understanding
of the cards or the game. Moreover, due to the com-
plexity of DCCGs, the performance of these AIs still
has considerable room for improvement (Zuin et al.,
2022; Vieira et al., 2020). Since information visual-
ization presents complex data in an intuitive format,
which could reduce information overload and enable
quicker understanding and decision-making, our goal
is to provide visual support based on transparent an-
alytical methods to enhance users’ comprehension of
the game (Strother et al., 2012).
In this research, we introduce a novel framework
designed to visually support users in understanding
card synergies within DCCGs. A card synergy refers
to the strategic interactions between cards that pro-
duce a combined effect greater than their individual
abilities, a core element of gameplay and deck build-
ing (Dockhorn and Mostaghim, 2019). For our re-
search methods, we use the deck data of elite play-
ers as the dataset to calculate synergy scores be-
tween cards based on card effect analysis and the co-
occurrence network technique. We then conceptual-
ize cards as nodes and their quantified synergies as
edges to construct an interactive 3D graph visualiza-
tion. In the end, our results of subjective evaluations
indicate that our visualizations effectively help users
understand the synergy between cards, which demon-
strates the feasibility of this research.
2 RELATED WORK
2.1 Research on CCGs and DCCGs
There is limited research on card synergies and re-
lationships in CCGs and DCCGs. Most studies ad-
dressing challenges in CCGs and DCCGs focus on
training powerful AI. For example, a framework uses
deep learning to recommend resource scaling for bet-
ter game balance (Zuin et al., 2022). It combines
neural networks with gradient-boosted decision trees
to predict card values and employs explanation tools
to help developers understand the factors influenc-
ing these predictions. In the context of AI agents
for CCGs, deep reinforcement learning has been ap-
plied to optimize the drafting process, while neural
networks are used to develop draft agents capable of
building competitive decks (Vieira et al., 2020). Ad-
ditionally, “Q-DeckRec” is a fast deck recommenda-
tion system for CCGs that applies Q-learning to sug-
gest optimal decks based on player preferences and
game state, which significantly enhances the deck-
building experience with quick and personalized rec-
ommendations (Chen et al., 2018). These studies are
part of mainstream research in CCGs, focusing on AI
applications to assist users, with promising results.
However, they provide limited support for our visual-
ization research because of differing perspectives on
problem solving.
2.2 Co-Occurrence Network
Since words in context and cards in DCCGs share
similar properties, we can conceptualize cards and
decks in DCCGs as analogous to words and sen-
tences in linguistic structures. To analyze the relation-
ships among these entities, natural language process-
ing techniques may offer valuable insights for our re-
search. The co-occurrence network is a technique for
text analysis that calculates the co-occurrence of enti-
ties and often utilizes graphic visualization to uncover
potential relationships among entities within written
content. In terms of applications, co-occurrence net-
works have been used to analyze Twitter data from
a sample of 3,000 tweets (Puerta et al., 2020). The
analysis indicates that co-occurrence networks, es-
pecially those from pre-processed text, reveal struc-
tural relevance among terms, offering valuable in-
sights for broader text analysis. Another study ex-
amined political tweets related to Hillary Clinton’s
2016 presidential campaign using co-occurrence net-
works to explore the sentiment and structural proper-
ties of word relationships (Fudolig et al., 2022). By
constructing networks with nodes as words and edges
as co-occurrences, the study illuminates connections
between words and sentiments, and reveals complex
patterns and clusters within the data, which demon-
strates the utility of co-occurrence networks in identi-
fying hidden word relationships. Given its effective-
ness in revealing relationships between entities, we
incorporate co-occurrence network analysis as part of
our methodology to construct a relationship map for
cards in DCCGs.
2.3 3D Force-Directed Graph
Since DCCGs have numerous cards and complex re-
lationships, we seek a visualization method that can
handle large amounts of information. 3D graphs, with
their strong interactivity and intuitive presentation, of-
fer an ideal solution. Among the various types of 3D
graphs, 3D force-directed graphs stand out for their
excellent performance in visualization research. An
HUCAPP 2025 - 9th International Conference on Human Computer Interaction Theory and Applications
612
example of 3D visualization in action is a web-based
tool designed to explore scientific literature in 3D
space (Swacha, 2021). It represents papers as nodes
and citations or co-occurrences as edges, enabling
researchers to analyze complex networks. This ap-
proach enhances the ability to detect relationships and
trends in large datasets, uncovering hidden connec-
tions often missed in 2D visualizations. Furthermore,
some studies have adopted 3D force-directed graphs,
which not only produce clear visuals but also allow
for interactivity. For instance, a study has shown
that integrating geographic constraints with 3D force-
directed layouts significantly enhances the visualiza-
tion of relationships among entities (Wang et al.,
2023). This method enables interactive exploration,
helping users intuitively understand complex patterns
within large datasets. The results of these studies indi-
cate the practicality of using 3D force-directed graphs
for our research. Therefore, we adopt this approach to
visualize the synergies between cards.
3 METHOD
In this study, we employ both text analysis and the
concept of co-occurrence rates as metrics to evaluate
the synergy between cards.
3.1 Synergy Score
First, we provide a brief overview of card character-
istics in DCCGs. Generally, most DCCGs classify
cards into two main types: minion cards and spell
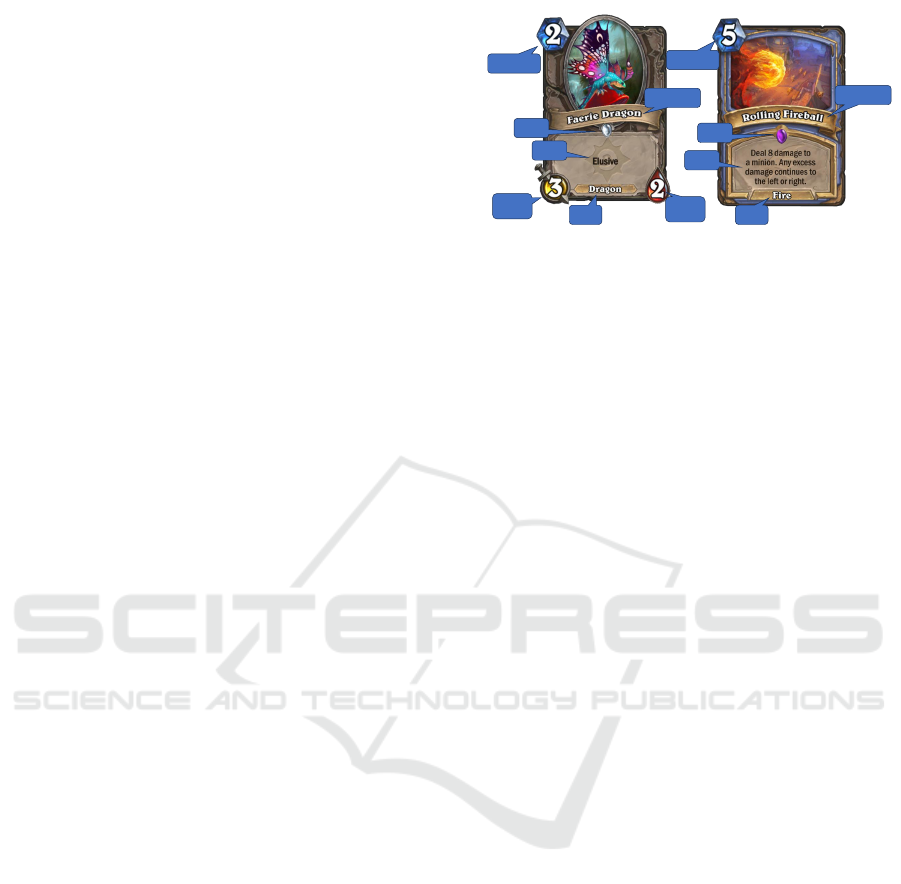
cards. For example, Figure 1 shows a minion card
from the game Hearthstone. A minion card has the
following elements: card name, mana cost, effect,
type, attack points, health points, and rarity. Minion
cards can engage in battles on the game field until they
are defeated, and their effects can sometimes persist
beyond a single turn. A spell card, in contrast, does
not have health or attack points. They are typically
single-use cards with immediate effects (Figure 1).
A card’s defining feature is clearly its effect,
which shapes interactions and synergies with other
cards. Therefore, the most effective way to evaluate
card synergy is by analyzing the text of these effects,
as synergy largely depends on them. Therefore, we
would like to calculate a synergy score based on the
effects between two cards.
However, in practice, many card effects in DCCGs
lack strong connections to other cards. The “Faerie
Dragon” mentioned above is a prime example (Fig-
ure 1). For cards with isolated effects, analyzing syn-
ergy through text alone is challenging. In such cases,
Mana Cost
Mana Cost
Rarity
Card Name
Card Name
Rarity
Effect
Effect
Type Type
Attack
Point
Health
Point
Figure 1: A minion card and a spell card from “Hearth-
stone”.
we can utilize co-occurrence networks to incorporate
player choices as a supplementary analytical method.
Co-occurrence networks could reveal clusters of cards
that frequently appear together, which suggest that
these cards may have strong synergy with each other.
We use the co-occurrence rate between two cards, cal-
culated based on co-occurrence networks, to assist in
calculating the synergy score.
Overall, the synergy score between two cards c
s
and c
t
is calculated based on the following formula:
synergy(c
s
,c
t
) = base(c
s
,c
t
) · cor(c
s
,c
t
)
where base(c
s
,c
t
) represents the basic synergy score,
derived from analyzing the effects and parame-
ters of the two cards, and cor(c
s
,c
t
) represents
the co-occurrence rate, calculated based on the co-
occurrence rate between the two cards. The product
of these two values yields our final synergy score. In
the following sections, we explain how to calculate
these elements.
3.2 Text Analysis
In DCCGs, most cards typically have various pa-
rameters and effects recorded in their text. We ana-
lyze these texts to detect the synergy between cards.
For example, in “Yu-Gi-Oh!”, “Reinforcement of the
Army” (lower in Figure 2) has the effect of adding a
Level 4 or lower Warrior-type monster to the hand,
and “Sky Striker Ace - Raye” (upper in Figure 2)
meets this condition, making it a valid target for the
effect of “Reinforcement of the Army”. Two cards
that can trigger effect interactions will be considered
to have synergy. Moreover, there are various types
of interactions, and the synergy scores we derive will
vary depending on the nature of these interactions.
The synergy score obtained in this way is referred
to as the basic synergy score. The specific calculation
formula is as follows:
base(c
s
,c
t
) = max(w
w
w · σ
σ
σ(c
s
,c
t
),base
min
)
CSV: Visual Support for Understanding Card Synergy in Digital Collectible Card Games
613

Figure 2: A monster card and a spell card from “Yu-Gi-
Oh!”.
where
w
w
w =
w
effect
,w
archetype
,w
material
σ
σ
σ(c
s
,c
t
) =
σ
effect
(c
s
,c
t
),σ
archetype
(c
s
,c
t
),
σ
material
(c
s
,c
t
)]
Vector-valued function σ
σ
σ(c
s
,c
t
) represents the
scores for each evaluation criterion, while vector w
w
w
represents the weights of criteria. Additionally, we
designed base
min
(= 1 by default), which serves as a
safeguard to prevent the basic synergy score between
cards from falling to zero, particularly ensuring that
the synergy between cards frequently used together is
properly evaluated.
Regarding the evaluation criteria, they are catego-
rized into the following types:
• Effect Score σ
effect
(c
s
,c
t
): This is an indicator
function that shows the degree of relevance be-
tween the effects in the text of the two cards. It de-
termines a value based on whether the any card el-
ements (e.g., card name, archetype, attack points,
etc.) is mentioned in the effect text. If the full card
name is mentioned, the value is 2. If the archetype
is mentioned, the value is 1. If other elements are
mentioned, the value is 0.5. Otherwise, it is 0.
• Archetype Score σ
archetype
(c
s
,c
t
): A card may
belong to an archetype (also called a series) that
means a group of cards supported each other.
In “Yu-Gi-Oh!”, cards belonging to an archetype
may contain a common string (e.g., “Blue-Eyes
White Dragon” and “Blue-Eyes Abyss Dragon”)
(Yu-Gi-Oh! Wiki, 2024). In Hearthstone, the
archetype is represented by the card type. These
cards usually support each other by their card
effects. If cards c
s
and c
t
belong to the same
archetype, the value is 1. Otherwise, it is 0.
• Material Dependency Score σ
material
(c
s
,c
t
):
Sometimes, playing a card requires prerequisites.
If card c
t
is specified as a required material for
card c
s
, where a required material refers to any re-
source or condition needed to play or activate a
card, the value is 1. If c
t
meets the conditions to
be used as a material but is not strictly required,
the value is 0.5. Otherwise, it is 0.
Additionally, the calculations for σ
effect
and
σ
material
would be performed twice. The first calcu-
lation is based on the text of the first card, and the
second is based on the text of the second card. Fi-
nally, the two calculated values of such scores would
be summed as the final score.
Next, the following explain the weights of evalua-
tion criteria:
• Effect Weight w
effect
(= 3 by default): This rep-
resents the importance when a card is explicitly
referenced in the effect text. Since this element
indicates a direct interaction between cards, it car-
ries the highest weight.
• Archetype Weight w
archetype
(= 2 by default):
This indicates whether the cards belong to the
same archetype. Since the consistency of the
archetype is important in deck construction, a rel-
atively high weight is assigned to this element.
• Material Dependency Weight w
material
(= 1 by
default): This indicates whether the cards could
serve as required materials to play another card
(such as summoning a minion or casting a spell).
Although some cards rely heavily on specific ma-
terials, this is typically mentioned in the effect
text, or the cards may directly belong to the same
archetype. In most cases, the majority of cards do
not require prerequisites to be played. Therefore,
this weight is assigned a relatively low weight.
3.3 Co-Occurrence Rate
The co-occurrence rate between two cards represents
the frequency at which they appear together in a given
dataset. A high co-occurrence rate may indicate that
players frequently use the two cards together, which
suggests they have complementary effects, form part
of a popular deck archetype, or provide a strong tacti-
cal advantage when combined. Analyzing these rates
could help in understanding card synergies.
In general, we will collect a large dataset of decks
from elite players to analyze the co-occurrence rate
between pairs of cards. We define “co-occurrence” as
the concurrent presence of two cards within the same
deck. The formal definition of the co-occurrence rate
is as follows:
Given cards c
1
,c
2
,...,c
n
and decks
D
1
,D
2
,...,D
m
, where each deck is a multiset
D
j
=
n
c
i
j,1
,c
i
j,2
,...,c
i
j,k
j
o
of k
j
cards, the co-
occurrence rate cor(c
s
,c
t
) of two cards c
s
and c
t
is
defined as the ratio of the number of decks, where the
HUCAPP 2025 - 9th International Conference on Human Computer Interaction Theory and Applications
614
two cards co-occur to the number of decks that have
at least one of the cards.
cor(c
s
,c
t
) = 1 + k ·
D
j
| c
s
∈ D
j
∧ c
t
∈ D
j
D
j
| c
s
∈ D
j
∨ c
t
∈ D
j
In this formula, the adjustment coefficient k (= 1
by default) is used to control the extent to which it
influences the synergy score. Moreover, in order to
visualize newly designed cards by designers (as unim-
plemented cards cannot have co-occurrence rates cal-
culated), the co-occurrence rate has the minimum
value of 1.
3.4 Visualization
A 3D force-directed graph is ideal for visualizing syn-
ergies between cards in DCCG, as it can effectively
represent complex networks with a large number of
nodes and edges. The layout algorithm uses attractive
and repulsive forces to naturally cluster related cards
and separate unrelated ones, which could provide a
clear view of card relationships. As a result, we repre-
sent cards as nodes and synergy scores as edge lengths
to construct a 3D force-directed graph for visualizing
card synergies.
To simplify the graph, we define a threshold de-
noted as α with 0 ≤ α ≤ 1 to filter out unnecessary
information. If the synergy score is higher than this
threshold, it is inferred that a meaningful relationship
exists between the two cards, allowing them to be in-
corporated into our visualization.
In addition, we use the synergy score as a piv-
otal factor in determining the length of an edge con-
necting the cards c
s
and c
t
, which is calculated by
δ/synergy(c
s
,c
t
), where δ ≥ 0 is a coefficient for the
adjustment of visualization. The shorter the length,
the higher synergy between two cards.
For implementation, we built upon the Force Di-
rected Diagram plugin (Forgin Bits, 2024) in Unity,
modifying it for our purposes. In addition to the de-
fault rotation and zoom features, we have added filter-
ing functionality (which reduces the opacity of non-
adjacent nodes when a node is selected) and a search
feature (allowing users to jump to the corresponding
node by searching for keywords) to enhance the over-
all user experience.
4 CASE STUDY
To validate our approach, we selected “Yu-Gi-Oh!
Master Duel” (YGOMD) as the primary subject of
our case study. YGOMD is a digital version of “Yu-
Gi-Oh!” (YGO) with the same game rules and card
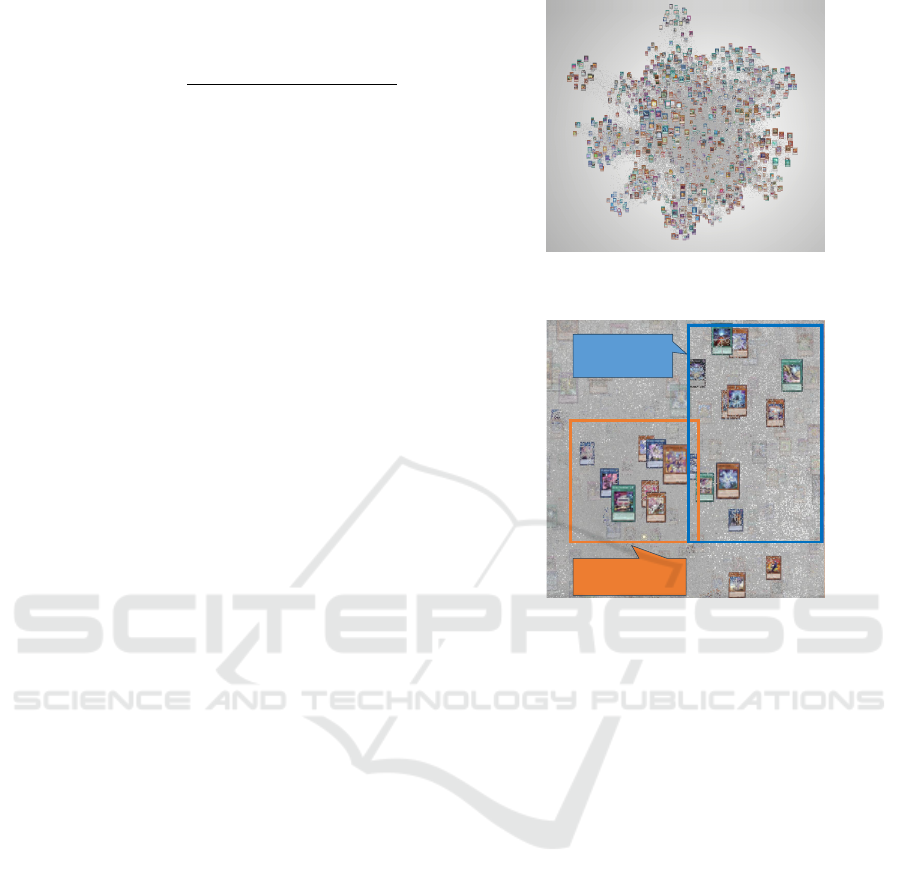
Figure 3: Overall view of the 3D force-directed graph with
1,700 cards.
“Spright”
Archetype
“Evil★Twin”
Archetype
Figure 4: Partial view of a 3D force-directed graph related
to “Spright” and “Evil Twins” cards.
pool. We chose YGOMD because it lacks the re-
source constraints that other DCCGs such as “Hearth-
stone” and “Shadowverse” impose with mana costs,
which typically force players into multiple rounds of
battles. In YGO, a player’s deck is nearly the entire
resource. The strength of a deck highly depends on
the interactions among the cards, and it is common
for players to end a match in one or two turns by using
multiple card combinations, which makes visualizing
card synergy highly valuable.
To prepare a necessary dataset for our analysis,
we have collected approximately 1,000 decks belong-
ing to elite players from the “Master Duel Meta”
website (Duel Links Meta LLC, 2024) by using a
Python-based web scraper. After calculating the syn-
ergy scores through programs, we build a 3D force-
directed graph to visualize the card network by Unity.
The results are shown in Figures 3 and 4.
Recall that the length of an edge in our visu-
alization represents the synergy between two cards.
Although we did not employ a specific clustering
method (through the application of physical simula-
tion principles only), we observed that cards belong-
ing to the same archetype naturally formed small clus-
ters. From Figure 4, we could see that “Spright”
cards and “Evil Twins” cards formed clusters respec-
CSV: Visual Support for Understanding Card Synergy in Digital Collectible Card Games
615

tively. In fact, these two archetypes are often com-
bined in a single deck. Through our visualization,
users can better understand the synergy between dif-
ferent archetypes, as those that work well together
are positioned close to each other within our network.
The filtering feature we implemented also makes the
synergy between cards simple and easy to understand.
5 EVALUATION
Given the absence of previous studies with which we
could compare our research, we assessed our study by
conducting a questionnaire survey and a usability test
among DCCG players.
5.1 Questionnaire
5.1.1 Survey Design
We created an online questionnaire with 13 questions
using Google Forms and asked participants to try our
tool. It gathered basic user information, assessed their
understanding of DCCGs as part of the pre-study,
and collected their feedback on our visualization in
the post-study section. The answer scale is primarily
based on a 5-point ordinal scale.
Here are the questions included in the question-
naire, except for the first 3 questions that ask for per-
sonal information (name, age, and gender). The fol-
lowing are all required multiple-choice questions:
• Pre-study Part
Q1: How familiar are you with DCCGs?
Q2: Do you think that learning to play a DCCG
requires a lot of time and effort?
Q3: If you have ever played DCCGs, did you find
it challenging to build your own deck when you
were a beginner?
Q4: How familiar are you with Yu-Gi-Oh?
• Post-study Part
Q5: What kind of information did you get from
our 3D graph?
Q6: How clearly does the visualization show the
synergies between cards?
Q7: How easy was it to interact with the 3D
force-directed graph?
Q8: Do you think this visualization would help
you in building or optimizing a deck for a
DCCG?
Q9: How accurate do you find the results of the
visualization?
Q10: How appealing do you find the overall de-
sign of the visualization?
Figure 5: The results of questions Q1 to Q10.
5.1.2 Results
Since our visualization does not provide any informa-
tion on game rules, we require users to have a basic
understanding of DCCGs. Therefore, we surveyed 10
individuals with varying levels of experience in YGO.
Based on the feedback, all participants are males aged
20 to 29. Regarding familiarity with DCCG (not lim-
ited to YGO), the participants included 2 beginners,
2 intermediate players, 3 experienced players, and 3
expert players (Q1 in Figure 5). All had played YGO,
with 2 being beginners, 4 being experienced players,
and 4 being expert players (Q4).
To confirm the presence of information overload,
which leads to high learning costs, we asked partici-
pants if learning to play a DCCG requires significant
time and effort. According to the results (Q2), all par-
ticipants answered “Yes”. We also asked whether they
struggled to build their own decks as beginners, and
all participants again responded “Yes” (Q3).
To evaluate our research, participants explored the
interactive 3D graph and identified the types of in-
formation obtained during the process, with multiple
answers allowed. The results showed that 100% of
participants gained insights into card synergies, the
primary goal of the visualization. Additionally, 50%
learned about archetype synergies, and 20% found in-
spiration for deck building (Q5).
We further assessed the visualization using
multiple-choice questions focused on usability, aes-
thetics, accuracy, practicality, and clarity. For “How
clearly does the visualization show the synergies be-
tween cards?” 40% rated it “very clear”, 20% “mostly
clear”, and 20% “neutral” (Q6). Regarding “How
easy was it to interact with the 3D force-directed
graph?” 80% found it “very easy”, while 20% rated it
“somewhat easy” (Q7). When asked “Does this vi-
sualization help in building or optimizing a DCCG
HUCAPP 2025 - 9th International Conference on Human Computer Interaction Theory and Applications
616

deck?” 20% said “helpful”, 30% “somewhat helpful”,
and 20% were “neutral” (Q8). In terms of accuracy,
for “How accurate do you find the visualization re-
sults?” 50% rated it “accurate”, 30% “somewhat ac-
curate”, and 20% “neutral” (Q9). On design appeal,
“How appealing is the overall visualization design?”
received 20% “very appealing”, 50% “moderately ap-
pealing”, and 30% “neutral” (Q10).
5.2 Usability Test
To assess the usability of our research, we conducted
a usability test involving two groups of players: 2
beginners and 2 experienced players. This test con-
sists of 3 sections: Pre-study Questionnaire, Task Per-
formance Assessment, and Post-study Questionnaire.
Since our previous questionnaire was designed to ful-
fill both Pre-study and Post-study functions, partici-
pants have already completed it as outlined in the pre-
vious section, and these responses have been included
in our prior statistical analysis.
5.2.1 Design of Task Performance Assessment
The task performance assessment involves guiding
players through a series of tasks that we have de-
signed, with difficulty increasing incrementally. For
each task, we record the completion time, and ob-
serve participants’ approaches to understand their be-
haviors. The assessment includes the following 3 pri-
mary tasks:
T1: Identify the three cards that have good synergy
with “Dark Magician”.
T2: Identify two archetypes that has good synergy
with “Blue-Eyes” Deck.
T3: Use this tool as a reference to create a competi-
tive “Hero” deck in YGOMD.
5.2.2 Results
Table 1 shows the task completion times for each par-
ticipant. For T1, all players used the search bar im-
mediately, completing it in about 10 seconds. Experi-
enced players completed the task flawlessly, while be-
ginners often included staple cards (commonly used
powerful cards) among the top synergy cards instead
of focusing solely on those truly with good synergy
(Yu-Gi-Oh! Wiki, 2024). In T2, beginners took 50
seconds and 1 minute 2 seconds, respectively, while
experienced players finished in 23 and 26 seconds.
Beginner actions revealed that the visualization does
not clearly convey archetype synergy, which leads to
confusion, despite cards within the same archetype
Table 1: Task completion times for each participant.
Participant T1 T2 T3
Expert 1 12s 23s 5m2s
Expert 2 9s 26s 4m37s
Beginner 1 13s 50s 6m19s
Beginner 2 10s 1m2s 7m44s
forming distinct clusters. For T3, experienced play-
ers took 5 minutes 2 seconds and 4 minutes 37 sec-
onds, while beginners needed 6 minutes 19 seconds
and 7 minutes 44 seconds. Experienced players cre-
ated decks of higher quality, comparable to those in
actual gameplay. In contrast, beginners’ decks were
less organized, often including all related cards with-
out strategic considerations.
The Task Performance Assessment shows experi-
enced players completed tasks faster and with higher
quality due to prior knowledge. Beginners, though
slower and less accurate, still performed reasonably
well with the tool’s assistance.
6 DISCUSSION
6.1 User Feedback Analysis
Based on user feedback, we can conclude that our vi-
sualization effectively helped players understand the
synergies among cards. The survey confirmed that
DCCGs often have a high entry barrier due to infor-
mation overload. For all questions evaluating differ-
ent aspects of the visualization, participants provided
either neutral or positive responses.
Nevertheless, the results also indicate that while
the visualization is relatively clear, simply under-
standing the strength of card synergies provides lim-
ited assistance in deck building and overall game
comprehension. Additionally, the tool’s effectiveness
seems to be influenced by the player’s experience
level in DCCGs. For example, in task T1, beginner
players who were less familiar with the concept of
staple cards demonstrated relatively lower accuracy in
their responses. Offering clearer delineation of cluster
boundaries could help address this issue.
6.2 Application on Other DCCGs
Our goal is to propose a method for visualizing card
synergies across a wide range of DCCGs. In this re-
search, the visualization experiment was conducted
exclusively with YGOMD. While this demonstrates
that our approach could be effective for games where
cards have strong interactions, additional visualiza-
tion experiments on a variety of DCCGs are planned
CSV: Visual Support for Understanding Card Synergy in Digital Collectible Card Games
617

to further validate the feasibility of our method.
In addition, in games like the “Pok
´
emon Trad-
ing Card Game”, card texts often lack explicit inter-
actions, which necessitates relying primarily on co-
occurrence rates for synergy score calculations. To
address this limitation, we plan to simulate and col-
lect gameplay data to evaluate how cards interact in
practice, aiming to explore hidden synergies that are
not explicitly described in their texts.
6.3 Reflection on the Evaluation
Method
The lack of similar studies on DCCGs presents a
significant challenge to conducting objective, cross-
comparative evaluations of this tool. This has resulted
in current evaluations relying heavily on subjective re-
sponses, which are less convincing.
Furthermore, the small and homogeneous sample
size used in the evaluation limits the generalizabil-
ity of the findings. Since our study does not include
features to introduce the game, participants were re-
quired to have a basic understanding of DCCGs. Re-
lying solely on experienced DCCG players may intro-
duce bias by excluding the perspectives of beginners.
Expanding the participant pool to include a more di-
verse audience and integrating qualitative data is one
of our future plans to strengthen the robustness of the
evaluation.
7 CONCLUSIONS AND FUTURE
WORK
In this paper, we introduced a novel approach to visu-
alizing card synergies to overcome information over-
load in DCCGs through a graph-based visualization
framework. To test it, we visualized card synergies for
YGOMD and conducted a questionnaire survey with
a usability test involving recruited volunteers. Al-
though there are areas that require improvement, par-
ticipant feedback confirmed the effectiveness of our
visualization approach.
Our ultimate goal is to evolve this framework into
a comprehensive support tool, enabling our synergy
analysis method to be applied across most DCCGs.
Based on the results of this study, we will continue re-
fining the framework to benefit both players and game
designers, helping users gain deeper insights into card
synergies and the game itself.
ACKNOWLEDGMENT
This work was partly supported by JSPS KAKENHI
Grant Number JP24K14904.
REFERENCES
Chen, Z., Amato, C., Nguyen, T.-H. D., Cooper, S., Sun, Y.,
and El-Nasr, M. S. (2018). Q-DeckRec: A fast deck
recommendation system for collectible card games. In
Proc. IEEE CIG, pages 1–8.
Dockhorn, A. and Mostaghim, S. (2019). Introducing the
Hearthstone-AI competition. arXiv, 1906.04238.
Duel Links Meta LLC (2024). Top decks. https://www.
masterduelmeta.com/top-decks.
e Silva Vieira, R., Tavares, A. R., and Chaimowicz, L.
(2024). A taxonomy of collectible card games from
a game-playing AI perspective. arXiv, 2410.06299.
Forgin Bits (2024). Force directed diagram. https://www.
youtube.com/watch?v=hWt5WPO8c6A.
Fudolig, M., Alshaabi, T., Arnold, M., Danforth, C., and
Dodds, P. (2022). Sentiment and structure in word co-
occurrence networks on Twitter. Appl. Netw. Sci., 7:9.
Konami Digital Entertainment (2021). Yu-Gi-Oh! Master
Duel has over 10,000 cards to unlock. https://www.
konami.com/games/us/en/topics/1752/.
Puerta, P., Laguna, L., Vidal, L., Ares, G., Fiszman, S.,
and T
´
arrega, A. (2020). Co-occurrence networks of
Twitter content after manual or automatic processing.
a case-study on “gluten-free”. Food Qual. Prefer.,
86:103993.
Strother, J. B., Ulijn, J. M., and Fazal, Z. (2012). Visualiz-
ing instead of overloading: Exploring the promise and
problems of visual communication to reduce informa-
tion overload. In Information Overload: An Interna-
tional Challenge for Professional Engineers and Tech-
nical Communicators, pages 203–229. Wiley-IEEE
Press.
Swacha, J. (2021). Three dimensions of science: A web tool
for 3d visualization of scientific literature. In Proc.
ACM/IEEE JCDL, pages 274–277.
Turkay, S. and Adinolf, S. (2018). Understanding on-
line collectible card game players’ motivations: a sur-
vey study with two games. In Proc. OzCHI, page
501–505. ACM Press.
Vieira, R., Tavares, A. R., and Chaimowicz, L. (2020).
Drafting in collectible card games via reinforcement
learning. In Proc. SBGames, pages 54–61. IEEE CPS.
Wang, S., Li, W., and Gu, Z. (2023). GeoGraphViz:
Geographically constrained 3D force-directed graph
for knowledge graph visualization. Trans. GIS,
27(4):931–948.
Yu-Gi-Oh! Wiki (2024). Gaming terms. https:
//yugioh.\linebreak[0]fandom.com/wiki/Category:
Gaming\
Terms.
Zuin, G., Chaimowicz, L., and Veloso, A. (2022). Deep
learning techniques for explainable resource scales
in collectible card games. IEEE Trans. Games,
14(1):46–55.
HUCAPP 2025 - 9th International Conference on Human Computer Interaction Theory and Applications
618
