
Multiscale Entropy Analysis of Continuous Glucose Monitoring Data:
A Comparative Study of Diabetic and Healthy Populations
Cleber França Carvalho
a
, Thilini Savindya Karunarathna
b
and Zilu Liang
c
Ubiquitous and Personal Computing Lab, Kyoto University of Advanced Science (KUAS), Kyoto, Japan
Keywords: Continuous Glucose Monitoring, Multiscale Entropy, Diabetes, Prediabetes, Approximate Entropy,
Attention Entropy, Dispersion Entropy.
Abstract: The advent of continuous glucose monitoring (CGM) has made it possible to measure glucose frequently in
daily life. This availability of glucose time series enables advanced analysis to uncover patterns in glycaemic
dynamics that were previously undetectable with traditional blood-sample-based measurements. One such
analytical method is multiscale entropy (MSE), which assesses the complexity of time series data across
varying time scales. In this study, we performed a comparative analysis of MSE across three cohorts:
individuals with type 1 diabetes (T1D), type 2 diabetes (T2D) and prediabetes (PRED). Our goal was to
identify potential differences in glucose dynamics across these groups. We applied three base entropies,
including approximate entropy (ApEn), attention entropy (AttnEn) and dispersion entropy (DispEn). We
found that AttnEn and DispEn were useful in distinguishing between individuals with diabetes (both T1D and
T2D) and those with prediabetes, whereas ApEn did not show significant discriminative power. Furthermore,
we observed no substantial differences between T1D and T2D in terms of their MSE profiles. These results
suggest that MSE, with appropriate base entropy measures, holds promise as a tool for developing biomarkers
to differentiate between diabetes and prediabetes. Future studies could explore additional base entropy
measures and analysing larger, more diverse datasets.
1 INTRODUCTION
Diabetes mellitus is a metabolic condition
characterized by high glucose levels, which can lead
to several systemic complications, such as
cardiovascular diseases, nephropathy, stroke, and
others (Alam et al., 2014). According to the
International Diabetes Federation, 537 million adults
worldwide were living with diabetes in 2021, and this
number is projected to rise to 783 million by 2045,
which is considered a serious public health problem
(IDF Diabetes Atlas, 2021). Diabetes is commonly
classified into two types: Type 1 Diabetes (T1D) and
Type 2 Diabetes (T2D). T1D is a chronic autoimmune
condition that causes destruction of pancreatic beta-
cells, which are responsible for insulin production.
On the other hand, T2D is caused by insulin
resistance or deficiency in the production of insulin
(Kahn et al., 2006). Another emerging condition
a
https://orcid.org/0009-0008-3740-4355
b
https://orcid.org/0009-0002-4089-9500
c
https://orcid.org/0000-0002-2328-5016
related to insulin malfunctioning is called prediabetes
(PRED), which can be characterized by high glucose
levels after meals but with normal fasting glucose
levels. It is estimated that there are 541 million people
in the world with this condition.
Since there is still no cure for diabetes, the best way
to manage the disease is to change lifestyle habits and
control blood glucose levels. In recent years,
continuous glucose monitoring (CGM) has become
popular as an effective tool for managing diabetes due
to its affordability and convenience (Battelino et al.,
2019). These sensors are attached to the skin,
continuously measuring interstitial glucose, providing
a view of glucose trends and fluctuations throughout
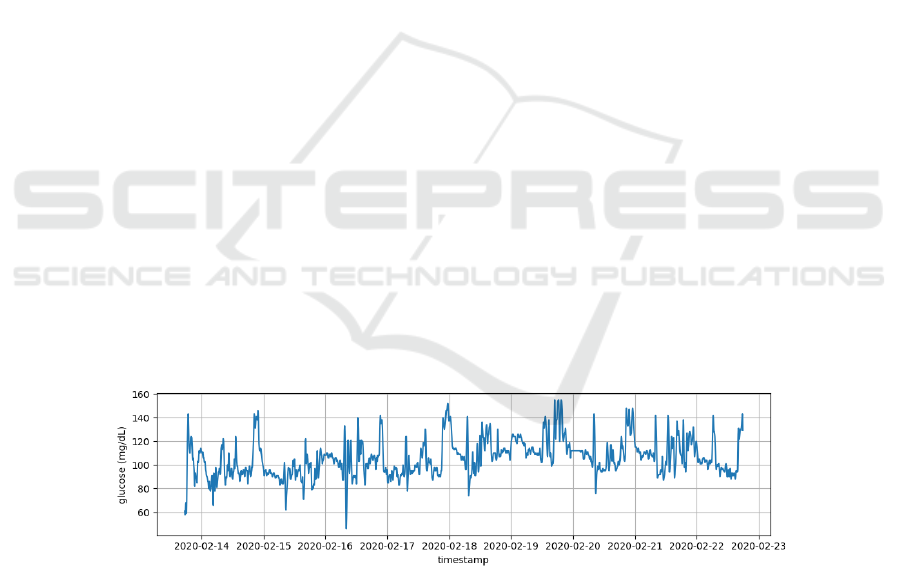
the day and generating a large amount of data (Rice and
Coursin, 2012). These data, as represented in Figure 1,
can be utilized to uncover insights into glycaemic
dynamics and other aspects of human physiology and
behaviour (Bertrand et al., 2021; Liang, 2022).
720
Carvalho, C. F., Karunarathna, T. S. and Liang, Z.
Multiscale Entropy Analysis of Continuous Glucose Monitoring Data: A Comparative Study of Diabetic and Healthy Populations.
DOI: 10.5220/0013257000003911
Paper published under CC license (CC BY-NC-ND 4.0)
In Proceedings of the 18th International Joint Conference on Biomedical Engineering Systems and Technologies (BIOSTEC 2025) - Volume 2: HEALTHINF, pages 720-726
ISBN: 978-989-758-731-3; ISSN: 2184-4305
Proceedings Copyright © 2025 by SCITEPRESS – Science and Technology Publications, Lda.

CGM data is complex, containing a wealth of
information encoded in the temporal and spatial
patterns of glucose fluctuations. One approach to
characterize this information is through multiscale
entropy (MSE) analysis. MSE is based on the simple
observation that complex human physiological
signals often exhibit dynamics that fall between
perfect regularity and complete randomness. These
signals possess intricate structures that can be
observed at multiple spatial and temporal scales
(Costa et al., 2002). While many studies have
employed MSE to analyse the complexity of glucose
dynamics, most have focused only on a certain type
of entropy measure and usually comparing the
complexity of diabetics to that of healthy individuals.
There is a lack of understanding regarding the
comparative analysis of different entropy measures
across different types of diabetic and prediabetic
populations.
In this work, we analysed CGM time series from
three distinct diabetic populations with MSE, using
different base entropies: approximate entropy
(ApEn), attention entropy (AttnEn) and dispersion
entropy (DispEn). Our goal is to answer the following
research questions: (1) What are the characteristics of
these multiscale entropies of continuous glucose
data? and (2) Which entropy measures are most
effective at differentiating between the three
populations? This study makes two key contributions.
First, it provides new understanding of glycaemic
complexity by employing multiple entropy measures
to analyse glucose signal dynamics. Second, it offers
insights into how different entropy measures can
effectively differentiate between diabetic and
prediabetic populations. These findings have clinical
relevance, as they could lead to the development of
easy-to-measure biomarkers for early diagnosis.
2 RELATED WORKS
Multiscale entropy (MSE) analysis is a powerful
method to assess the complexity and irregularity of
a signal across multiple time scales or levels of a
system. By examining the temporal fluctuations of
the signal, MSE offers insights into the underlying
structure of the information encoded (Bar-Yam,
2004; Nawaz et at., 2024). MSE has been widely
applied to analyse the complexity of physical and
physiological signals, such as heart rate,
electroencephalogram (EEG) and blood oxygen
saturation (SpO2) (Busa et al., 2016; Chu et al.
2021; Chen et al., 2022; Liang, 2023). Regarding
human signals, researchers combined MSE with
Attention Entropy (AttnEn) and applied the method
to SpO2 signals to generate features and in
association with classification machine learning
models to detect sleep apnea (Liang, 2023). Machine
learning models were also used in combination with
MSE and gait force signals to classify
neurodegenerative diseases, such as Parkinson’s
disease (Nam Nguyen et al., 2020). In the context
of glucose signal analysis, scientists usually apply
MSE and Sample entropy (SampEn). This
combination appears most frequently in the
literature, such when quantifying the complexity of
the temporal structure of the CGM time series in
non-diabetic and diabetic people, with findings
showing that the complexity of the signal is
significantly higher for the non-diabetic subjects
(Costa et al., 2014). In order to investigate
relationship between glucose complexity, glucose
variability and insulin resistance, Crenier et. al.,
applied SampEn and detrended fluctuations analysis
into CGM data. As the main results, they found that
SampEn was inversely correlated with insulin
resistance, body mass index and glucose variability
(Crenier et al., 2016). Another study carried out a
retrospective cross-sectional analysis to evaluate
and compare relationship between indices of non-
linear dynamics and traditional glycaemic
variability, including MSE with SampEn (Kohnert
et al., 2018). Researchers also studied the
comparison between SampEn and Fuzzy Entropy, in
the context of artifact blood glucose time series.
They found that both are sufficient robust to achieve
a significant classification performance (Cuesta-
Frau et al., 2018). Targeting in T2D pregnant
patients under treatment, researchers analysed the
complexity and fractality of glucose dynamics using
MSE and applying SampEn (Chen et al., 2019). Still
with the combination MSE and SampEn, this study
made a comparison of the complexity of CGM
signals between diabetics and control individuals.
They found that the complexity of glucose dynamics
fluctuation decreases in diabetes and MSE
complexity index could be used as a biomarker in
the monitoring of diabetes (Chen et al., 2014). In
other work, scientists applied Approximate Entropy
(ApEn) in glucose readings from T1D subjects, they
found an increase of glucose profile complexity due
to changes of insulin therapies (Lytrivi and Crenier,
2014). Previous studies did not address the use of
different entropies in signal complexity analysis and
considered only a single type of dataset. On the other
hand, this study contributes to the analysis of
different entropies in different datasets with distinct
conditions related to diabetes.
Multiscale Entropy Analysis of Continuous Glucose Monitoring Data: A Comparative Study of Diabetic and Healthy Populations
721

3 METHODOLOGIES
3.1 Datasets
In this study, CGM data from three databases were
retrospectively analyzed. The first dataset included 12
individuals with T1D, 58.3% of whom were women,
with a mean age of 50 years. These individuals were
undergoing treatment with Medtronic Enlite 530G or
630G insulin pumps. No glycated hemoglobin
(HbA1c) data was available for this cohort. Data
collection occurred over 8 weeks, which Medtronic
Enlite CGM sensors recorded blood glucose levels
every 5 minutes (Marling et al., 2020). The second
dataset contains time series blood glucose readings
from 100 individuals with T2D, 44% of whom are
women, with an average age of 60.1 years. These
participants wore FreeStyle Libre sensors for periods
ranging from 3 to 14 days, with glucose readings
automatically recorded every 15 minutes. After
removing duplicate and irregular data, a total of 92
individuals were included in the final analysis and
had an HbA1c average of 75.9 mmol/mol (Zhao et al.,
2023). The last dataset includes data from 16
prediabetic subjects, 56.2% of whom were female,
monitored using the Dexcom G6 device over a 10-day
period. Glucose levels were recorded at 5-minute
intervals, and the cohort's average HbA1c was 41.5
mmol/mol (Goldberger et al., 2000).
3.2 Multiscale Entropy Analysis
The MSE analysis involves a series of iterative steps
for each specified scale factor (τ): a coarse-graining
technique is applied to the signal, followed by the
calculation of the base entropy at each scale.
Regarding the coarse-graining process, the
glucose level signal is segmented into non-
overlapping sequences for different temporal scales.
Given a glucose signal 𝑥
(
𝑖
)
=
{
𝑥
(
1
)
,
𝑥
(
2
)
,…,𝑥
(
𝑁
)
}
,
(
𝑖 = 1,2,…,𝑁
)
, the coarse-grained
signal for scale factor τ
(
τϵℕ
)
represented as:
𝑥
(
𝑗
)
=𝑥
(
1
)
,𝑥
(
2
)
,…,𝑥
(
𝑁/𝜏
)
(1)
Assuming
𝑗=1,2,…,𝑁/𝜏, this signal can be
calculated by the mean of all data points within the j-
th window. When 𝜏=1, 𝑥
(
𝑗
)
is equivalent to the
initial signal. For 𝜏>1 the length of the coarse-
grained signal decreases progressively as the scale
factor τ increases.
The value of 𝜏 is different and depends on the
type of dataset. For the T1D and PRED datasets,
which the glucose recording time is every 5 minutes,
the value of the scale factor is set to values 1 to 12,
corresponding to a time range of 5-60 minutes, which
means that 12 coarse-grained signals were
generated. For the T2D dataset, in which glucose
records are every 15 minutes, 𝜏 values were between
1 and 4, corresponding a time range 15-60 minutes
and generating 4 coarse-grained new signals.
3.3 Base Entropies
Three different entropy measures were utilized:
approximate entropy (ApEn), attention entropy
(AttnEn), and dispersion entropy (DispEn). Unlike
previous studies that typically relied on a single
entropy measure, often sample entropy, our approach
of using three base entropies allows us to capture a
broader range of characteristics in the CGM data.
ApEn has been widely used in various types of
signals, such as physiological and financial data
(Sabeti, 2009). DispEn was selected because it
addresses some limitations of the widely used sample
entropy, particularly in terms of computational cost
and its ability to capture amplitude patterns in signals
(Rostaghi et at., 2016). However, both entropy
measures require parameter tuning, which adds
complexity and uncertainly to analysis. To mitigate
this, we also performed analysis on AttnEn, which
has the advantage of being parameter-free and is
considered robust to variations in time-series length
(Yang, et al. 2020). In what follows we provide a
detailed description of each of these base entropies.
• Approximate Entropy (ApEn)
ApEn is a technique used to quantify the amount of
regularity and the unpredictability of fluctuations
over time-series data (Pincus, 1991). ApEn is
calculated with the following steps:
1. Define parameters: embedding dimension
(𝑚), tolerance threshold for similarity (𝑟).
2. Create 𝑚-dimensional vectors from CGM
time series 𝑥
(
𝑖
)
.
3. For each vector 𝑥
(
𝑖
)
, calculate the distance
between two vectors 𝑥
(
𝑖
)
and 𝑥
(
𝑗
)
as the
maximum absolute difference between their
corresponding components.
4. Define a function
𝐶
(
𝑟
)
that counts the
number of vectors 𝑥
(
𝑗
)
that are similar to 𝑥
(
𝑖
)
,
meaning the distance is less than equal to 𝑟.
5. Calculate Φ
(
𝑟
)
, the average of the
logarithms of 𝐶
(
𝑟
)
.
6. Increase the embedding dimension to 𝑚+1,
repeat the steps 2-5, and calculate Φ
(
𝑟
)
7. The formula of Approximate Entropy is:
HEALTHINF 2025 - 18th International Conference on Health Informatics
722

ApEn
(
𝑚,𝑟,𝑁
)
=Φ
(
𝑟
)
−Φ
(
𝑟
)
• Attention Entropy (AttnEn)
AttnEn measures the distribution or spread of attention
across multiple inputs in a system. This method does
not need any parameter to tune, it is robust to the time-
series length and requires only linear time to compute
(Yang et al., 2020). Attention entropy is calculated
with the following four main steps:
1. Identify the peak points 𝑥
(𝑗), which can
be considered as local maxima or a local
minimum.
2. Define the key patterns ω in 𝛺.
3. Calculate the intervals 𝐼
(𝑗) between two
adjacent peak points for each pattern ω for
any given sub-series.
4. Calculate Shannon entropy over
frequencies of all intervals by the equation
below:
AttnEn = −
1
4
𝑝(𝐼
(𝑘))log 𝑝(𝐼
(𝑘))
∈
• Dispersion Entropy (DispEn)
DispEn is a recently introduced entropy metric to
quantify the uncertainty of time series and is fast to
compute (Rostaghi et al., 2016). To calculate DispEn,
the followings steps are necessary:
1. The signal is mapped to c classes, labelled
from 1 to c. The normal cumulative
distribution function (NCDF) is used to map
𝑥
(
𝑗
)
into 𝑦
(
𝑗
)
. Next, the linear algorithm is
used to assign to an integer from 1 to c. For
each member, is converted to 𝑧
,
(
𝑗
)
=
𝑟𝑜𝑢𝑛𝑑(𝑐.𝑦
+0.5).
2. Each embedding vector 𝑧
,,
(
𝑗
)
=
{𝑧
,
(
𝑗
)
,𝑧
,
(
𝑗+𝑑
)
…,𝑧
,
(𝑗 + (𝑚 − 1)𝑑)} ,
with embedding dimension m and time delay
d, is mapped to a dispersion pattern
𝜋
…
(𝑗).
3. For each 𝑐
potential dispersion, relative
frequency is obtained as follows:
p
𝜋
…
(𝑗)
=
𝑁𝑢𝑚𝑏𝑒𝑟{𝑘|𝑘 ≤ 𝑁 −
(
𝑚−1
)
𝑑,𝑧
,,
(
𝑗
)
ℎ𝑎𝑠 𝑡𝑦𝑝𝑒 𝜋
…
(𝑗)}
𝑁 − (𝑚 − 1)𝑑
4. Based on Shannon’s definition of entropy, the
Dispersion Entropy is:
DispEn𝑥
,𝑚,𝑐,𝑑
=−𝑝(
𝜋
𝑣
0
𝑣
1
…𝑣
𝑚−1
𝜏
(𝑗))log 𝑝(𝜋
𝑣
0
𝑣
1
…𝑣
𝑚−1
𝜏
(𝑗))
4 RESULTS
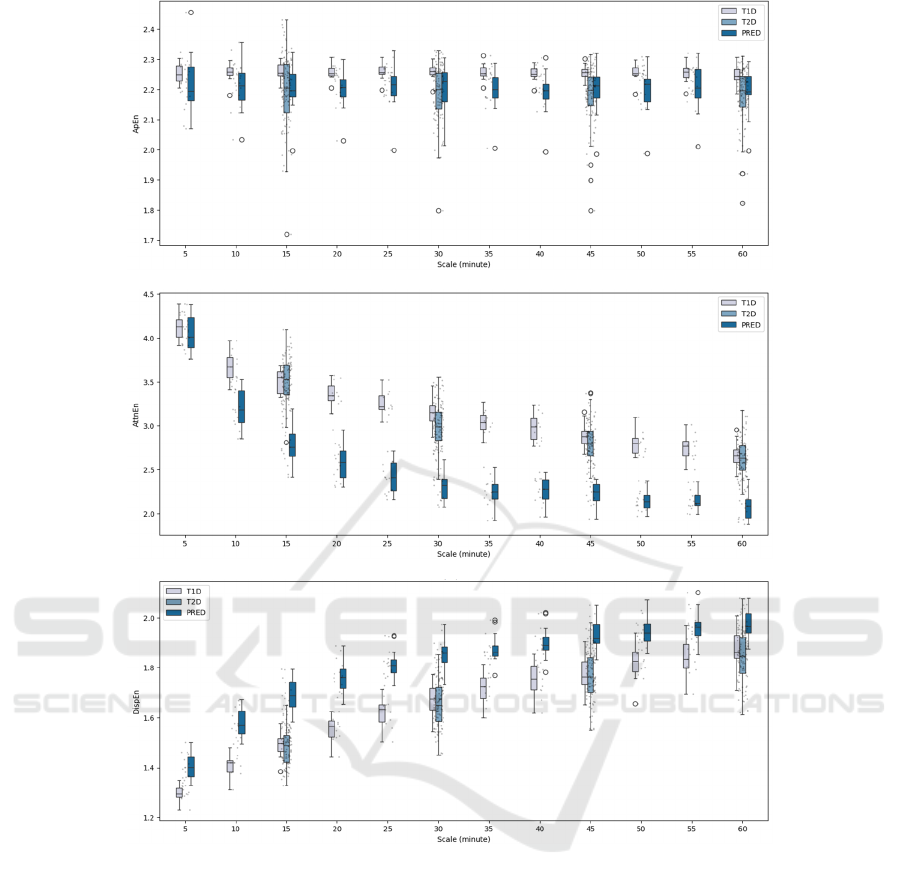
Figure 2 (a) shows the distribution of ApEn across the
time scales. This figure reveals that the entropy values
remain relatively stable, making it difficult to
differentiate between the various diabetic populations
and prediabetes. This suggests that ApEn is not a
useful metric for separating the different populations.
The distribution of AttnEn for three groups at each
time scale is shown in Figure 1 (b). As seen in the
figure, it is noticeable trend of entropy decreasing
over time, which allows for the distinction between
the T1D/T2D and prediabetic datasets from 10
minutes onward, continuing through to the time scale
of 60 minutes. Finally, Figure 1 (c) illustrates the
distribution of DispEn. From this figure, we observe
an increase in entropy values over the time scale, with
a clear separation between the diabetes groups and the
prediabetic group across the entire time scale. This
indicates that DispEn can effectively distinguish
between the CGM data of diabetic patients and
healthy people. Table 1 shows a summary of these
observations.
Table 1: Trends and utilities of three base entropies in MSE
analysis.
Entropy Trend Utility
ApEn Stable Not useful
AttnEn Decrease Useful when time
scale is between
10
–
60 minutes
DispEn Increase Useful
5 DISCUSSIONS
There are few studies related to CGM time series and
entropy analysis (Chen et al., 2019; Lytrivi and
Crenier, 2014). Furthermore, most studies do not
address other types of diabetes incidence, such as
prediabetes and their comparisons among all groups.
This study, we selected three base entropy
measures for analysis. Our analysis revealed that the
three base entropy measures exhibited distinct trends
as the time scale increased, and they showed
differences in their effectiveness at differentiating
between diabetic and the healthy population.
Different patterns among different populations of
diabetic and healthy individuals are expected due to
the characteristic blood glucose level behaviours of
everyone in these groups. Entropy algorithms
manipulate the analysed signal to detect patterns and
Multiscale Entropy Analysis of Continuous Glucose Monitoring Data: A Comparative Study of Diabetic and Healthy Populations
723
characteristics inherent to each analysed population.
We found that approximate entropy was not useful at
any time scale, attention entropy was effective when
the time scale ranged between 10 to 60 minutes, and
dispersion entropy was useful across the entire time
scale analysed. ApEn, despite being widely used in
previous studies on physiological signal analysis, did
not prove useful in distinguishing between the
diabetes and prediabetes cohorts in our study. This
suggests that popular and widely used methods are
not always the most effective for every problem. In
the case of glucose dynamics, ApEn may not capture
the dysfunction in the physiological systems
regulating blood glucose levels in individuals with
diabetes. In contrast, the other two entropy measures,
despite being rarely used in the literature, appear to
provide more relevant insights for our analysis. This
observation underscores the importance of exploring
a diverse range of entropy measures, especially those
that are not yet widely adopted in the literature. It is
also important to note that none of the base entropy
measures were able to differentiate between T1D and
T2D. The possible reasons for this include similarities
in glucose dynamics between T1D and T2D or
limitations in the datasets used.
It is necessary to interpret these results with
caution. The utility of the base entropy measures may
be context dependent. Since our analysis was limited
to three datasets, each homogeneous in terms of
subject demographics, it is important not to
overgeneralize these findings. Further research with
more diverse populations and additional datasets is
necessary to draw more definitive conclusions.
Nonetheless, this research broadens the scope of MSE
analysis applied to glucose signals, and our findings
provide valuable insights that can inspire future
hypotheses and research in this area.
6 CONCLUSION
In this study, we investigated the potential of MSE
analysis to distinguish between individuals with T1D,
T2D, and prediabetes using CGM data. Our findings
highlight the importance of selecting appropriate base
entropy measures. While ApEn, a widely used
measure in physiological signal analysis, proved
ineffective for distinguishing between the diabetes
and prediabetes cohorts, AttnEn and DispEn showed
promising results, especially in capturing dynamic
differences across time scales. In particular, DispEn
was useful across the entire time scale analysed,
suggesting its potential as a more robust marker. In
addition, DispEn entropy analysis showed results
similar to previous studies, in which the complexity
of CGM signals is greater for non-diabetic than for
diabetic subjects and that this technique can detect an
increased regularity in the pattern of glucose
fluctuations (Costa et al, 2014; Chen et al., 2014).
Overall, our work suggests that MSE analysis
holds promise for developing biomarkers to
distinguish between diabetes and prediabetes.
Although no significant differences were observed
between T1D and T2D cohorts, future studies with
larger and more diverse datasets may help clarify the
utility of MSE analysis in differentiating these two
groups. In the next step, we plan to explore additional
entropy measures to deepen our understanding of
glucose dynamics across different populations.
Figure 1: Time-series Continuous Glucose Monitoring.
HEALTHINF 2025 - 18th International Conference on Health Informatics
724
(a)
(b)
(c)
Figure 2: Multiscale entropy analysis on CGM data for T1D, T2D, and prediabetes using different base entropy: (a)
Approximate entropy, (b) Attention entropy, (c) Dispersion entropy.
REFERENCES
Alam, U., Asghar, O., Azmi, S., & Malik, R. A. (2014).
General aspects of diabetes mellitus. Handbook of
clinical neurology, 126, 211–222.
Azami, H., Escudero, J. (2018). Amplitude- and
Fluctuation-Based Dispersion Entropy. Entropy;
20(3):210.
Bar-Yam, Y. (2004). Multiscale complexity/entropy. Adv.
Complex Syst, 7, 47–63.
Battelino, T., Danne, T., Bergenstal, RM. et al. (2019).
Clinical targets for continuous glucose monitoring data
interpretation: recommendations from the international
consensus on time in range. Diabetes Care, 42(8):1593-
1603.
Bertrand, L., Cleyet-Marrel, N., Liang, Z. (2021). The Role
of Continuous Glucose Monitoring in Automatic
Detection of Eating Activities.
10.1109/LifeTech52111.2021.9391849.
Busa, M. A., Jones, S. L., Hamill, J., & van Emmerik, R. E.
(2016). Multiscale entropy identifies differences in
complexity in postural control in women with multiple
sclerosis. Gait & posture, 45, 7–11.
Chen, J-L., Chen P-F., Wang H-M (2014). Decreased
complexity of glucose dynamics in diabetes: evidence
from multiscale entropy analysis of continuous glucose
Multiscale Entropy Analysis of Continuous Glucose Monitoring Data: A Comparative Study of Diabetic and Healthy Populations
725

monitoring system data. Am J Physiol Regul Integr
Comp Physiol 307: R179 –R183.
Chen, J.-L.; Shen, H.-S.; Peng, S.-Y.; Wang, H.-M. (2022).
Reduced System Complexity of Heart Rate Dynamics
in Patients with Hyperthyroidism: A Multiscale
Entropy Analysis. Entropy, 24, 258.
Chen, X. et al. (2019). Analyzing Complexity and Fractality
of Glucose Dynamics in a Pregnant Woman with Type
2 Diabetes under Treatment. International journal of
biological sciences. vol. 15,11 2373-2380.
Chu, Y. J., Chang, C. F., Weng, W. C., Fan, P. C., Shieh, J.
S., & Lee, W. T. (2021). Electroencephalography
complexity in infantile spasms and its association with
treatment response. Clinical neurophysiology: official
journal of the International Federation of Clinical
Neurophysiology, 132(2), 480–486.
Costa, M., Henriques, T., Munshi, M. N., Segal, A. R., &
Goldberger, A. L. (2014). Dynamical glucometry: use
of multiscale entropy analysis in diabetes. Chaos
(Woodbury, N.Y.), 24(3), 033139.
Costa, M., Goldberger, A. L., Peng, C. K. (2002).
Multiscale entropy analysis of complex physiologic
time series. Physical review letters, 89(6), 068102.
Crenier, L. et al. (2016). Glucose Complexity Estimates
Insulin Resistance in Either Nondiabetic Individuals or
in Type 1 Diabetes. The Journal of clinical
endocrinology and metabolism vol. 101,4: 1490-7.
Cuesta-Frau, D. et al. (2018). Characterization of Artifact
Influence on the Classification of Glucose Time Series
Using Sample Entropy Statistics. Entropy 20, 871.
Goldberger, A. L., Amaral, L. A., Glass, L., Hausdorff, J.
M., Ivanov, P. C., Mark, R. G., Mietus, J. E., Moody,
G. B., Peng, C. K., & Stanley, H. E. (2000).
PhysioBank, PhysioToolkit, and PhysioNet:
components of a new research resource for complex
physiologic signals. Circulation, 101(23), E215–E220.
International Diabetes Federation. (2021). IDF Diabetes
Atlas, 10th edn. Brussels, Belgium: International
Diabetes Federation.
Kahn, S. E., Hull, R. L., Utzschneider, K. M. (2006).
Mechanisms linking obesity to insulin resistance and
type 2 diabetes. Nature 444, 840–846.
Kohnert, K-D. et al. (2018). Applications of Variability
Analysis Techniques for Continuous Glucose
Monitoring Derived Time Series in Diabetic Patients.
Frontiers in physiology vol. 9 1257.
Liang Z. (2022). Mining associations between glycemic
variability in awake-time and in-sleep among non-
diabetic adults. Frontiers in medical technology, 4,
1026830. https://doi.org/10.3389/fmedt.2022.1026830
Liang, Z. (2023). Novel method combining multiscale
attention entropy of overnight blood oxygen level and
machine learning for easy sleep apnea screening.
Digital Health. 9. 1-19. 10.1177/20552076231211550.
Lytrivi M, Crenier L. (2014). Glucose variability outcome
for type 1 diabetic patients switching to CSII: improved
complexity patterns beyond glucose dispersion
reduction. European Association for the Study of
Diabetes (EASD) 50th Ann Meeting
. Abstract, 1004.
Marling, C., Bunescu, R. (2020). The OhioT1DM Dataset
for Blood Glucose Level Prediction: Update 2020.
CEUR workshop proceedings, 2675, 71–74.
Nam Nguyen, Q.D., Liu, A.-B. & Lin, C.-W. (2021).
Development of a Neurodegenerative Disease Gait
Classification Algorithm Using Multiscale Sample
Entropy and Machine Learning Classifiers. Entropy, 22,
1340.
Nawaz S., Saleem M., Kusmartsev FV., Anjum DH. (2024).
Major Role of Multiscale Entropy Evolution in
Complex Systems and Data Science Entropy 26, no. 4:
330. https://doi.org/10.3390/e26040330
Pincus S. M. (1991). Approximate entropy as a measure of
system complexity. Proceedings of the National
Academy of Sciences of the United States of
America, 88(6), 2297–2301.
Rice, M. J., Coursin, D. B. (2012). Continuous
measurement of glucose: facts and challenges.
Anesthesiology, 116(1), 199–204.
Rostaghi, M. & Azami, H. (2016). Dispersion Entropy: A
Measure for Time Series Analysis. IEEE Signal
Processing Letters. 23. 1-1.
Sabeti, M. (2009). Entropy and complexity measures for
EEG signal classification of schizophrenic and control
participants. Artificial Intelligence in Medicine. 47 (3):
263–274.
Yang, J., Choudhary, G., Rahardja, S. (2020). Classification
of Interbeat Interval Time-Series Using Attention
Entropy. IEEE Transactions on Affective Computing. 1.
10.1109/TAFFC.2020.3031004.
Zhao, Q., Zhu, J., Shen, X., Lin, C., Zhang, Y., Liang, Y.,
Cao, B., Li, J., Liu, X., Rao, W., & Wang, C. (2023).
Chinese diabetes datasets for data-driven machine
learning. Scientific data, 10(1), 35.
HEALTHINF 2025 - 18th International Conference on Health Informatics
726
