
Recognising Care-Related Activities with a Convolutional Neural
Network Using Inertial Measurement Units
Fenja T. Hesselmann
a
, Jannik Fleßner
b
, Alexander Pauls
c
, Vanessa Cobus
d
,
Frauke Koppelin
e
and Frank Wallhoff
f
Jade University of Applied Sciences, Oldenburg, Germany
Keywords:
Human Activity Recognition, CNN, Nurse Care, Accelerometer.
Abstract:
Sensor-based human activity recognition is a growing field of research. In addition to recognising everyday
movements, situation-dependent activities can also be detected. This paper therefore aims to detect care-
specific movements. For this purpose, 13 different nursing activities were recorded with Inertial Measurement
Units (IMUs) worn on the body. In this paper, we present an approach on how the sensor data can be used
for recognition. Convolutional neural networks were used for classification. The focus of this work is on two
different fusion approaches of the data to check which approach achieves better results. In the first approach,
all data is fused at the beginning, while in the second one, a separate pipeline is designed for each sensor and
fused later. The results show that a later fusion technique provides a better F1 score of 90.2 % compared to a
model that considers all signals from the beginning (F1 score: 82.5 %).
1 INTRODUCTION
Activity recognition refers to the ability of a system
to recognise different activities on the basis of previ-
ously learned data from various sensors. The sensors
used can be accelerometers, gyroscopes or cameras,
for example. Based on the increasing availability of
such sensors, interest in research into Human Activity
Recognition (HAR) is also growing. The applications
are diverse: in sports medicine (Nadeem et al., 2021),
in fall detection (Stampfler et al., 2023; Ferrari et al.,
2020) or the recognition of activities of daily living
(Stampfler et al., 2023; Wan et al., 2020). Activities
can be recognised on the basis of static and dynamic
gestures using sensor data. These can be simple activ-
ities such as walking or lying down, or more complex
action sequences such as cooking (Ramanujam et al.,
2021).
Various activities are also carried out in the care
sector, e.g. giving medication or food or treating
wounds. These activities are repeated regularly and
must be documented to ensure quality and for liabil-
ity reasons. However, studies have shown that the
a
https://orcid.org/0000-0003-0395-3854
b
https://orcid.org/0000-0002-4367-1651
c
https://orcid.org/0000-0001-9175-5756
d
https://orcid.org/0000-0002-4690-0800
e
https://orcid.org/0000-0002-1827-9279
f
https://orcid.org/0000-0002-7791-3225
documentation effort amounts to approx. 20-30 % of
the regular working time (Joukes et al., 2018; Murad
et al., 2024). In addition, due to a lack of time, the
documentation is sometimes completed collectively
at the end of the shift, which can lead to errors, as
important aspects may have been forgotten to be en-
tered at the beginning of the shift (Moy et al., 2021).
However, surveys among carers have shown that they
would like to use the technology to make their daily
work easier (Seibert et al., 2020). HAR is one way
that can be used to relieve carers of the burden of doc-
umentation and reduce the time required.
Recognising nursing activities has been identified
as an important field of research. The first Nurse
Care Activity Recognition Challenge was launched in
2019. The aim was to classify various care activities
recorded with multiple sensors such as camera-based
systems (Lago et al., 2019). However, it should be
noted that dealing with patients always involves sen-
sitive data and for this reason aspects of data protec-
tion and ethics, as well as the avoidance of monitoring
the nursing staff must be taken into account.
The aim of the Data-Driven Health research
project is therefore to develop and evaluate auto-
mated nursing documentation based on technology-
supported activity analyses to relieve and support
clinical nursing practice. This paper presents the
first results of activity recognition of nursing activ-
ities based on data measured with Inertial Measure-
ment Units (IMUs). The focus should be on the fusion
Hesselmann, F. T., Fleßner, J., Pauls, A., Cobus, V., Koppelin, F. and Wallhoff, F.
Recognising Care-Related Activities with a Convolutional Neural Network Using Inertial Measurement Units.
DOI: 10.5220/0013257400003911
Paper published under CC license (CC BY-NC-ND 4.0)
In Proceedings of the 18th International Joint Conference on Biomedical Engineering Systems and Technologies (BIOSTEC 2025) - Volume 2: HEALTHINF, pages 727-733
ISBN: 978-989-758-731-3; ISSN: 2184-4305
Proceedings Copyright © 2025 by SCITEPRESS – Science and Technology Publications, Lda.
727

of the used data.
In the following, we first present related work that
has dealt with activity recognition in nursing. This is
followed by a description of our methods, including
the sensors used and the development of a machine
learning model. The results are then presented and
discussed. The paper concludes with a summary and
next steps.
2 RELATED WORK
Other researchers have also recognised the relevance
of relieving the burden on nursing staff by automat-
ing the documentation. Kaczmarek et al. attached
three IMUs to the upper body, specifically to the up-
per arms and to a belt. The IMUs recorded accelerom-
eter, magnetometer and gyroscope data. Seven sub-
jects performed six different activities, with all ac-
tivities having the context of mobilising or changing
the patient’s position. To recognise the classes, both
an unsegmented approach and recognition with seg-
mented data were performed. Two neural networks,
an LSTM and a CNN, were evaluated. The accuracy
was 55 %, but could be improved with further locali-
sation information, segmented data and daily routine
information (Kaczmarek et al., 2023).
In addition to accelerometer data, Konak et al.
also used camera data. The five accelerometer sen-
sors were attached to the wrists, ankles and pelvis.
Ten subjects performed 13 different activities, includ-
ing washing the body in bed, pushing a wheelchair
or preparing medication. Three deep learning mod-
els were trained and compared to recognise the dif-
ferent classes. It was also tested whether the use of
poses from the camera data has added value in terms
of recognition. The authors were able to achieve an
accuracy of up to 86 % with a Residual Neural Net-
work. It was also found that the optimal sensor po-
sitions are the wrists and pelvis (Konak et al., 2023).
However, this statement is difficult to implement in
practical care, as objects on the wrists are usually pro-
hibited for reasons of hygiene and risk of injury. The
use of cameras is also difficult in practice for data pro-
tection reasons. In addition, the selection of activi-
ties to be recorded is limited, so that activities such as
wound care are not taken into account.
Lago et al. took a different approach. They
recorded various activities using a marker-based mo-
tion capture system. For this purpose, 29 markers
were attached to the subjects’ bodies and their po-
sition was recorded using 16 infrared cameras. In
addition, the accelerometer data from a smartphone
in the subject’s breast pocket was recorded. This
data set was made available as part of several chal-
lenges. While six activities were to be recognised in
the first Nurse Care Activity Recognition Challenge,
in which all modalities were available (Lago et al.,
2019), 28 activities had to be classified using only
the accelerometer data in the fourth challenge (Inoue
et al., 2022). Although the challenges make an impor-
tant contribution, a critical reflection must be made on
the choice of sensor modalities. The use of a motion
tracking system with several cameras is complex and
not practical. The wearing or use of smartphones is
also often not permitted in everyday clinical practice.
The work presented shows that there are already
various approaches for recognising care-related activ-
ities. However, the selected sensors and sensor po-
sitions must be critically considered in the design.
In collaboration with care professionals, Bruns et al.
have established functional and non-functional re-
quirements that a system for recognising care-related
activities should fulfil (Bruns et al., 2024). The work
by Wallhoff and Hesselmann (Wallhoff and Hessel-
mann, 2025) presented a concept of how an AI-based
assistance system could be structured to support doc-
umentation. In addition to the identification of activi-
ties, the concept provides a review by the nursing staff
in order to improve recognition results.
3 METHODS
This chapter presents the methods used in this paper
to recognise care activities. Starting with the sen-
sors used and the procedure for data acquisition, fol-
lowed by the subsequent data processing. The chapter
concludes with a description of the classification and
evaluation methods.
3.1 Data Recording
The data for this study was recorded using 10 Movella
DOT (previously Xsens DOT) Inertial Measurement
Units (IMUs) (Movella Inc., 2024). The sensors were
located on the outer sides of the wrists, upper arms,
ankles and thighs, as well as one sensor on the upper
back and one on the lower back. Although the po-
sition on the wrists is unfavourable in real life, we
chose this position for later comparison with other
work. A total of 23 output signals were recorded for
each sensor, each with a sampling rate of 60 Hz: four-
dimensional quaternion values, four-dimensional an-
gular velocities determined by the derivative of the
quaternion values, three-dimensional accelerometer
values, three-dimensional velocity values determined
by the derivative of the accelerometer values, three-
HEALTHINF 2025 - 18th International Conference on Health Informatics
728
dimensional magnetic field values, three-dimensional
Euler angles and three-dimensional gyroscope values.
In addition, the study was recorded with a Mi-
crosoft Azure Kinect (Microsoft, 2024). The result-
ing video was used to label the IMU data and assign
it to the correct activities. The Azure Kinect was set
up approx. 130 cm away from the patient’s bed, at a
height of approx. 214 cm, so that the entire bed was
recorded from the side. The Kinect recorded at a sam-
pling frequency of 30 Hz.
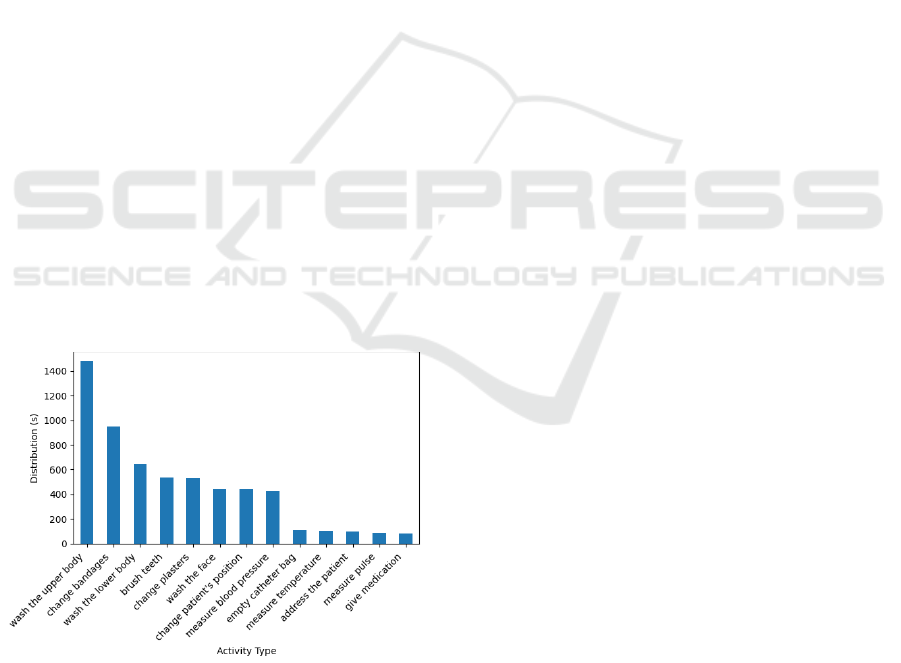
During the study, the participants were asked to
carry out 14 different activities. These activities were
selected on the basis of an online survey in which
subjects were asked about the most frequently docu-
mented care activities. Figure 1 shows the distribution
of the individual activities in seconds. The activities
were performed on a simulation mannequin as a pa-
tient.
The data set was analysed in the university’s com-
petence and simulation laboratory for applied nursing
sciences at the Jade University of Applied Sciences.
Four trained nurses took part in the study, average
age: 44 years, average professional experience: 20
years. One session, in which the 13 activities were
carried out one after the other, lasted 23 minutes on
average. The participants performed two rounds each,
with a break between the rounds. In order to make it
as realistic as possible, no minimum implementation
time was specified.
The experiment complied with the Declaration of
Helsinki and was approved by the Ethics Commit-
tee of the University of Oldenburg under the approval
number Drs.EK/2024/027.
Figure 1: Distribution of the different activities in seconds.
3.2 Data Preprocessing
The activities were labelled manually and synchro-
nised with the acceleration signal. The Kinect video
recordings were used as a reference for annotating the
IMU data. Distinctive movements in both data sets
(e.g. performing a jumping jack) were used to syn-
chronise the time of the modalities. By annotating
the start and stop times in the video data, the corre-
sponding IMU data could be assigned to the respec-
tive activity performed. In addition to the activities,
e.g. the measurement of blood pressure, the individ-
ual actions, e.g. the placement of the blood pressure
cuff or its inflation, were also annotated. However,
the actions are not taken into account for this study.
The video recording of one participant stopped
during the recording of the second session, which
means that only part of this session is available and
the data could not be fully annotated.
The data set was divided into small, overlapping
windows, with a window length of 1 s (60 frames) and
an overlap of 50 %. A smaller window size is associ-
ated with better classification performance. The pro-
cedure also facilitates the training process of a Con-
volutional Neural Network (CNN) (Bevilacqua et al.,
2019). The overlapping of the windows leads to a
higher number of training and test data. The recorded
356013 frames containing activities were thus divided
into 11868 windows. Each window was assigned to
an activity or class, which was determined by the re-
spective class majority. If there was only unlabelled
data in a window, e.g. because materials were re-
trieved, this window was ignored. Because the ac-
tivities have different execution times and the partici-
pants performed the activities at different speeds, the
data set is not balanced, see figure 1.
The data is then normalised so that all signals
are in a similar range. To do this, we used Z-
normalisation, which is already used in various works
(M
¨
unzner et al., 2017). The value x can be normalised
using formula 1, where µ and σ are the mean and stan-
dard deviation of the individual signals. For normal-
isation, the data is first divided into training and test
data. µ and σ are determined for the training part and
then applied to the test part. This ensures that the val-
ues of the training data set cannot influence the nor-
malisation process.
x
′
= (x − µ)/σ (1)
3.3 Classification
To classify the care activities, a Convolutional Neural
Network (CNN) is used in this work. We opted for
this because a CNN has delivered good results in other
work compared to other neural networks (Ramanujam
et al., 2021).
In addition to the input layer, a CNN consists of
one or more convolutional and pooling layers, fully
connected or dense layers and an output layer. The
Recognising Care-Related Activities with a Convolutional Neural Network Using Inertial Measurement Units
729
convolutional layer can extract features from the input
data using kernels, while the pooling layer reduces the
resolution of the features by discarding unnecessary
information. Finally, all nodes in the fully connected
layers are connected to all nodes in the output layer
(Bhatt et al., 2021). The output, e.g. the classifica-
tion result, is displayed in the output layer. CNNs are
often used in image recognition (Lecun and Bengio,
1995; Bhatt et al., 2021), but are also used in other
applications (Ersavas et al., 2024; Bhatt et al., 2021).
As several different signals were recorded with the
IMUs (including quaternion and accelerometer data),
two models were trained. The models were devel-
oped with Tensorflow (Abadi et al., 2015). The CNN
contains two consecutive convolutional layers, each
with 64 filters and a kernel size of 3. The convo-
lutional layers use a ReLu activation function. This
is followed by a dropout layer (50 %), a fully con-
nected layer with 100 neurons and a softmax layer.
The model was trained with an Adam optimiser, a
batch size of 128 and 100 epochs. The architecture
and parameters were chosen based on (Gholamiango-
nabadi et al., 2020).
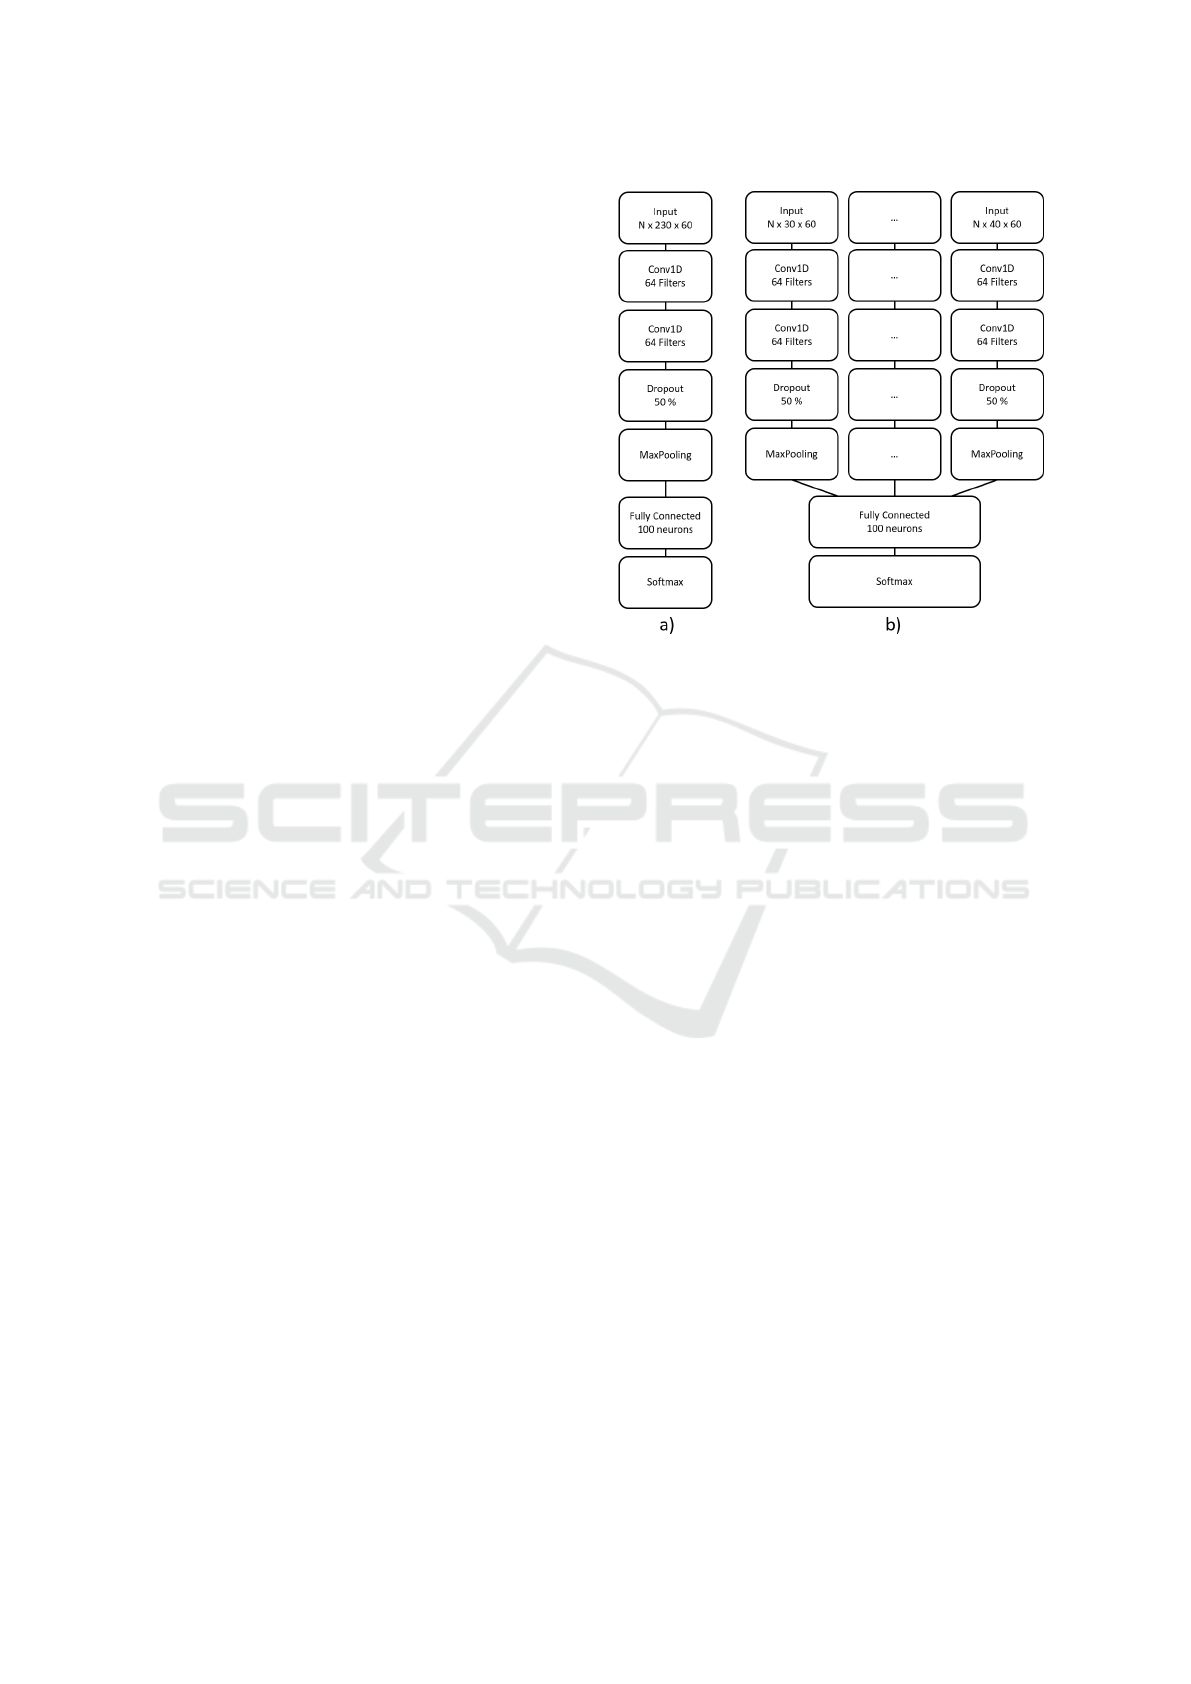
The two models differ in their fusion approach i.e.
their data input. In Model
All
, all signals from all sen-
sors were merged at the beginning and transferred to
the input layer. As a result, the data input had a size
of N x 230 x 60, where N is the number of segments.
The 230 describe the 23 signals multiplied by ten sen-
sors and the 60 denote the frames of a window. The
schematic structure is shown in figure 2 a).
In Model
Signal
, the data is divided up according
to the signals. A separate pipeline is developed for
each signal, which is fused before the fully connected
layer. This allows signal-specific models to be de-
veloped. Depending on the dimension of the signal
(three- or four-dimensional), the data input of the in-
dividual pipelines was N x 30 x 60 or N x 40 x 60.
The structure of the CNN is shown in figure 2 b).
3.4 Evaluation
The two models Model
All
and Model
Signal
are each
tested with a stratified 10-fold cross validation. The
classification accuracy and the weighted F1 score
were calculated as evaluation metrics. The weighted
F1 score considers the correct classification of each
class in equal parts by using the precision, recall and
proportion of the class in the data set. As the data set
is unbalanced, the accuracy is a less suitable measure
than the F1 score. Nevertheless, it was calculated for
comparison with other work. The training and valida-
tion loss was also considered to ensure that the model
does not overfit. This can often occur with smaller
data sets.
Figure 2: Schematic structure of the two CNN architectures
and fusion approaches. a) shows the early fusion of all sen-
sor data in Model
All
, b) shows the separate pipelines and
the late fusion in Model
Signal
.
4 RESULTS
Figure 3 shows the average training and validation
loss curve as well as the curve of the F1 score of
Model
All
over the ten folds. The loss respectively the
F1 score is plotted on the y-axis and the epochs on the
x-axis. While the loss of the training data decreases
constantly, the loss of the validation data starts to in-
crease slightly from epoch 43 onwards. It can also be
seen that the loss of the validation data is higher than
the loss of the training data. The F1 diagram (see Fig.
3 below) shows that the training F1 score level off at
around 91 %, while the test F1 score stabilises at just
over 80 %.
Figure 4, on the other hand, shows the training
and validation loss of Model
Signal
. Here, too, it can be
seen that the loss curve of the validation data is higher
than the loss curve of the training data, although the
two curves almost equalise. However, the curves de-
crease up to a point of stability and do not rise again
afterwards. The performance of the model no longer
improves around the 55th training epoch. The F1 di-
agram (see Fig. 1 below) shows that the graphs of the
training and validation data approximate each other.
While the training data achieves an F1 score of 96 %,
the F1 scores of the validation data stabilise at around
91 %.
Table 1 shows the accuracy and F1 score for both
models. With an accuracy of 90.3 % and an F1
HEALTHINF 2025 - 18th International Conference on Health Informatics
730
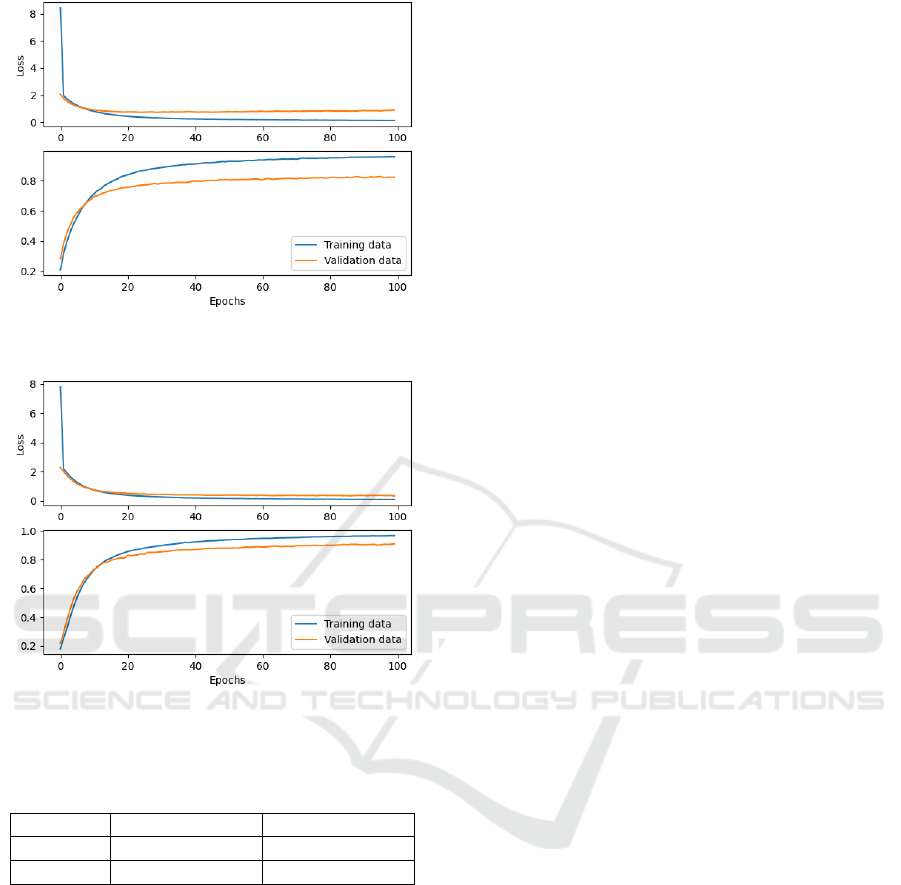
Figure 3: Loss and F1 curve of the training and validation
data of Model
All
.
Figure 4: Loss and F1 curve of the training and validation
data of Model
Signal
.
Table 1: Performance comparison of Model
All
and
Model
Signal
.
Model Model
All
Model
Signal
Accuracy 82.6 % ± 1.3 % 90.3 % ± 1.8 %
F1 score 82.5 % ± 1.2 % 90.2 % ± 1.7 %
score of 90.2 %, Model
Signal
has a better result than
Model
All
, which has an accuracy of 82.6 % and an F1
score of 82.5 %.
5 DISCUSSION
The main objective of this work is to evaluate the im-
pact of model selection and data fusion on the ability
of the model to classify care activities. The results
have shown that later fusion of the data provides bet-
ter accuracies and F1 scores than fusion right at the
beginning. This result can be explained by the fact
that later fusion models are based on the idea of deter-
mining individual convolutional filters for each sen-
sor modality. This allows each pipeline of the model
to extract the most meaningful features. In contrast,
when the data is fused early, the model appears to dis-
card important features, resulting in lower calculated
scores.
As we have attempted to recognise different nurs-
ing activities in this paper than the work presented in
the Related Work chapter, the calculated scores can-
not be fully compared. Nevertheless, the accuracy
and F1 score for both CNN models are in a similar
range to other studies that have performed HAR with
a CNN and evaluated with cross-validation (Konak
et al., 2023; Tsokov et al., 2021; Moya Rueda et al.,
2018).
However, the loss curve should also be consid-
ered. The decreasing training curves of the loss val-
ues show that the models are gradually refining their
predictions. The validation curve, on the other hand,
shows the performance of the model with unseen data.
In the case of Model
All
, the continuing fall in the
training curve, the slight rise in the validation curve
and the difference between the curves indicate a slight
overfit of the model. The model makes accurate pre-
dictions for the training data, but not for new data.
This could be due to the small but also unbalanced
data set. With Model
Signal
, on the other hand, the
convergence of the two curves shows that the model
learns meaningful features and overfitting to the train-
ing data is avoided. As a result, this model is prefer-
able to Model
All
.
Related work has shown that the use of k-fold
cross-validation provides better accuracy than leave-
one-subject-out cross-validation (LOSOCV) (Gho-
lamiangonabadi et al., 2020; Konak et al., 2023). This
is due to the fact that each subject has individual dif-
ferences in the performance of activities and with k-
fold cross validation, data from each subject is avail-
able in the training set. To ensure that the model can
also recognise the activities of new, unknown persons,
a LOSOCV should also be carried out. However, this
was not possible with the limited number of subjects
available.
6 CONCLUSION
In this paper, two CNNs were developed to recognise
13 care activities. Various signals from ten body-worn
IMUs were used for this purpose. The paper describes
the pre-processing procedure, the classifiers used and
the results obtained. The results show an accuracy
of 82.6 % and an F1 score of 82.5 % for the CNN
with all signals and an accuracy of 90.3 % and an F1
score of 90.2 % for the signal-dependent CNN. It has
been shown that with multisensor data, it is useful to
Recognising Care-Related Activities with a Convolutional Neural Network Using Inertial Measurement Units
731

calculate a separate pipeline for each signal and then
fuse them. This procedure provides better accuracies
and F1-scores than fusing the data at the beginning.
The next step is to analyse more data from other
care professionals and investigate which sensor posi-
tion is most relevant. As soon as several participants
have taken part, a leave one subject out cross valida-
tion can be carried out instead of a 10-fold cross val-
idation in order to check how accurate the model is
with an unknown participant. Furthermore, the data
from the Kinect camera will be integrated into the ac-
tivity recognition to check whether this can improve
recognition and the F1 score.
ACKNOWLEDGEMENTS
This study was supported by the Lower Saxony Min-
istry for Science and Culture with funds from the gov-
ernmental funding initiative zukunft.niedersachsen
of the Volkswagen Foundation, project ”Data-driven
health (DEAL)”.
REFERENCES
Abadi, M., Agarwal, A., Barham, P., Brevdo, E., Chen, Z.,
Citro, C., Corrado, G. S., Davis, A., Dean, J., Devin,
M., Ghemawat, S., Goodfellow, I., Harp, A., Irving,
G., Isard, M., Jia, Y., Jozefowicz, R., Kaiser, L., Kud-
lur, M., Levenberg, J., Man
´
e, D., Monga, R., Moore,
S., Murray, D., Olah, C., Schuster, M., Shlens, J.,
Steiner, B., Sutskever, I., Talwar, K., Tucker, P., Van-
houcke, V., Vasudevan, V., Vi
´
egas, F., Vinyals, O.,
Warden, P., Wattenberg, M., Wicke, M., Yu, Y., and
Zheng, X. (2015). TensorFlow: Large-scale machine
learning on heterogeneous systems. Software avail-
able from tensorflow.org.
Bevilacqua, A., MacDonald, K., Rangarej, A., Widjaya, V.,
Caulfield, B., and Kechadi, T. (2019). Human Activ-
ity Recognition with Convolutional Neural Networks.
In Brefeld, U., Curry, E., Daly, E., MacNamee, B.,
Marascu, A., Pinelli, F., Berlingerio, M., and Hurley,
N., editors, Machine Learning and Knowledge Dis-
covery in Databases, pages 541–552, Cham. Springer
International Publishing.
Bhatt, D., Patel, C., Talsania, H., Patel, J., Vaghela, R.,
Pandya, S., Modi, K., and Ghayvat, H. (2021). CNN
Variants for Computer Vision: History, Architecture,
Application, Challenges and Future Scope. Electron-
ics, 10(20):2470.
Bruns, F. T., Pauls, A., Koppelin, F., and Wallhoff, F.
(2024). Activity Recognition of Nursing Tasks in a
Hospital: Requirements and Challenges. In Salvi, D.,
Van Gorp, P., and Shah, S. A., editors, Pervasive Com-
puting Technologies for Healthcare, pages 235–243,
Cham. Springer Nature Switzerland.
Ersavas, T., Smith, M. A., and Mattick, J. S. (2024). Novel
applications of Convolutional Neural Networks in the
age of Transformers. Scientific Reports, 14(1).
Ferrari, A., Micucci, D., Mobilio, M., and Napoletano, P.
(2020). On the Personalization of Classification Mod-
els for Human Activity Recognition. IEEE Access,
8:32066–32079.
Gholamiangonabadi, D., Kiselov, N., and Grolinger, K.
(2020). Deep Neural Networks for Human Activ-
ity Recognition With Wearable Sensors: Leave-One-
Subject-Out Cross-Validation for Model Selection.
IEEE Access, 8:133982–133994.
Inoue, S., Hamdhana, D., Garcia, C., Kaneko, H., Nahid,
N., Hossain, T., Alia, S. S., and Lago, P. (2022). 4th
Nurse Care Activity Recognition Challenge Datasets.
Joukes, E., Abu-Hanna, A., Cornet, R., and de Keizer,
N. F. (2018). Time Spent on Dedicated Patient Care
and Documentation Tasks Before and After the Intro-
duction of a Structured and Standardized Electronic
Health Record. Appl Clin Inform, 09(01):046–053.
Kaczmarek, S., Fiedler, M., Bongers, A., Wibbeling, S.,
and Grzeszick, R. (2023). Dataset and Methods for
Recognizing Care Activities. In Proceedings of the
7th International Workshop on Sensor-Based Activity
Recognition and Artificial Intelligence, iWOAR ’22,
New York, NY, USA. Association for Computing Ma-
chinery.
Konak, O., Wischmann, A., van De Water, R., and Arnrich,
B. (2023). A Real-time Human Pose Estimation Ap-
proach for Optimal Sensor Placement in Sensor-based
Human Activity Recognition. In Proceedings of the
8th International Workshop on Sensor-Based Activity
Recognition and Artificial Intelligence, iWOAR ’23,
New York, NY, USA. Association for Computing Ma-
chinery.
Lago, P., Alia, S. S., Takeda, S., Mairittha, T., Mairit-
tha, N., Faiz, F., Nishimura, Y., Adachi, K., Okita,
T., Charpillet, F., and Inoue, S. (2019). Nurse care
activity recognition challenge: summary and results.
In Adjunct Proceedings of the 2019 ACM Interna-
tional Joint Conference on Pervasive and Ubiquitous
Computing and Proceedings of the 2019 ACM Inter-
national Symposium on Wearable Computers, Ubi-
Comp/ISWC ’19 Adjunct, page 746–751, New York,
NY, USA. Association for Computing Machinery.
Lecun, Y. and Bengio, Y. (1995). Convolutional Networks
for Images, Speech, and Time-Series.
Microsoft (2024). Azure kinect dk hardware specifi-
cations. https://learn.microsoft.com/en-us/previous-
versions/azure/kinect-dk/hardware-specification, Last
accessed on 2024-11-07.
Movella Inc. (2024). DOT. https://www.movella.com/
products/wearables/movella-dot, Last accessed on
2024-11-07.
Moy, A. J., Schwartz, J. M., Chen, R., Sadri, S., Lucas, E.,
Cato, K. D., and Rossetti, S. C. (2021). Measurement
of clinical documentation burden among physicians
and nurses using electronic health records: a scoping
review. Journal of the American Medical Informatics
Association, 28(5):998–1008.
HEALTHINF 2025 - 18th International Conference on Health Informatics
732

Moya Rueda, F., Grzeszick, R., Fink, G. A., Feldhorst,
S., and Ten Hompel, M. (2018). Convolutional Neu-
ral Networks for Human Activity Recognition Using
Body-Worn Sensors. Informatics, 5(2):26.
M
¨
unzner, S., Schmidt, P., Reiss, A., Hanselmann, M.,
Stiefelhagen, R., and D
¨
urichen, R. (2017). CNN-
based Sensor Fusion Techniques for Multimodal Hu-
man Activity Recognition. In Proceedings of the 2017
ACM International Symposium on Wearable Comput-
ers, UbiComp ’17, page 158–165. ACM.
Murad, M. H., Vaa Stelling, B. E., West, C. P., Hasan,
B., Simha, S., Saadi, S., Firwana, M., Viola, K. E.,
Prokop, L. J., Nayfeh, T., and Wang, Z. (2024). Mea-
suring Documentation Burden in Healthcare. Journal
of General Internal Medicine, 39(14):2837–2848.
Nadeem, A., Jalal, A., and Kim, K. (2021). Automatic
human posture estimation for sport activity recog-
nition with robust body parts detection and entropy
markov model. Multimedia Tools and Applications,
80(14):21465–21498.
Ramanujam, E., Perumal, T., and Padmavathi, S.
(2021). Human Activity Recognition With Smart-
phone and Wearable Sensors Using Deep Learning
Techniques: A Review. IEEE Sensors Journal,
21(12):13029–13040.
Seibert, K., Domhoff, D., Huter, K., Krick, T., Rothgang,
H., and Wolf-Ostermann, K. (2020). Application of
digital technologies in nursing practice: Results of a
mixed methods study on nurses’ experiences, needs
and perspectives. Zeitschrift f
¨
ur Evidenz, Fortbildung
und Qualit
¨
at im Gesundheitswesen, 158–159:94–106.
Stampfler, T., Elgendi, M., Fletcher, R. R., and Menon, C.
(2023). The use of deep learning for smartphone-
based human activity recognition. Frontiers in Public
Health, 11.
Tsokov, S., Lazarova, M., and Aleksieva-Petrova, A.
(2021). Accelerometer-based human activity recogni-
tion using 1d convolutional neural network. IOP Con-
ference Series: Materials Science and Engineering,
1031(1):012062.
Wallhoff, F. and Hesselmann, F. T. (2025). Nursing Ac-
tivity Recognition for Automated Care Documenta-
tion in Clinical Settings. In Bramer, M. and Stahl,
F., editors, Artificial Intelligence XLI, pages 244–250,
Cham. Springer Nature Switzerland.
Wan, S., Qi, L., Xu, X., Tong, C., and Gu, Z. (2020).
Deep Learning Models for Real-time Human Activ-
ity Recognition with Smartphones. Mobile Networks
and Applications, 25(2):743–755.
Recognising Care-Related Activities with a Convolutional Neural Network Using Inertial Measurement Units
733
