
Wearable Electrodermal Activity Sensor for Real-Time Stress
Detection Using Machine Learning
Salvador Santos
a
, Joana Sousa
b
and João Ferreira
NOS Inovação, Rua Actor António Silva, Lisbon, Portugal
Keywords: Wearable Technology, Electrodermal Activity (EDA), Stress Detection, Machine Learning, Real-Time
Monitoring, Human-Computer Interaction, Biosensors, Arduino Nano ESP32.
Abstract: This paper discusses the design and implementation of a wearable electrodermal activity (EDA) sensor
intended to detect subtle changes in skin conductivity, which are indicative of emotional states such as stress
and anxiety, thus monitoring stress and arousal levels through advanced machine learning techniques. The
device incorporates innovative conductive lycra combined with silver-silver chloride (Ag/AgCl) electrodes,
enabling optimal skin contact and enhancing signal reliability. This integration allows for effective
measurement of EDA. Utilizing the XGBoost algorithm, our machine learning model was trained on the
ASCERTAIN dataset, achieving an overall accuracy of approximately 77% in predicting levels of arousal.
While the model exhibited some challenges in predicting intermediate arousal states, it demonstrated strong
precision and recall for extreme levels of arousal, underscoring its potential applications in mental health
monitoring and human-computer interaction. The capabilities of this wearable technology for continuous and
long-term health monitoring pave the way for further research into stress assessment and the understanding
of emotional responses, emphasizing its relevance in enhancing psychological well-being.
1 INTRODUCTION
The autonomic nervous system (ANS) plays a pivotal
role in regulating numerous physiological processes,
including the production and distribution of sweat
through eccrine sweat glands. This regulation is
crucial for maintaining homeostasis and responding
to various stimuli, including emotional states
(Grimnes and Martinsen, 2015). The insulating
properties of the skin and the conductive nature of
sweat result in measurable differences in skin
conductivity (Malmivuo and Plonsey,1995). This is
attributed to the activation of the ANS, which elevates
sweat production in the sweat ducts during these
emotional states. Despite the established link between
emotional states and skin conductivity, there is a need
for a wearable, reliable and non-invasive method to
detect and quantify stress levels based on
physiological responses. Current methods often lack
the practicality or wearability required for
continuous, real-time monitoring in everyday
situations. A solution that addresses these limitations
a
https://orcid.org/0009-0003-4523-5567
b
https://orcid.org/0000-0002-6418-2312
could have profound implications for enhancing
human-computer interactions, providing individuals
with valuable insights into their emotional well-being
(Bonato, 2003).
To study electrodermal activity (EDA), the signal
is divided into skin conductance level (SCL) and skin
conductance response (SCR), representing tonic and
phasic components, respectively. The tonic activity
(SCL) is a slowly changing base signal with
frequencies below 0.02Hz. The phasic activity (SCR)
arises from sympathetic activation and includes faster
signals (frequencies <0.5Hz), characterized by
significant fluctuations with amplitudes of 0.05µS or
higher, occurring within 3 seconds after a stimulus.
Phasic activation can be event-related (ER-SCR)
following a stimulus or spontaneous (NS-SCR) due to
normal sympathetic regulation. As represented in
figure 1, an SCR signal typically appears as a small
bump on the SCL, with distinct rise and decay phases
(Boucsein, 2012).
188
Santos, S., Sousa, J. and Ferreira, J.
Wearable Electrodermal Activity Sensor for Real-Time Stress Detection Using Machine Learning.
DOI: 10.5220/0013257900003911
Paper published under CC license (CC BY-NC-ND 4.0)
In Proceedings of the 18th International Joint Conference on Biomedical Engineering Systems and Technologies (BIOSTEC 2025) - Volume 1, pages 188-196
ISBN: 978-989-758-731-3; ISSN: 2184-4305
Proceedings Copyright © 2025 by SCITEPRESS – Science and Technology Publications, Lda.
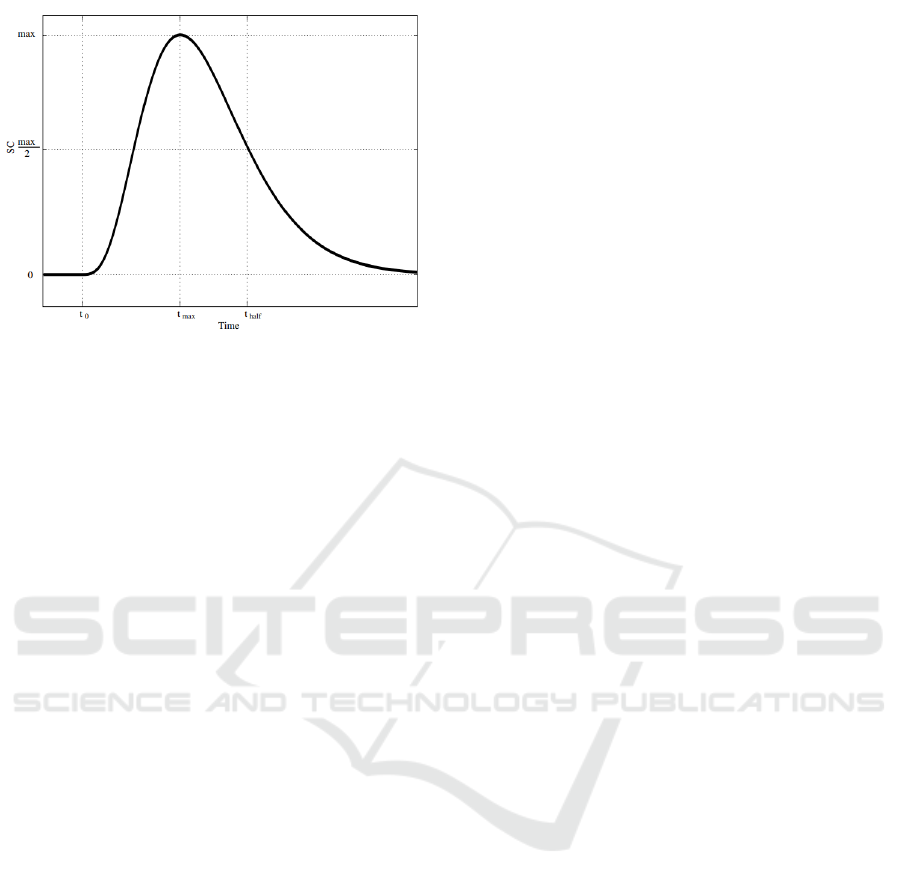
Figure 1: Graphic representation of an SCR event.
The primary objective of this research is to
develop a wearable sensor capable of detecting subtle
changes in skin conductivity associated with arousal
and anxiety. By analyzing these EDA (electrodermal
activity) signals using machine learning algorithms,
the sensor will generate a stress score. Beyond mere
detection, the project aims to translate physiological
information into customized actions or feedback for
the user.
What sets this project apart as innovative is its
pioneering integration of a wearable device with
advanced machine learning technology specifically
designed to detect arousal in real-time. This
capability allows the sensor to analyze electrodermal
activity (EDA) signals as they occur, providing
immediate feedback to users based on their
physiological responses. Such a dynamic interaction
creates a highly personalized experience,
empowering users to gain insights into their
emotional states and manage stress or anxiety more
effectively.
The implications of this research extend well
beyond mere stress detection. By leveraging real-time
machine learning analysis of physiological data, the
project aims to cultivate the development of more
empathetic and responsive technologies. This could
greatly enhance various applications, such as
optimizing user experience in digital interfaces or
providing timely therapeutic interventions for
individuals grappling with stress or anxiety.
Ultimately, the project aspires to make significant
contributions to the field of human-computer
interaction by weaving emotional well-being into the
fabric of technological design.
2 RECORDING SITE
SELECTION
Electrodermal activity (EDA) is crucial in
psychophysiological research, typically measured on
the palms due to their high density of eccrine sweat
glands - 600-700 glands/cm² (Boucsein, 2012).
However, for practical, non-invasive wearable
technology, the wrist is an excellent alternative.
Eccrine sweat glands are distributed throughout
the body, with the forearm, including the wrist,
having about 108 glands/cm². A study by van Dooren
et al. (2012) found that the wrist demonstrated
intermediate skin conductance responsiveness and
ranked high for S-AMPL (sum of skin conductance
responses per minute), comparable to traditionally
preferred sites like the fingers and feet. The wrist also
showed significant correlation (r = .55 to .59) with
finger measurements, suggesting it can reliably
reflect traditional EDA data.
The wrist offers practical advantages: it is
accessible, comfortable for prolonged wear,
integrates seamlessly with existing wearable devices
like smartwatches, and is less intrusive than high-
density sites like the palms.
While palms are the gold standard for EDA
measurement, the wrist is a practical and reliable
alternative for wearables. Its responsiveness,
correlation with traditional sites, and user-friendly
advantages make it ideal for non-invasive EDA
recording, supporting applications in
psychophysiological research and personal health
monitoring.
3 MEASURING DEVICE
3.1 Selection and Implementation of a
Circuit
Based on the literature review and the state of the art,
it was decided that the circuit that seemed most
appropriate to measure electrodermal activity, taking
into account the objective of incorporating it into a
wearable device, was the one described by Poh et al.
(2010) from M.I.T. It offers a small size, a reduced
number of components, an EDA measuring range
within the required values and has no need for the
calibration of its amplification in contrast with other
circuits that work with a variable gain, facilitating its
usability and the complexity of post-measuring
processing of the obtained EDA signals.
Wearable Electrodermal Activity Sensor for Real-Time Stress Detection Using Machine Learning
189
Given the exploratory nature of this project, its
feasibility had to be ensured with limited and easily
obtained resources. Thus, the decision was made to
start the construction of this circuit using the most
widely used A/D converter available in the market: an
Arduino Board. While there are several types of
Arduino Boards, the necessity of maintaining a small
scale for the measuring circuit and the incorporation of
it into a wireless wearable device – to ensure usability
– made it clear that the Arduino Nano ESP32 was the
optimal choice. It has the smallest size among its
counterparts and benefits from the ESP32-S3
microcontroller, which provides full Arduino support
for wireless and Bluetooth
®
connectivity. Additionally,
literature indicates that an EDA signal requires at least
12-bit resolution for reliable measurement (Boucsein,
2012), and the Arduino Board meets this requirement.
Consequently, the circuit would be powered by the
3.3V pin, the dual amplifier by the 5V pin, with both
components grounded via the GND pins from the
Arduino Board. Furthermore, both measuring wires
would connect to the analog pins to record the voltage
received in each case.
Moreover, initial components were chosen, with
price being a major factor since the device is still in
prototype phase. For the resistors, coal resistors of
0.25W with a tolerance of 5% were picked. For the
0.1µC capacitors, the decision was to use ceramic
capacitors. Finally, to act as the two amplifiers, the
dual precision operational amplifier LT1013 was
selected. In the case of the dual operational amplifier,
although the LM358 was the cheapest option, the
importance of reducing the oscillation of the amplifier
to better obtain the EDA signal made it a non-viable
choice, thus the choice of the dual amplifier of higher
cost, but also better performance.
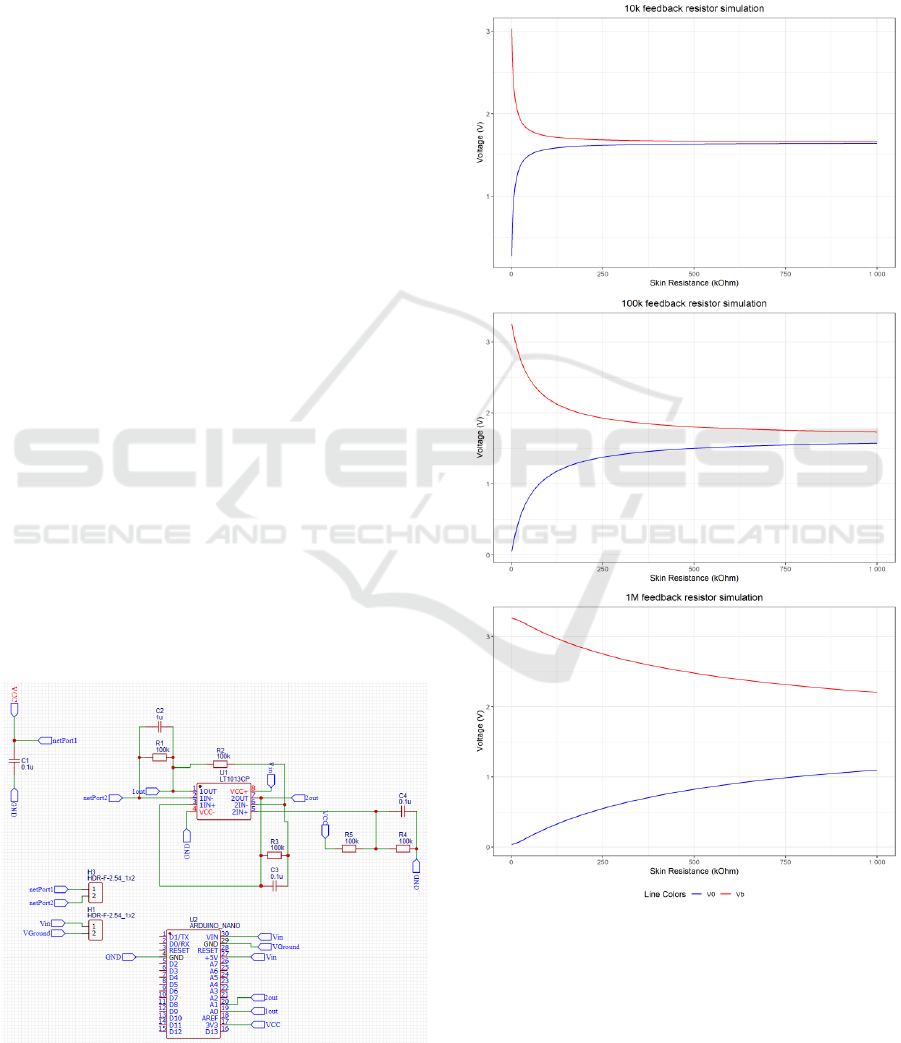
Figure 2: Final circuit configuration.
A scheme of the final circuit configuration can be
observed in figure 2.
3.2 Simulation, Analysis, and
Experimental Validation of Circuit
Performance
Figure 3: Graphic representations of simulations conducted
in LTspice for feedback resistor of 10kΩ, 100kΩ, and 1MΩ,
respectively from top to bottom.
While the preliminary selection of the circuit and its
components had been established, a comprehensive
analysis of the analog circuit remained pending to
BIODEVICES 2025 - 18th International Conference on Biomedical Electronics and Devices
190

Table 1: Experimental results of prototype with 10kΩ feedback resistance.
Resistance (kΩ)
972
461
216
99.0
46.0
21.0
9.83
4.60
Conductance (μS)
1.03
2.17
4.63
10.1
21.7
46.5
101
217
Measured mean value
(μS)
1.019
2.173
4.549
9.994
21.49
45.63
101.9
218.7
Standard Deviation
(%)
9.76
3.66
2.38
0.82
0.60
0.16
0.29
0.05
Accuracy (%)
0.95
0.19
1.74
1.06
1.13
1.90
0.11
0.58
Table 2: Experimental results of prototype with 100kΩ Feedback Resistance.
Resistance (kΩ)
972
461
216
99.0
45.5
21.5
9.83
4.60
Conductance (μS)
1.03
2.17
4.63
10.1
21.7
46.5
102
217
Measured mean value
(μS)
1.037
2.184
4.644
10.16
21.97
47.54
109.5
254.2
Standard Deviation
(%)
1.17
0.72
0.35
0.27
0.31
0.36
0.44
1.27
Accuracy (%)
0.75
0.68
0.32
0.56
0.03
0.17
7.59
16.95
Table 3: Experimental results of prototype with 1MΩ Feedback Resistance.
Resistance (kΩ)
968
461
217
98.0
46.0
21.0
9.84
4.61
Conductance (μS)
1.03
2.17
4.61
10.2
21.7
48.8
101
217
Measured mean value
(μS)
1.031
2.172
4.684
10.65
24.77
65.08
319.5
991.3
Standard Deviation
(%)
0.18
0.25
0.31
0.66
1.30
1.7
10.7
8.97
Accuracy (%)
0.21
0.15
1.63
4.40
14.0
33.4
214
357
validate the previously assumed potentials and
limitations of the circuit. Consequently, a simulation
of the circuit was executed utilizing the LTspice free
software. Given the skin's function as a
potentiometer, with its conductance continually
varying due to both internal and external influences,
a DC operating point analysis (op.) was conducted by
systematically varying the resistance values
associated with the skin. In this DC operating point
simulation, incremental steps were taken for the
parameter X, representing the skin resistance, ranging
from 1kΩ to 1MΩ — the spectrum of potential values
for skin contact resistance, as indicated by existing
literature — using intervals of 1kΩ. The measured
conductance values were observed to be
predominantly influenced by the feedback resistance
of the amplifier directly connected to the skin.
Consequently, simulations were conducted with
varying orders of magnitude for this resistance
(10kΩ, 100kΩ, and 1MΩ) to assess their impact on
the measurements.
Figure 3 depicts simulations conducted in
LTspice and graphically represented using the R
programming language. The upper and lower lines in
each graph correspond to the voltage levels of the
1out and 2out measuring pins connected to the
Arduino board in the final circuit representation, as
shown in Figure 2. Notably, an observable trend
emerges wherein an increase in feedback resistance
results in a more linear trajectory for both measured
voltages. This effect becomes particularly
pronounced at the termination point of the plot,
corresponding to a skin resistance of 1MΩ. The
anticipated behaviour, derived from a previously
formulated expression, posits hyperbolic curves as an
accurate representation of the measured voltages.
Furthermore, the inclination of the curves holds
significance in determining measurement sensitivity.
A more inclined slope suggests heightened
sensitivity. While one might intuitively select a 1MΩ
feedback resistor for the initial amplifier due to its
nearly linear behaviour within the requisite skin
resistance range, the simulation results reveal
deviations at lower resistances. Specifically, when
employing a 1MΩ feedback resistor, the voltages
cease to conform to hyperbolic curves at skin
resistances below approximately 60kΩ, indicating
amplifier saturation.
Consequently, the simulation outcomes advocate
for the adoption of a 100kΩ feedback resistor in the
proposed circuit for optimal performance across the
entire spectrum of skin resistance values. This
configuration demonstrates superior sensitivity,
while avoiding deviation at lower resistances, making
Wearable Electrodermal Activity Sensor for Real-Time Stress Detection Using Machine Learning
191
it the most suitable choice for the intended
measurements.
The culmination of the circuit analysis,
encompassing the three specified values of feedback
resistance (10kΩ, 100kΩ, and 1MΩ), entailed the
construction of prototypes to evaluate the accuracy
and precision of each distinct circuit. For a
comprehensive assessment of these parameters across
the entire range of skin resistance, measurements
were executed using seven different resistors (4.7kΩ,
10kΩ, 22kΩ, 47kΩ, 100kΩ, 220kΩ, 470kΩ, and
1MΩ) for each of the three circuits. In each instance,
1000 samples were collected over a 5-minute interval.
The reference values assigned to each resistor were
determined with a multimeter, considering and
compensating for their 5% tolerance. The ensuing
results are tabulated in this paper. Each table lists
resistance values measured with the multimeter
alongside their corresponding conductance
measurements, the means of conductance values
measured by the prototypes, and their standard
deviations and accuracy percentages. In the provided
tables, accuracy was quantified as the percentage
deviation between the reference conductance value of
the resistors and the mean conductance value
obtained through measurement.
Consistent with the simulations, the circuit
featuring 1MΩ feedback resistors exhibits
noteworthy deviations at resistances below
approximately 60kΩ, corresponding to conductance
values exceeding 16µS. Given that normal skin
conductance can extend up to 30µS, this particular
circuit proves unsuitable for the intended
measurements.
Upon comparing the circuits with 10kΩ and
100kΩ feedback resistors, it becomes evident that the
latter demonstrates superior accuracy performance up
to conductance values of approximately 50µS, in line
with the specified range of skin conductance values.
Furthermore, it exhibits acceptable performance in
terms of standard deviation, with a maximum
deviation of 1.17%.
Consequently, based on the insights derived from
both simulations and experimental tests on the three
distinct circuits, it has been conclusively
demonstrated that the circuit featuring a 100kΩ
feedback resistor is the most suitable for the intended
measurements. Finally, to adapt to the alteration in
feedback resistance, it is imperative to adjust the
value of the capacitor connected in parallel to 1µF to
ensure the preservation of the low-pass filter effect
with a cut-off frequency of 1.6Hz.
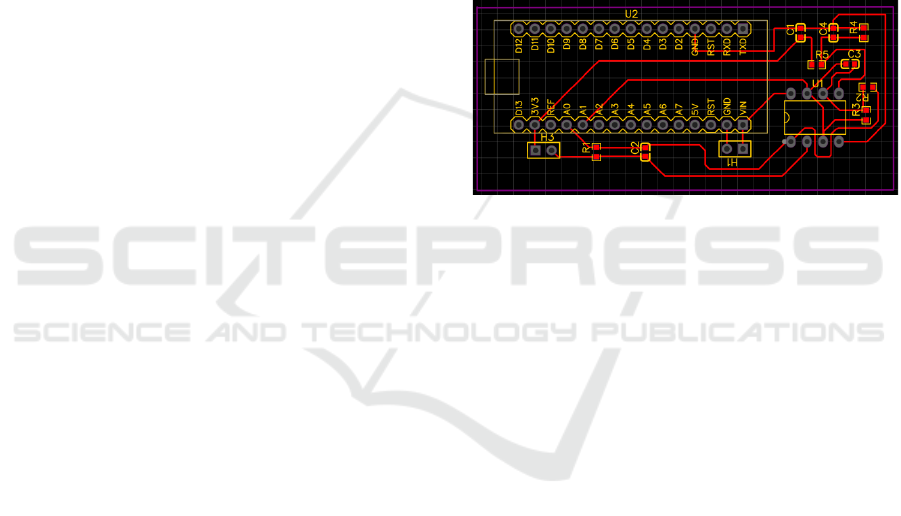
3.3 PCB Design and Fabrication
Utilizing the standard EasyEDA editor, the circuit
schematics were drafted, and employing one of the
editor's tools, these schematics were subsequently
transformed into a PCB design, depicted in figure 4.
Following this, a BOOM and Gerber file were
imported, facilitating the subsequent stages of PCB
fabrication and assembly. The manufacturing process
of the PCB board was carried out by the Chinese PCB
manufacturer JCLPCB. The ensuing assembly
procedures were executed by the manufacturer, with
the exception of the Arduino Nano board. The latter
was soldered to the PCB board personally by our
team.
Figure 4: Configuration of the final circuit PCB.
3.4 Electrode Selection,
Implementation and Optimization
Silver-silver chloride electrodes have consistently
proven to be the most suitable for recording skin
conductance (Geddes et al., 1969), and they have
been consistently recommended by experts (Fowles
et al., 1981; Boucsein et al., 2012). However, dry
usage without electrolytes applied is generally not
advised. This is because applying the electrode metal
directly to the skin can lead to gradual humidity
accumulation under the metal plate, resulting in
instability and a drift towards increased conductance
over time (Fowles et al., 1981). Hence, dry
silver/silver chloride (Ag/AgCl) electrodes may
progressively become less comfortable and
dependable, potentially leading to irritation of the
skin at the contact area.
In order to address these issues, given that long-
term electrodermal activity (EDA) measurement is still
in its early stages of development, there has been a
necessity to explore alternative electrode materials.
These materials should be capable of better
conforming to the skin's irregular shape and facilitating
seamless contact between the skin and the electrode.
Several studies (Poh et al., 2010; Banganho, 2019)
have investigated various options, including
BIODEVICES 2025 - 18th International Conference on Biomedical Electronics and Devices
192

conductive fabrics, conductive leathers, and 3D-
printed electrodes crafted from polylactic acid (PLA).
These materials have undergone rigorous testing and
comparison with the traditional Ag/AgCl dry disc
electrodes, which are considered the gold standard.
Since the referred publication of António
Bangalho's MSc thesis (2019), the developer of
MedTex P130, Shieldex
®
, has introduced new
conductive lycras that enhance their previous
offerings. One such advancement is Shieldex
®
Technik-tex P130+B, a knitted fabric metallized with
silver tailored specifically for the medical and smart
wearables industries. This material represents a
hybrid knitted fabric comprising 78% polyamide and
22% elastane. The elastane is intricately knitted in
both the warp and weft directions, rendering this
highly conductive textile stretchable on both axes and
well-suited for flexible applications in smart textiles.
Building upon its predecessors, Technik-tex P130+B
improves upon its electrical surface resistance,
decreasing from 4.2Ω/square to <2Ω/square.
Furthermore, the applied coating (+ B) safeguards the
silver against mechanical stress, a common
occurrence in wearables, aligning with the primary
purpose of the devised device. With this information
in mind, integrating this advanced conductive lycra
with Ag/AgCl dry electrodes proves to be a
significant asset for the EDA measurement circuit.
Therefore, it is the selected electrode implementation
for the intended apparatus.
Regarding electrodes contact area, as the contact
area diminishes, the potential for error due to
electrode paste seepage increases, leading to lower
conductance levels and reduced response amplitudes.
Consequently, it's advisable to avoid small contact
areas. A recommended area of 1.0 cm²
(corresponding to approximately 11 mm in diameter)
is suggested where the recording site allows. If
achieving an area of this size is not feasible, then the
maximum area permitted by the recording site should
be utilized (Fowles et al., 1981). Because of market
availability challenges, dry Ag/AgCl disc electrodes
with a diameter limit of 10 mm were ordered for the
specified device. This slight deviation from the
original plan shouldn't be of significant concern due
to its reduced size.
4 COMMUNICATION
PROTOCOL
With all device parameters set, there is the need to
establish the communication protocol for acquiring
conductance measurements from the device. This
protocol involves three key parties: the measuring
device, a remote server, and a local machine.
The first party, the measuring device, has already
been described in this report. It will communicate
with all other parties via WiFi. The next component
is the remote server, which operates through a
specific link, stores data in BigQuery, and runs a
machine learning model — all using Google Cloud
Platform services. Finally, the local machine features
a user-friendly interface that allows users to send
commands to the measuring device and receive
measured data and model predictions from the remote
server. This local machine can be a personal computer
or a smartphone with an app installed, though the app
design and implementation will be left as part of
future iterations of this project, as for now, it remains
a proof of concept.
In conclusion, the communication protocol
effectively integrates the measuring device, remote
server, and local machine, ensuring seamless data
acquisition and processing. This setup lays the
foundation for future enhancements and iterations,
particularly in developing a comprehensive
application for broader use.
5 MACHINE LEARNING
MODEL: TRAINING AND
TESTING
5.1 Dataset Selection
The final step of this project involved training and
testing a machine learning (ML) model for future
integration into the EDA measuring device.
According to the project objectives, the ML model
needs to be trained to use statistical features from the
EDA signal as input and provide predictions on the
user's stress/arousal levels based on a previously
trained stress score. To train the ML model, a dataset
containing EDA signals along with corresponding
arousal scores — either self-reported or assessed by
external observers — was required. Among the
proposed datasets, the ASCERTAIN dataset
(Subramanian et al., 2018) was deemed the most
suitable and easily accessible.
The ASCERTAIN dataset includes big-five
personality scales and emotional self-ratings from 58
users, along with synchronously recorded EDA data
and other physiological signals collected using off-
the-shelf sensors while the users watched affective
movie clips. This dataset met all the criteria for an
Wearable Electrodermal Activity Sensor for Real-Time Stress Detection Using Machine Learning
193

acceptable training and testing dataset due to its
diverse subjects and comprehensive affective movie
clips paired with self-reported arousal scores.
Before using the dataset, the EDA signals had to
be pre-processed for usability and analysis. Each time
the signal is analysed, it will be passed through a 2Hz
low-pass filter to eliminate high-frequency noise, as
recommended and tested in previous work by
Gamboa and Fred (2007).
5.2 Statistical Features Selection
Selecting the appropriate statistical features from the
EDA signals was a crucial step before training and
testing. The statistical features for this project were
based on those used in prior research by Jennifer
Healey and Rosalind Picard (2005). The initial
features included the mean and variance of the
normalized signal, the total number of SCRs (skin
conductance responses) in the analysed segment, the
sum of the magnitudes of these responses, the sum of
response durations, and the sum of the estimated areas
under these responses. The algorithm for detecting
these responses was based on the one proposed in the
PhD thesis of H. Gamboa (2008).
Finally, a statistical analysis of the features
obtained from the dataset was performed to refine
model performance. This analysis involved shuffling
the data and removing outliers, followed by an
analysis of variance (ANOVA) and a correlation
study between features.
The ANOVA results were positive, with all
features displaying very low p-values and very high
F-statistics, indicating their statistical significance.
However, the correlation study revealed a very weak
correlation – absolute correlations values always
below 0.4 – for the mean and variance of the
normalized signals with all other features.
Consequently, these two features were dropped from
the subsequent training and testing phases. This left
the model with the remaining four statistical features.
5.3 Model Selection
The XGBoost model was selected for training and
testing due to its widely acknowledged capabilities in
classification tasks. It is renowned in the literature for
its exceptional performance (Sagi and Rokach, 2021;
Chen and Fai, 2021), particularly in handling sparse
data that often contain missing values or zeros.
Moreover, XGBoost scales seamlessly from small to
large datasets, maintaining high accuracy even with
extensive data volumes.
Additionally, XGBoost integrates regularization
techniques to prevent overfitting, ensuring it captures
meaningful patterns rather than merely memorizing
the training data. It adeptly manages imbalanced
datasets and offers interpretability features that
provide insights into model decisions. Furthermore,
XGBoost effectively handles multicollinear data,
thereby ensuring robust predictions in scenarios with
correlated predictors.
Overall, XGBoost is celebrated for its versatility,
interpretability, and robustness, making it a preferred
choice for both academic research and practical
applications in classification tasks.
5.4 Model Performance
At last, training and testing of the selected model was
performed. The results from our model, including
performance metrics and cross-validation outcomes,
provide valuable insights into its effectiveness and
reliability in this task.
The model's classification report offers a
comprehensive evaluation of its predictive
performance across seven arousal categories (ranging
from 0 to 6). Precision, recall, and F1-score metrics
vary across these categories, reflecting the model's
ability to distinguish between different arousal states.
Notably, the model achieves high precision and recall
– above the 90% and for most close to 99% – for low
arousal levels (0 and 1) and the maximum arousal
level (6), indicating robust performance in identifying
extreme arousal states. However, in intermediate
arousal levels, precision and recall metrics show a
gradual decline – values fluctuate between the 50
th
and the 80
th
percentile. This suggests that the model
faces challenges in accurately predicting medium
arousal states based on the statistical features from
EDA signals.
The overall accuracy score on the test set is
approximately 77%, indicating an acceptable
performance in predicting arousal levels across the
dataset. Cross-validation results further validate this
performance, with an average accuracy score of
approximately 77% across different folds. This
consistency suggests that the model generalizes well
to unseen data, a crucial aspect for its practical
application.
In conclusion, while our model shows promising
results in predicting arousal levels from EDA signals
using statistical features, there remains room for
improvement, particularly in enhancing the
prediction accuracy for intermediate arousal states.
Future research could explore additional features to
address these challenges effectively. Nonetheless, the
BIODEVICES 2025 - 18th International Conference on Biomedical Electronics and Devices
194

demonstrated reliability in cross-validation
underscores the potential of our approach for
automated arousal level assessment, with
implications for fields such as mental health
monitoring and human-computer interaction.
6 FUTURE WORKS AND
IMPROVEMENTS
This research has laid the groundwork for the
integration of electrodermal activity (EDA)
measuring devices with machine learning models for
arousal level prediction. However, several avenues
for future work can be explored to enhance the results
and expand the application of our findings.
First, while the XGBoost model achieved an
overall accuracy of approximately 77%, there is room
for improvement, particularly in accurately predicting
intermediate arousal states. Future studies could focus
on experimenting with alternative machine learning
algorithms, such as deep learning models or ensemble
methods, to improve prediction accuracy across all
arousal levels.
Second, expanding the feature set used for
training the machine learning model may lead to
better classification performance. Investigating
additional physiological signals, such as heart rate
variability (HRV) or environmental variables, could
provide a more comprehensive understanding of
stress and arousal levels.
Conducting longitudinal studies to assess the
effectiveness of the wearable device in real-life
situations is essential. Future research can involve
testing the device across various contexts — such as
workplaces, social gatherings, or during relaxation
exercises — to provide insights into its usability and
effectiveness in actual settings.
Additionally, creating an engaging and intuitive
user interface for the application would enhance user
experience. Incorporating features like real-time
feedback, personalized stress management
recommendations, and tracking capabilities could
significantly increase user engagement and utility.
Exploring novel electrode materials or
configurations could further enhance comfort and
accuracy in skin conductance measurements.
Comparative studies of different materials will help
optimize the design for diverse user needs.
Moreover, incorporating our device with other
products presents an exciting opportunity to gain
valuable insights into users' arousal states, which can
significantly enhance their interactive experiences
with those products. By integrating the wearable
sensor with applications in gaming, virtual reality
(VR) environments, or even automotive systems, we
can adapt these experiences in real time based on the
users' emotional and physiological responses. For
instance, gaming applications could adjust difficulty
levels or narrative elements depending on the player's
stress or excitement levels, creating a more
immersive and tailored experience. Similarly, in VR
settings, the content could dynamically shift to either
calm or engage users based on their arousal state,
promoting emotional well-being. In the context of
driving, our device could trigger alerts or adjustments
to vehicle settings to enhance safety or comfort based
on detected stress levels. This adaptability not only
enriches user experience but also fosters improved
human-computer interaction by ensuring that
technology aligns more closely with the emotional
needs of its users.
Finally, in the course of our experiments
measuring skin conductance using different
configurations of the circuit from Poh et al. (2010) on
the wrists of some team members, we observed an
intriguing phenomenon. The typical EDA signal,
consisting of its tonic and phasic components,
appeared to be modulated by a distinct periodic
signal. Upon analysing this modulation, we
concluded that it is likely associated with the heart
rate of our team members.
This discovery opens up a promising direction for
future iterations of our device. By utilizing this
modified configuration of the original circuit, we
could develop a wearable device capable of
simultaneously measuring both electrodermal activity
(EDA) and heart rate variability (HRV) signals.
Incorporating HRV measurements alongside EDA
could significantly enhance the accuracy of stress
detection, as both physiological metrics provide
complementary insights into the body’s stress
response. This two-in-one measurement capability
could lead to more nuanced and effective stress
management applications, ultimately offering users a
better understanding of their emotional and
physiological states.
By pursuing these avenues, future research can
further enhance the utility of EDA measurements in
mental health monitoring and provide innovative
solutions for stress management and emotional well-
being.
Wearable Electrodermal Activity Sensor for Real-Time Stress Detection Using Machine Learning
195

7 CONCLUSION
This paper successfully demonstrated the integration
of an electrodermal activity (EDA) measuring device
with a robust communication protocol and a machine
learning model for stress and arousal level prediction.
By selecting the most suitable materials and
configurations for the device, including the use of a
100kΩ feedback resistor and silver-silver chloride
electrodes, we ensured accurate and reliable
conductance measurements.
The communication protocol effectively linked
the measuring device, a remote server, and a local
machine, facilitating seamless data acquisition and
processing. This setup serves as a foundation for
future developments, particularly in creating a
comprehensive application for broader usage.
The machine learning model, trained using the
ASCERTAIN dataset and implemented with the
XGBoost algorithm, achieved an overall accuracy of
approximately 77% in predicting arousal levels.
Despite challenges in accurately predicting
intermediate arousal states, the model's acceptable
precision and recall for extreme arousal levels
underscore its potential for practical applications in
mental health monitoring and human-computer
interaction.
Overall, the project lays a solid groundwork for
future enhancements and iterations, with significant
implications for the automated assessment of arousal
levels and related applications. Future research
should focus on improving model performance for
intermediate arousal states and exploring additional
features to enhance prediction accuracy.
Additionally, future research should also focus on
implementing this device in a useful application
where it enhances human-computer interaction or
daily stress monitoring. This will not only validate the
practical utility of the device but also pave the way
for its integration into everyday technologies aimed
at improving emotional well-being and user
experience.
REFERENCES
Boucsein, W., Fowles, D. C., Grimnes, S., Ben-Shakhar,
G., roth, W. T., Dawson, M. E., Filion, D. L., & Society
for Psychophysiological Research Ad Hoc Committee
on Electrodermal Measures (2012). Publication
recommendations for electrodermal measurements.
Psychophysiology, 49(8), 1017–1034. https://doi.org/
10.1111/j.1469-8986.2012.01384.x.
Banganho, A. F. R. (2019). Electrodermal activity sensor
(EDA) with adaptive gain control (Master's thesis,
Instituto Superior Técnico).
Bonato, P. (2003). Wearable sensors/systems and their
impact on biomedical engineering. IEEE Engineering
in Medicine and Biology Magazine, 22(3), 18–20.
https://doi.org/10.1109/memb.2003.1213622
Chen, Z., & Fan, W. (2021). A freeway travel time
prediction method based on an XGBOOST model.
Sustainability, 13(15), 8577. https://doi.org/10
.3390/su13158577
Fowles, D. C., Christie, M. J., Edelberg, R., Grings, W. W.,
Lykken, D. T., & Venables, P. H. (1981). Publication
recommendations for electrodermal measurements.
Psychophysiology, 18(3), 232–239. https://doi.org/
10.1111/j.1469-8986.1981.tb03024.x
Gamboa, H.F., Fred, A.L., & Telecomunicações, I.D.
(2007). An Electrodermal Activity Psychophysiologic
Model Gamboa, H. F. S. (2008). Multi-modal
behavioral biometrics based on HCI and
electrophysiology. (Doctoral dissertation, Universidade
Técnica de Lisboa).
Geddes, L. A., Baker, L. E., & Moore, A. G. (1969).
Optimum electrolytic chloriding of silver electrodes.
Medical & Biological Engineering, 7(1), 49–56. https://
doi.org/10.1007/bf02474669
Grimnes, S., & Martinsen, Ø. G. (2015). Bioimpedance and
bioelectricity basics. In Elsevier eBooks.
https://doi.org/10.1016/c2012-0-06951-7
Healey, J., & Picard, R. (2005). Detecting stress during
Real-World driving tasks using physiological sensors.
IEEE Transactions on Intelligent Transportation
Systems, 6(2), 156–166. https://doi.org/10.1
109/tits.2005.848368
Malmivuo, J. (1995). The electrodermal response. In
Oxford University Press eBooks (pp. 428–434).
https://doi.org/10.1093/acprof:oso/9780195058239.00
3.0027
Van Dooren, M., De Vries, J., & Janssen, J. H. (2012).
Emotional sweating across the body: Comparing 16
different skin conductance measurement locations.
Physiology & Behavior, 106(2), 298–304.
https://doi.org/10.1016/j.physbeh.2012.01.020
Poh, N. M., Swenson, N. C., & Picard, R. W. (2010). A
wearable sensor for unobtrusive, Long-Term
assessment of electrodermal activity. IEEE
Transactions on Biomedical Engineering, 57(5), 1243–
1252. https://doi.org/10.1109/tbme.2009.2038487
Subramanian, R., Wache, J., Abadi, M. K., Vieriu, R. L.,
Winkler, S., & Sebe, N. (2016). ASCERTAIN:
Emotion and personality recognition using commercial
sensors. IEEE Transactions on Affective Computing,
9(2), 147–160. https://doi.org/10.1109/taffc.
2016.2625250
Sagi, O., & Rokach, L. (2021). Approximating XGBoost
with an interpretable decision tree. Information
Sciences, 572, 522–542. https://doi.org/10.1016/j.
ins.2021.05.055
BIODEVICES 2025 - 18th International Conference on Biomedical Electronics and Devices
196
