
Predicting Photovoltaic Power Output Using LSTM: A Comparative
Study Using both Historical and Climate Data
Fereshteh Jafari
1,2 a
, Joseph Moerschell
1 b
and Kaspar Riesen
2 c
1
Institute of System Engineering, University of Applied Sciences and Arts Western Switzerland, Sion, Switzerland
2
Institute of Computer Science, University of Bern, CH-3012 Bern, Switzerland
Keywords:
LSTM, Meteorological Data Integration, Photovoltaic Power Prediction, Prediction Horizon Assessment,
Temporal Sliding Window Analysis.
Abstract:
Accurate photovoltaic (PV) power output prediction is important for efficient energy management in solar
power systems. This study explores the benefits and limitations of Long Short-Term Memory (LSTM) net-
works in predicting PV power using three distinct approaches, namely using historical PV power data, climate
data, and a combination of both, all with timestamps. The performance of these methods is evaluated across
different prediction horizons of 10, 30, and 50 minutes ahead. Additionally, the impact of the sliding window
size, representing the amount of past data used for training, is analyzed. The models are trained and tested
on a dataset collected over three months from a rooftop PV system in Sion, Switzerland, with a maximum
power of 22.2 kW. The Root Mean Square Error as well as the R
2
metrics are provided to assess the accuracy
of each method. The results demonstrate that both the choice of the actual input data and the sliding window
size significantly influence the prediction accuracy. In particular, the results presented here show the potential
of combining different data sources to improve the accuracy of PV power prediction using LSTM models.
1 INTRODUCTION
1.1 Problem Definition
Solar power stands out due to its cleanliness, wide
availability, and scalability. However, photovoltaic
(PV) power output is inherently variable across mul-
tiple timescales due to factors such as geographical
location, as well as the size, orientation and technol-
ogy of the panels. Moreover, environmental condi-
tions like solar irradiance, temperature, cloud cover,
wind, and humidity crucially influence PV power out-
put (Pelland et al., 2013), (Pedro and Coimbra, 2012).
These characteristics pose significant challenges for
grid stability and energy management (Chen and
Chang, 2021). Moreover, according to the World
Energy Outlook 2024 by the International Energy
Agency, global energy demand is expected to increase
by approximately 16% by 2050 under the Stated Poli-
cies Scenario (International Energy Agency, 2024).
However, if energy efficiency measures are not en-
a
https://orcid.org/0000-0001-6049-6536
b
https://orcid.org/0000-0003-3072-6075
c
https://orcid.org/0000-0002-9145-3157
hanced, this demand could rise by about 22% over
the same period. Accurate short-term PV power fore-
casts are thus critical not only for operational effi-
ciency but also for effective energy storage, load con-
trol, and system reliability contributing to the broader
goals of energy conservation, sustainability, and cli-
mate change mitigation (Park et al., 2021). Conse-
quently, the development of robust predictive models
for PV power generation throughout the day is impor-
tant to address these challenges.
1.2 State of the Art
Prediction methods for PV power output span from
traditional approaches like persistence, physical, and
statistical models, which use both current PV data
and weather data, to more sophisticated models that
employ artificial intelligence (AI). Persistence models
commonly rely on present data for immediate predic-
tions (Wang et al., 2021), (Dash et al., 2021), while
physical models incorporate weather variables (Lima
et al., 2016). Statistical models (Wang et al., 2022),
such as ARMA (Benmouiza and Cheknane, 2016)
and ARIMA (Reikard, 2009), struggle with nonsta-
tionary and nonlinear data, limitations that more ad-
Jafari, F., Moerschell, J. and Riesen, K.
Predicting Photovoltaic Power Output Using LSTM: A Comparative Study Using both Historical and Climate Data.
DOI: 10.5220/0013258000003905
In Proceedings of the 14th International Conference on Pattern Recognition Applications and Methods (ICPRAM 2025), pages 733-740
ISBN: 978-989-758-730-6; ISSN: 2184-4313
Copyright © 2025 by Paper published under CC license (CC BY-NC-ND 4.0)
733

vanced AI models aim to overcome (Kumbhar et al.,
2021).
AI technologies, including machine learning
(ML), are important to improve building energy man-
agement systems as well as energy efficiency. ML
can broadly be divided into several branches, includ-
ing supervised and unsupervised learning, reinforce-
ment learning, and deep learning (Mellit et al., 2020).
Among these, supervised learning is the most preva-
lent approach in ML, where models are trained on la-
beled datasets that include both predictors and pre-
dictands (Markovics and Mayer, 2022). The over-
all goal of supervised learning is to identify the op-
timal functional relationship between input variables
and outputs, enabling accurate predictions. Super-
vised ML problems can generally be divided into two
categories, viz. classification, which deals with cate-
gorical outputs, and regression, which addresses con-
tinuous outputs. PV power prediction, specifically, is
categorized as a regression problem due to its focus
on predicting continuous power output values (Wang
et al., 2023).
Common ML models used for PV power predic-
tions include artificial neural networks (ANN), sup-
port vector regression (SVR), k-nearest neighbors
(KNN) regression, as well as linear regression (Mel-
lit et al., 2020). While ANN models can capture
complex nonlinear relationships by utilizing large
datasets, they may often not fully address the dy-
namic characteristics of PV power generation, which
is influenced by various temporal factors (Meenal and
Selvakumar, 2018). As a result, alternative methods
such as SVR and KNN also attempt to model these
nonlinear relationships, but they can struggle with
the inherent time-dependent nature of the data (Wang
et al., 2017), (Liu et al., 2018), and (Mohammadi
et al., 2015). Deep learning models like recurrent
neural networks (RNNs) and long-short term memory
(LSTM) effectively address these challenges by cap-
turing sequential dependencies in data. While RNNs
excel in time-series prediction, they struggle with is-
sues like vanishing gradients, LSTMs may overcome
these problems, thereby enhancing the accuracy of
PV power prediction (Wang et al., 2020), (Wang et al.,
2019).
The superiority of LSTM models over other ML
methods for the prediction of PV power has been em-
pirically proven in several studies. In (Gao et al.,
2019), for instance, two distinct LSTM-based predic-
tion models tailored for ideal and non-ideal weather
conditions are introduced. For ideal weather, the
model leverages numerical weather prediction data
with seasonal adjustments, achieving an RMSE ac-
curacy of 4.62%. For non-ideal weather conditions,
the model integrates a discrete grey model to predict
daily total power, enhancing the LSTM’s accuracy in
scenarios such as rainy, cloudy, and overcast days. In
a second study, a one-hour ahead prediction of PV
power using historical PV power data only is pro-
posed (Abdel-Nasser and Mahmoud, 2019). The au-
thors compare the performance of the LSTM model
with three PV prediction methods for stationary time
series. Then, in (Hu et al., 2024) historical PV power
data and climate data is used separately to predict
the PV power. Results show that the use of climate
data leads in general to better results with a smaller
RMSE and the highest R
2
values. Finally, the impor-
tance of selecting predictors based on model archi-
tecture in solar energy forecasting is highlighted in
(Ciobanu et al., 2024). A dual-view LSTM model,
using both historical and future weather data, out-
performs a single-view model that only uses histor-
ical PV production and past weather data. Humidity
consistently emerges as an important predictor across
both models, underscoring the value of future weather
data in enhancing predictive accuracy.
1.3 Contribution
While several studies demonstrate the potential of
LSTMs in the domain of PV power prediction, they
often focus on single data sources or overlook the in-
fluence of input data configurations on prediction ac-
curacy (e.g., the sliding window size). The present
paper provides a time-series prediction that seeks to
bridge these gaps. First, we thoroughly evaluate the
performance of LSTM models trained with differ-
ent data sources—past PV power, climate data, and
their combination—across multiple prediction hori-
zons and discuss on how these inputs effect the pre-
dictions. Second, the study also examines the effect
of varying sliding window sizes on the prediction ac-
curacy. That is, we provide a nuanced understanding
of how temporal context influences predictive perfor-
mance by providing empirical evidence using real-
world PV power data (adding practical relevance to
the findings of this paper).
1.4 Paper Organization
The remainder of this paper is organized as follows.
Section 2 outlines the methodology of the work, in-
cluding data type and preparation. Section 3 presents
the predictive model architecture. In Section 4 we
show and discuss the experimental results. Finally,
Section 5 concludes the paper with key insights.
ICPRAM 2025 - 14th International Conference on Pattern Recognition Applications and Methods
734

2 METHODOLOGY
2.1 Long-Short Term Memory Network
(LSTM)
One of the major advantages of RNNs is their ca-
pacity to incorporate contextual information when
mapping between input and output sequences, mak-
ing them particularly suitable for sequence predic-
tion tasks. However, traditional RNNs face a limi-
tation in effectively accessing long-term context, as
the influence of a given input decays or amplifies ex-
ponentially with each recurrence, leading to what is
known as the vanishing or exploding gradient prob-
lem (Graves, 2012). Figure 1 shows a simple RNN
containing a single, self connected hidden layer.
Figure 1: A simple RNN containing a single, self connected
hidden layer (Graves, 2012).
LSTM networks (Hochreiter and Schmidhuber,
1997) are a type of RNN designed to handle long-
term dependencies using memory blocks instead of
traditional neurons. These blocks incorporate forget,
input, and output gates to manage the flow of informa-
tion, addressing gradient decay and explosion issues.
This makes LSTMs highly effective for sequence pre-
diction tasks, such as PV power prediction, where
capturing long-term patterns is crucial.
Figure 2(a) illustrates a single-cell LSTM mem-
ory block, showing how an LSTM network structure
differs from a standard RNN by substituting the sum-
mation units in the hidden layer with memory blocks,
as seen in Figure 2(b). Although ordinary summa-
tion units can be combined with LSTM blocks, this
is generally unnecessary. Additionally, LSTM net-
works utilize the same output layers as those in stan-
dard RNNs (Graves, 2012).
Training of LSTM networks is conducted through
backpropagation through time, which allows the net-
work to learn from sequential data by minimizing the
prediction error over multiple time steps.
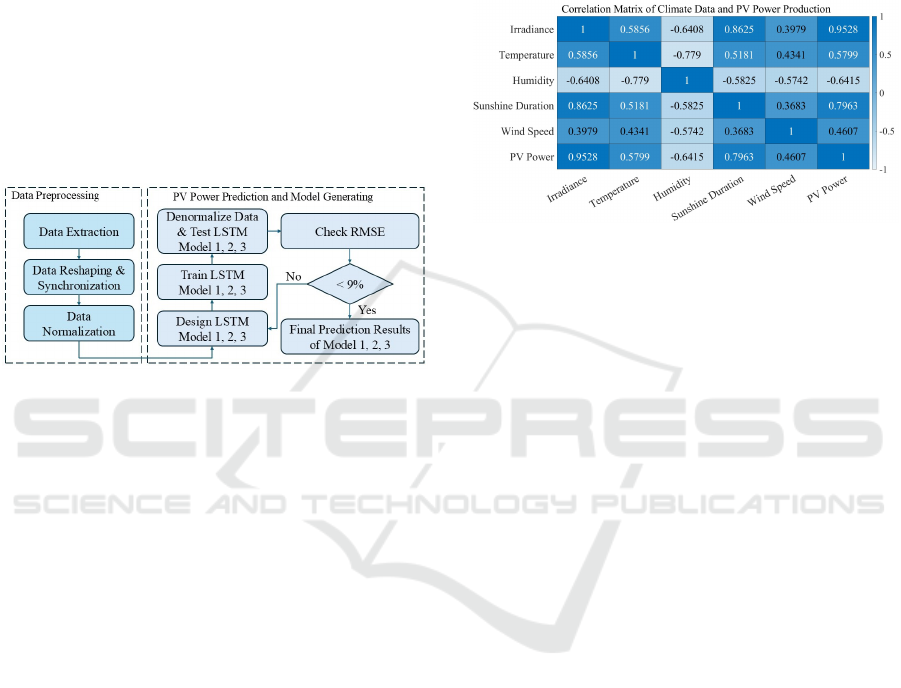
2.2 Description of the PV Power System
In this section we briefly describe the PV power gen-
eration system used in this study, located at the au-
thors’ institution rooftop in Sion, Switzerland. Part of
the setup is shown in Figure 3. The PV system has an
installed maximum power of 22.2 kW and comprises
multiple solar panels positioned to capture maximum
sunlight throughout the day. The PV array consists of
60 individual solar panels, each with a rated power of
370 W. The PV modules use mono-crystalline silicon
technology. There are two AMPT converters feeding
a DC bus operating at 760 V. This DC bus connect
different loads and storage batteries. Table 1 summa-
rizes the specifications of an individual PV panel.
2.3 Data Collection and Preprocessing
This study uses real-time climate data from Me-
teoSwiss, including solar irradiance, temperature,
wind speed, humidity, and sunshine duration,
recorded at 10-minute intervals in Sion, Switzer-
land, from July 5 to September 30, 2024. The PV
power production data, unique to this research, is ob-
tained from a platform developed at GridLab, HES-
SO Valais, and synchronized with the climate data
for time-series analysis. Comprehensive data prepro-
cessing is manually conducted, including checks for
missing values, synchronization of climate data with
PV power output, and normalization. This study also
considers timestamps as features to train the model.
2.4 Sliding Window and Prediction
Horizons
Major goal of this paper is to predict the PV power
output at different prediction horizons, viz. 10, 30,
and 50 minutes into the future. These prediction
horizons are selected to provide short-term forecasts,
which are valuable for real-time grid management and
energy planning. To achieve these predictions, we uti-
lize a sliding window approach in the LSTM model,
where the length of historical data used for prediction
(i.e., the sliding window) varies between 60 and 20
minutes. The chosen window size potentially influ-
ences the model’s accuracy, as it dictates the amount
of past information utilized to make each prediction.
Moreover, it is highly dependent on the type of data
actually employed to predict the PV power. In this
study, we consider three different types of data:
• Climate data
• Historical PV power data
• Combination of climate data and historical PV
power data
Predicting Photovoltaic Power Output Using LSTM: A Comparative Study Using both Historical and Climate Data
735
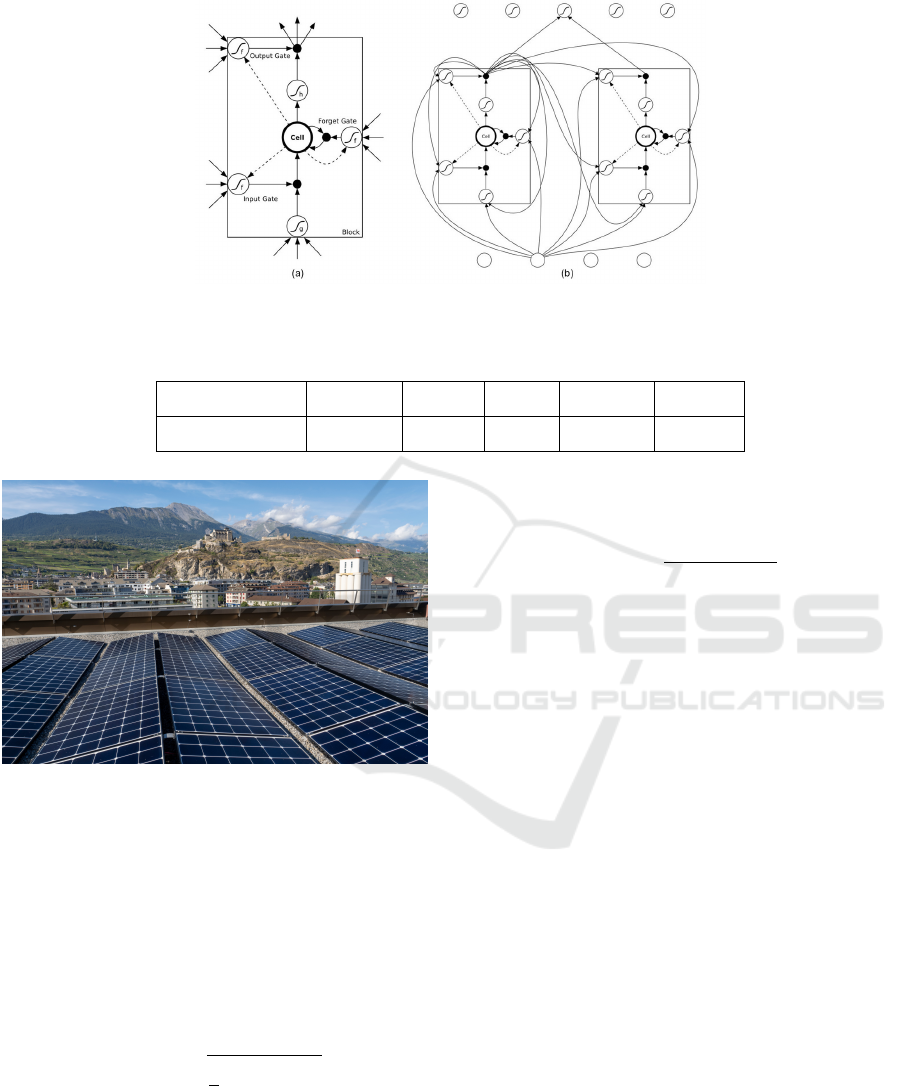
Figure 2: An LSTM network, (a) memory block with one cell, (b) with four input units, a hidden layer of two single-cell
LSTM memory blocks and five output units (Graves, 2012).
Table 1: Specifications of an individual PV panel used in this study.
Modules P
max
(W ) V
oc
(V ) I
sc
(A) V
mpp
(V ) I
mpp
(A)
LG370Q1C-V5 370 42.8 10.82 37.0 10.01
Figure 3: The studied system in Sion, Switzerland.
2.5 Evaluation Metrics
The Root Mean Square Error (RMSE) serves as a
widely recognized metric for regression model evalu-
ation. The RMSE is, for instance, employed as a stan-
dard statistical metric to assess model performance in
fields such as meteorology, air quality, and climate
research (Hodson, 2022). For a sample of n observa-
tions y (y
i
, i = 1, 2, ..., n), and n corresponding model
predictions ˆy, the RMSE is defined as
RMSE =
s
1
n
n
∑
i=1
(y
i
− ˆy
i
)
2
(1)
For PV power prediction, RMSE provides a clear
indication of the overall model accuracy (the smaller
the RMSE value, the better the model).
The coefficient of determination R
2
is another
widely used metric in regression model evaluation
due to its intuitive interpretability (despite not always
being the primary criterion for model selection). For-
mally, the R
2
coefficient is defined as follows
R
2
= 1 −
∑
n
i=1
(y
i
− ˆy
i
)
2
∑
n
i=1
(y
i
− ¯y)
2
, (2)
where y
i
represents the observed values, ˆy
i
the pre-
dicted values, ¯y is the mean of the observed values,
and n is the number of observations.
The R
2
coefficient indicates the proportion of vari-
ance in the observed data that is predictable from the
independent variables, making it valuable in under-
standing the model’s real-world applicability (Gao,
2024). An R
2
value closer to 1 suggests a model that
better captures the underlying patterns of the data.
3 PROPOSED WORK:
PREDICTIVE MODEL
This section describes the modeling approach for pre-
dicting PV power output using various input data
sources and the LSTM model’s structure. It outlines
three prediction models designed to assess the im-
pact of different data sources on prediction accuracy,
as discussed in Section 2.4. Additionally, it details
the LSTM model architecture and training procedures
specific to each model.
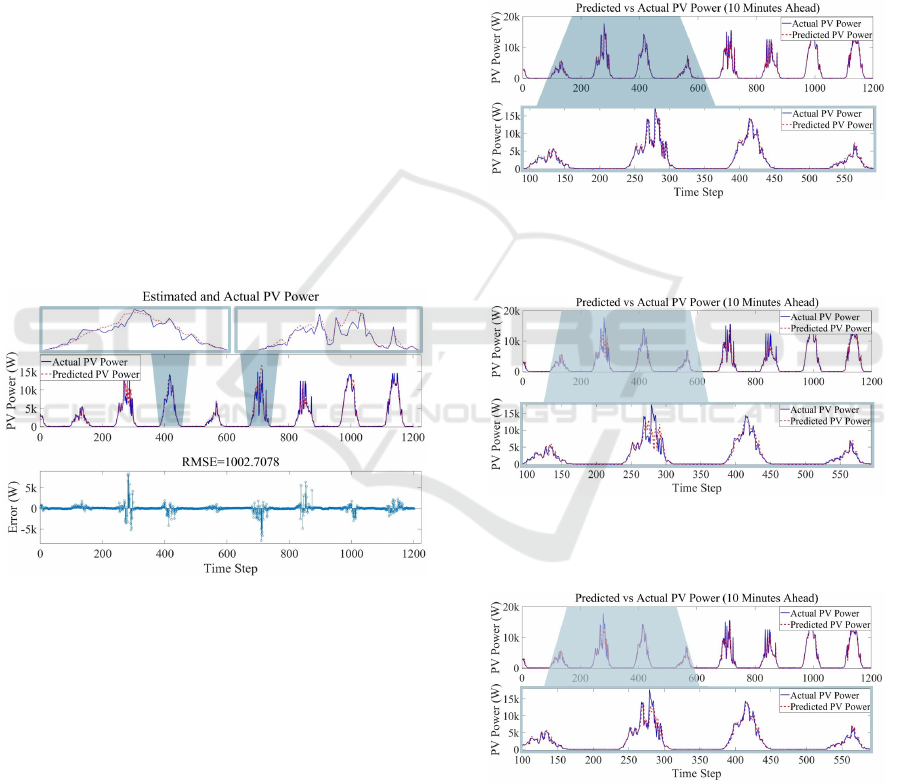
Figure 4 presents an overview of the entire mod-
eling process in a flowchart format. The modeling
process is split in two major phases, the data prepro-
cessing and the PV power prediction. The PV power
prediction phase is thoroughly explained in the next
subsection.
ICPRAM 2025 - 14th International Conference on Pattern Recognition Applications and Methods
736
The preprocessing consists of two steps. The
first step involves checking for missing entries in
both the PV power output and climate data to iden-
tify gaps and address inconsistencies. In the climate
dataset, recorded at 10-minute intervals, missing val-
ues are rare and only occur between two recorded
points. These missing entries are imputed with the
mean of the preceding and succeeding values, ensur-
ing a smooth temporal continuity in the climate data.
PV power output data, is originally recorded every
minute. Thus, the second step consist of synchroniza-
tion with the climate data to maintain consistent in-
tervals across datasets. To match the 10-minute inter-
vals of the climate data, the average PV power is cal-
culated over each 10-minute span, starting from the
same timestamp as the climate dataset.
Figure 4: Flowchart of the LSTM model.
3.1 Prediction Models
Three models are developed to predict PV power out-
put for 10, 30, and 50-minute horizons using different
input data to assess their impact on prediction accu-
racy.
3.1.1 Model 1: PV Power-Only Prediction
Model 1 uses historical PV power data as the sole
input for predicting future PV power output. By
leveraging the temporal patterns in past PV power
values, this model aims to understand the degree to
which prior PV output data alone can predict short-
term power generation. This model assumes that PV
power generation is somewhat self-correlated, captur-
ing daily cycles and other temporal patterns without
the influence of weather variables.
3.1.2 Model 2: Climate Data-Only Prediction
Model 2 is based exclusively on climate data, which
includes features such as solar irradiance, tempera-
ture, wind speed, humidity, and sunshine duration.
These features are collected from the MeteoSwiss
database at a 10-minute interval and synchronized
with the actual PV output data. By using climate
data only, this model evaluates the predictive power
of environmental conditions on PV generation, inde-
pendent of past PV power values. Climate data is of-
ten highly correlated with PV output, making it a key
predictor of solar energy production.
According to the correlation analysis provided in
Figure 5, we can see that irradiance and sunshine du-
ration are the most effective inputs in this endeavor
with correlations of about 0.95 and 0.80, respectively.
Figure 5: Correlation map between climate data and PV
power production.
3.1.3 Model 3: Combined Data Prediction
Model 3 combines both past PV power and climate
data to improve the prediction accuracy by integrat-
ing both temporal patterns and environmental influ-
ences. This approach leverages the complementary
information between historical PV production data
and weather conditions, aiming to capture complex
relationships that could affect the PV output.
3.2 LSTM Model Architecture
Each of the three models shares a similar LSTM ar-
chitecture, differing only in the input layer based on
the data configuration. The architecture includes four
LSTM layers with 50 hidden units, for learning tem-
poral dependencies and capturing patterns. A fully
connected layer translates LSTM features to the re-
gression output layer, which produces continuous PV
power predictions.
3.3 Training Procedure
Each model is trained using backpropagation through
time to optimize the weights, with the goal of mini-
mizing the prediction error. The complete dataset is
divided into training and testing subsets, with 90% of
the data used for training and 10% for testing. To
train the LSTM model, the Adam optimizer is used
(known for its efficiency and adaptability, especially
in handling noisy data and sparse gradients (Diederik,
2014)). The model is trained for a maximum of 200
epochs with an initial learning rate of 0.01 to balance
Predicting Photovoltaic Power Output Using LSTM: A Comparative Study Using both Historical and Climate Data
737
between convergence speed and stability during the
training.
4 RESULTS AND DISCUSSION
This section presents an analysis of the performance
of the three LSTM models under the discussed con-
figurations.
4.1 Estimation Model
The performance of Model 2, which predicts PV
power using only current climate data (horizon = 0), is
analyzed. Figure 6 shows estimated versus actual PV
power, with stem plots and RMSE values quantifying
performance. The model accurately distinguishes be-
tween day and night, with no errors at night, and fol-
lows daytime PV power closely, maintaining a mean
deviation below 1.5 kW in over 90% of cases. This
proof of concept demonstrates that estimating current
PV power using weather data is feasible. Future ex-
periments will explore prediction horizons of 10, 30,
and 50 minutes.
Figure 6: Results of the LSTM model to estimate the PV
power with climate data and time stamps tested for 9 days
with the stem plot and an RMSE of about 1kW.
4.2 Comparative Analysis of Prediction
Models
The effectiveness of each prediction model is evalu-
ated by comparing actual versus predicted PV power
values for models 1, 2, and 3, as shown in Figures
7, 8, and 9. All models use the past 20 minutes
of PV power data, climate data, their combination,
and timestamps to predict PV power for a 10-minute
horizon. While all models perform well, the model
combining historical data with climate data generally
yields the best results in qualitative analysis.
The three LSTM models are also used to predict
PV power for 30 and 50 minutes ahead. The RMSE
and R
2
values are shown in Figure 10 and 11, re-
spectively. The results indicate that, across all pre-
diction horizons, utilizing a combination of histori-
cal PV power data and climate data consistently leads
to more accurate PV power predictions. That is, this
combined approach appears to enhance the model’s
ability to capture both short-term trends from recent
PV output and underlying patterns influenced by cli-
matic conditions, resulting in generally improved pre-
diction accuracy.
Figure 7: A LSTM model to predict the PV power with
historical data and timestamps with prediction horizon of
10 minutes.
Figure 8: A LSTM model to predict the PV power with
climate data and timestamps with prediction horizon of 10
minutes.
Figure 9: A LSTM model to predict the PV power with his-
torical, climate data and timestamps with prediction horizon
of 10 minutes.
ICPRAM 2025 - 14th International Conference on Pattern Recognition Applications and Methods
738
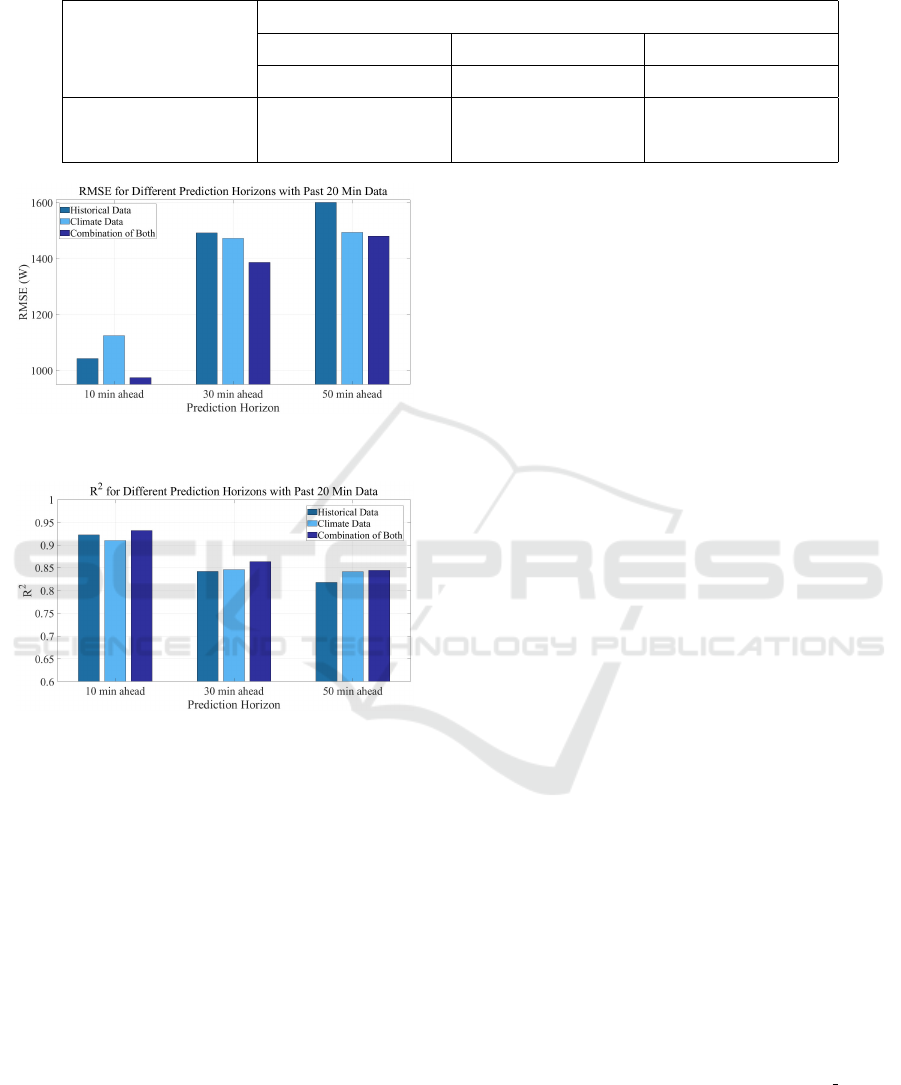
Table 2: Performance metrics for PV power prediction using a combination of historical and climate data across two sliding
window sizes are presented, with the best results highlighted in bold.
Combination of both data
Window sizes
Predict 10 min ahead Predict 30 min ahead Predict 50 min ahead
RMSE (%) R
2
RMSE (%) R
2
RMSE (%) R
2
20 min 4.39 0.93 6.25 0.86 6.67 0.84
60 min 4.50 0.93 6.52 0.85 7.19 0.82
Figure 10: RMSE values for different LSTM models to pre-
dict the PV power.
Figure 11: R
2
values for different LSTM models to predict
the PV power, starting from 0.6.
4.3 Impact of Sliding Window Size
An additional experiment evaluates the impact of a
60 minutes sliding window size compared to the 20-
minute window used previously. The results of this
experiment are shown in Table 2, where we present
the RMSE and R
2
values for both window sizes,
namely 20 and 60 minutes (for the sake of simplic-
ity, we only show the results of combining both in-
puts, historical data, and climate data – similar effects
are to be expected for the individual data sets). We
find that for small prediction horizon (20-minute), the
results are slightly better. However, for longer predic-
tion horizon (60-minute), the higher RMSE and lower
R
2
values for the 60-minute window size are clear.
The nonlinear and highly oscillatory nature of climate
data apparently results in suboptimal model training
at long prediction horizons when a larger moving win-
dow is used. Perhaps when a shadow passes, it is
more important to detect the start of the shadow than
to remember what happened in the last 60 minutes
(and the beginning of the shadow can best be recog-
nized based on the current and past PV power gen-
eration values). Overall, these results suggest that
a smaller sliding window can better capture relevant
short-term dependencies when predicting PV power
in longer prediction horizons.
5 CONCLUSIONS
This paper investigates the accuracy of PV power
prediction using LSTM models trained with differ-
ent datasets, namely historical PV power data, climate
data, a combination of both all with timestamps. Pre-
diction horizons of 10, 30, and 50 minutes are ex-
plored to assess model performance under varying
conditions, and two different sliding window sizes
are considered to show the effect of time and data
type in prediction. Results indicate that RMSE val-
ues increase as the prediction horizon extends. The
combined dataset of PV power and climate data with
timestamps consistently yields lower RMSE values
compared to using either dataset individually, indicat-
ing that integrating diverse data sources enhances pre-
diction accuracy. The results also underscore the im-
portance of selecting an appropriate sliding window
size. These findings contribute valuable insights into
optimizing LSTM models for short-term PV power
prediction, with practical implications for real-world
solar energy prediction.
ACKNOWLEDGEMENTS
This research is funded by the Swiss National Science
Foundation (SNSF) under grant no. 10CE-1
216893
in cooperation with CETPartnership, under Joint Call
2022 for research proposals, Increasing control and
efficiency in regional energy systems using quantum
sensors and machine learning – QuantumIRES, UE-
FISCDI PNCDI IV.
Predicting Photovoltaic Power Output Using LSTM: A Comparative Study Using both Historical and Climate Data
739

REFERENCES
Abdel-Nasser, M. and Mahmoud, K. (2019). Accurate pho-
tovoltaic power forecasting models using deep LSTM-
RNN. Neural Comput. Appl., 31(7):2727–2740.
Benmouiza, K. and Cheknane, A. (2016). Small-scale so-
lar radiation forecasting using arma and nonlinear au-
toregressive neural network models. Theoretical and
Applied Climatology, 124:945–958.
Chen, H. and Chang, X. (2021). Photovoltaic power predic-
tion of lstm model based on pearson feature selection.
Energy Reports, 7:1047–1054.
Ciobanu, A., Bacanin, N., Sanders, T., and Stoean, C.
(2024). Assessing predictor influence in lstm mod-
els for enhanced solar energy forecasting. In Pro-
ceedings of the 26th International Symposium on Sym-
bolic and Numeric Algorithms for Scientific Comput-
ing (SYNASC).
Dash, D. R., Dash, P., and Bisoi, R. (2021). Short term solar
power forecasting using hybrid minimum variance ex-
panded rvfln and sine-cosine levy flight pso algorithm.
Renewable Energy, 174:513–537.
Diederik, P. K. (2014). Adam: A method for stochastic
optimization. (No Title).
Gao, J. (2024). R-squared (r2)–how much variation is ex-
plained? Research Methods in Medicine & Health
Sciences, 5(4):104–109.
Gao, M., Li, J., Hong, F., and Long, D. (2019). Day-ahead
power forecasting in a large-scale photovoltaic plant
based on weather classification using lstm. Energy,
187:115838.
Graves, A. (2012). Long short-term memory. Supervised
sequence labelling with recurrent neural networks,
pages 37–45.
Hochreiter, S. and Schmidhuber, J. (1997). Long short-term
memory. Neural Comput., 9(8):1735–1780.
Hodson, T. O. (2022). Root mean square error (rmse)
or mean absolute error (mae): When to use them or
not. Geoscientific Model Development Discussions,
2022:1–10.
Hu, Z., Gao, Y., Ji, S., Mae, M., and Imaizumi, T. (2024).
Improved multistep ahead photovoltaic power pre-
diction model based on lstm and self-attention with
weather forecast data. Applied Energy, 359:122709.
International Energy Agency (2024). World energy outlook
2024.
Kumbhar, A., Dhawale, P. G., Kumbhar, S., Patil, U., and
Magdum, P. (2021). A comprehensive review: Ma-
chine learning and its application in integrated power
system. Energy Reports, 7:5467–5474.
Lima, F. J., Martins, F. R., Pereira, E. B., Lorenz, E., and
Heinemann, D. (2016). Forecast for surface solar irra-
diance at the brazilian northeastern region using nwp
model and artificial neural networks. Renewable En-
ergy, 87:807–818.
Liu, L., Zhao, Y., Chang, D., Xie, J., Ma, Z., Sun, Q., Yin,
H., and Wennersten, R. (2018). Prediction of short-
term pv power output and uncertainty analysis. Ap-
plied energy, 228:700–711.
Markovics, D. and Mayer, M. J. (2022). Compari-
son of machine learning methods for photovoltaic
power forecasting based on numerical weather pre-
diction. Renewable and Sustainable Energy Reviews,
161:112364.
Meenal, R. and Selvakumar, A. I. (2018). Assessment of
svm, empirical and ann based solar radiation predic-
tion models with most influencing input parameters.
Renewable Energy, 121:324–343.
Mellit, A., Massi Pavan, A., Ogliari, E., Leva, S., and Lughi,
V. (2020). Advanced methods for photovoltaic out-
put power forecasting: A review. Applied Sciences,
10(2):487.
Mohammadi, K., Shamshirband, S., Anisi, M. H., Alam,
K. A., and Petkovi
´
c, D. (2015). Support vector re-
gression based prediction of global solar radiation on
a horizontal surface. Energy Conversion and Manage-
ment, 91:433–441.
Park, M. K., Lee, J. M., Kang, W. H., Choi, J. M., and Lee,
K. H. (2021). Predictive model for pv power genera-
tion using rnn (lstm). Journal of Mechanical Science
and Technology, 35(2):795–803.
Pedro, H. T. and Coimbra, C. F. (2012). Assessment of fore-
casting techniques for solar power production with no
exogenous inputs. Solar Energy, 86(7):2017–2028.
Pelland, S., Remund, J., Kleissl, J., Oozeki, T., and De Bra-
bandere, K. (2013). Photovoltaic and solar forecast-
ing: state of the art. IEA PVPS Task, 14(355):1–36.
Reikard, G. (2009). Predicting solar radiation at high reso-
lutions: A comparison of time series forecasts. Solar
energy, 83(3):342–349.
Wang, F., Lu, X., Mei, S., Su, Y., Zhen, Z., Zou, Z., Zhang,
X., Yin, R., Dui
´
c, N., Shafie-khah, M., et al. (2022).
A satellite image data based ultra-short-term solar pv
power forecasting method considering cloud informa-
tion from neighboring plant. Energy, 238:121946.
Wang, F., Xuan, Z., Zhen, Z., Li, K., Wang, T., and
Shi, M. (2020). A day-ahead pv power forecasting
method based on lstm-rnn model and time correla-
tion modification under partial daily pattern predic-
tion framework. Energy Conversion and Manage-
ment, 212:112766.
Wang, F., Zhen, Z., Wang, B., and Mi, Z. (2017). Compar-
ative study on knn and svm based weather classifica-
tion models for day ahead short term solar pv power
forecasting. Applied Sciences, 8(1):28.
Wang, H., Lei, Z., Zhang, X., Zhou, B., and Peng, J.
(2019). A review of deep learning for renewable en-
ergy forecasting. Energy Conversion and Manage-
ment, 198:111799.
Wang, L., Mao, M., Xie, J., Liao, Z., Zhang, H., and Li,
H. (2023). Accurate solar pv power prediction in-
terval method based on frequency-domain decompo-
sition and lstm model. Energy, 262:125592.
Wang, M., Peng, J., Luo, Y., Shen, Z., and Yang, H. (2021).
Comparison of different simplistic prediction models
for forecasting pv power output: assessment with ex-
perimental measurements. Energy, 224:120162.
ICPRAM 2025 - 14th International Conference on Pattern Recognition Applications and Methods
740
