
XR-Assisted 3D Reconstruction: Improving Model Quality Through
Real-Time Feedback
Colin Ummerle
1,2
and Markus Friedrich
2 a
1
Usaneers GmbH, Munich, Germany
2
Department of Computer Science and Mathematics, Munich University of Applied Sciences, Munich, Germany
{colin.ummerle, markus.friedrich}@hm.edu
Keywords:
Extended Reality, Augmented Reality, Virtual Reality, 3D Reconstruction, Structure-from-Motion,
Multi-View Stereo.
Abstract:
This paper explores the potential for integrating extended reality (XR) technologies into image-based 3D
reconstruction workflows to better assist users in the image acquisition process. The delay between image
acquisition and visualization of the final 3D model often leads to data gaps and incomplete reconstructions,
requiring manual post-processing. The proposed XR-based assistance system provides real-time feedback
during scanning, significantly improving the quality of the results. The system uses off-the-shelf hardware to
reduce overall costs. We compare the system with a traditional method as baseline and prove its effectiveness
by a user study that measures both the user experience and the quality of the resulting 3D models.
1 INTRODUCTION
Current image-based 3D reconstruction systems use
multi-view-stereo (MVS) and structure-from-motion
(SfM) algorithms, or harness the representational
power of deep learning models that learn the recon-
struction process (Wang et al., 2024) or a specific
3D representation (Gao et al., 2022) directly from the
data. Either way, these methods rely on carefully cap-
tured sets of input images to reconstruct real-world
scenes. With the advent of powerful smartphones, al-
most everyone has a capture device that can be used
for manual image capture.
The challenge, however, is to avoid data gaps caused
by insufficient image coverage from certain angles
or difficult lighting conditions (Khilar et al., 2013).
These problems not only result in incomplete surface
reconstructions, but also require labor-intensive man-
ual post-processing or additional scanning passes to
fill in missing information (Dall’Asta et al., 2015). In
complex scenarios, such as the digitization of com-
plex exhibition objects or the capture of large indus-
trial environments, these problems can ultimately re-
duce the reliability and quality of the results (Haleem
et al., 2022). In addition, users often discover that
key parts of the scene have been inadequately cap-
tured only after the lengthy reconstruction process
a
https://orcid.org/0000-0001-5719-3198
has been completed, resulting in a significant delay
between image capture and visualization of the final
3D model for inspection.
In recent years, extended reality (XR) systems — en-
compassing augmented reality (AR), virtual reality
(VR), and mixed reality (MR) (Rauschnabel et al.,
2022) — have advanced significantly in both hard-
ware and software capabilities. This progress has led
to new opportunities for integrating XR with 3D re-
construction workflows, where users can view and in-
teract with digital representations of physical spaces
without delay.
This work tackles the challenges of manual image-
based 3D reconstruction by introducing an XR-based
assistance system that simplifies image acquisition
with real-time feedback on scene coverage. Com-
bining a commercially available XR headset with a
smartphone as the capture device, the system allows
users to monitor progress and identify areas requir-
ing additional scanning. This approach minimizes
repeated capture-reconstruction cycles, improves 3D
model quality, and helps to detect image capture er-
rors by visualizing insufficient coverage during the
scanning process.
The paper is structured as follows: Chapter 2 intro-
duces key concepts underlying this work. Chapter 3
reviews existing user-centered 3D reconstruction ap-
proaches and highlights gaps addressed by the pro-
posed system. Chapter 4 outlines the architecture and
Ummerle, C. and Friedrich, M.
XR-Assisted 3D Reconstruction: Improving Model Quality Through Real-Time Feedback.
DOI: 10.5220/0013259800003912
Paper published under CC license (CC BY-NC-ND 4.0)
In Proceedings of the 20th International Joint Conference on Computer Vision, Imaging and Computer Graphics Theory and Applications (VISIGRAPP 2025) - Volume 1: GRAPP, HUCAPP
and IVAPP, pages 619-626
ISBN: 978-989-758-728-3; ISSN: 2184-4321
Proceedings Copyright © 2025 by SCITEPRESS – Science and Technology Publications, Lda.
619

functionality of the system, while Chapter 5 presents
its evaluation through a user study. Finally, Chapter 6
provides a summary and discusses future work.
2 BACKGROUND
2.1 3D Reconstruction
3D reconstruction creates a digital 3D model from
physical objects or environments. This work focuses
on using 2D images as input to generate 3D meshes,
represented by a piecewise linear surface (triangles).
Neural radiance fields (NeRFs) (Gao et al., 2022) are
also compatible with the proposed system, provided
the input is 2D images.
Image-based 3D reconstruction is classified by
whether camera parameters (e.g., focal length, posi-
tion) are known. Multi-view stereo (MVS) (Hartley
and Zisserman, 2004) assumes known parameters, en-
abling detailed models through triangulation of com-
mon points across images. Structure-from-Motion
(SfM) (Hartley and Zisserman, 2004) estimates both
camera parameters and 3D structure. Recent deep
learning methods, such as (Wang et al., 2024), inte-
grate learned models to enhance these processes.
This work uses the open-source Meshroom package
1
,
which combines SfM and MVS to generate detailed
3D models from 2D images without requiring prior
camera parameter knowledge.
2.2 Extended Reality (XR)
We follow the definition of Extended Reality (XR) as
in (Rauschnabel et al., 2022), where it is defined as
an umbrella term that encompasses a spectrum of im-
mersive technologies designed to blend the real world
with virtual elements. It integrates technologies like
Virtual Reality (VR), Augmented Reality (AR), and
Mixed Reality (MR), all of which differ in the degree
to which they immerse the user or overlay digital con-
tent onto their real-world experience. XR focuses on
creating experiences that span the continuum of pres-
ence, from local presence (AR, where the user inter-
acts with both the real and digital worlds) to telepres-
ence (VR, where users are fully immersed in a virtual
environment). Based on that definition, our proposed
system is an AR system that emphasizes local pres-
ence, with a high level of integration of digital con-
tent into the real-world scene, placing it on the AR
continuum closer to the MR pole.
1
https://alicevision.org/#meshroom
3 RELATED WORK
This section examines popular mobile 3D scanning
applications and related academic studies, highlight-
ing their strengths and limitations in offering real-
time feedback during image capture.
Polycam (Polycam, 2024) creates 3D models using
2D images and LiDAR, with a focus on room scans.
It lacks real-time guidance, providing only an image
count during scanning. Kiri Engine (KIRI Innova-
tions, 2024) emphasizes high-quality reconstructions
by allowing adjustments to settings like resolution
and image count. It includes a tutorial and a video
mode for capturing images but lacks real-time capture
monitoring. RealityScan (Epic Games, Inc, 2024)
simplifies scanning for non-technical users with vi-
sual indicators of captured positions and intermediate
results to reduce errors. Unlike Polycam and Kiri En-
gine, it offers interactive feedback, though limited to
a 2D device screen. The proposed system addresses
these limitations by leveraging XR headsets for im-
mersive 3D feedback.
Dietz and Grubert (Dietz and Grubert, 2022) present
an open-source 3D reconstruction pipeline hosted in a
scalable cloud environment with a user-friendly inter-
face for non-professionals. Their solution leverages
cloud computing to handle intensive tasks, enabling
users to use common devices like smartphones with-
out facing local processing limits. While their ap-
proach simplifies 3D reconstruction for a broader au-
dience, our method goes further by integrating immer-
sive XR technologies that offer real-time guidance
and feedback, reducing rescanning needs and enhanc-
ing efficiency.
In (Danhof et al., 2015), a VR-based 3D laser scan-
ning simulation environment is proposed for generat-
ing synthetic scans of computer-aided design (CAD)
models. It uses the Oculus Rift headset together with
a Razer Hydra controller to mimic handheld 3D laser
scanners. The system supports 3D meshes and B-
spline surfaces, producing realistic 3D point clouds
that mimic real-world scanning scenarios. Our sys-
tem, on the contrary, captures real-world data and re-
constructs based on images.
Overall, existing mobile apps and academic ap-
proaches provide useful 3D reconstruction tools but
lack real-time feedback or 3D visualization for better
scene understanding. The proposed XR-based system
combines these features for a more effective and sup-
portive scanning solution.
HUCAPP 2025 - 9th International Conference on Human Computer Interaction Theory and Applications
620
4 CONCEPT
4.1 System Requirements
We identified the following system requirements:
1. The system should visually indicate the progress
of the image capture process through various
feedback mechanisms.
2. The system must avoid delays in visualization to
prevent nausea and disorientation when using the
XR headset.
3. The system must capture timestamped images for
later 3D reconstruction, ensuring high quality data
for accurate 3D models.
4. The system must support multiple cross-platform
devices (mobile devices, XR headsets and work-
stations) to ensure broad deployment.
These requirements stem from the research questions
and insights from related work analysis. We address
them in the following system description.
4.2 Feedback Mechanisms
To satisfy requirement 1, the system incorporates
feedback mechanisms to guide users effectively:
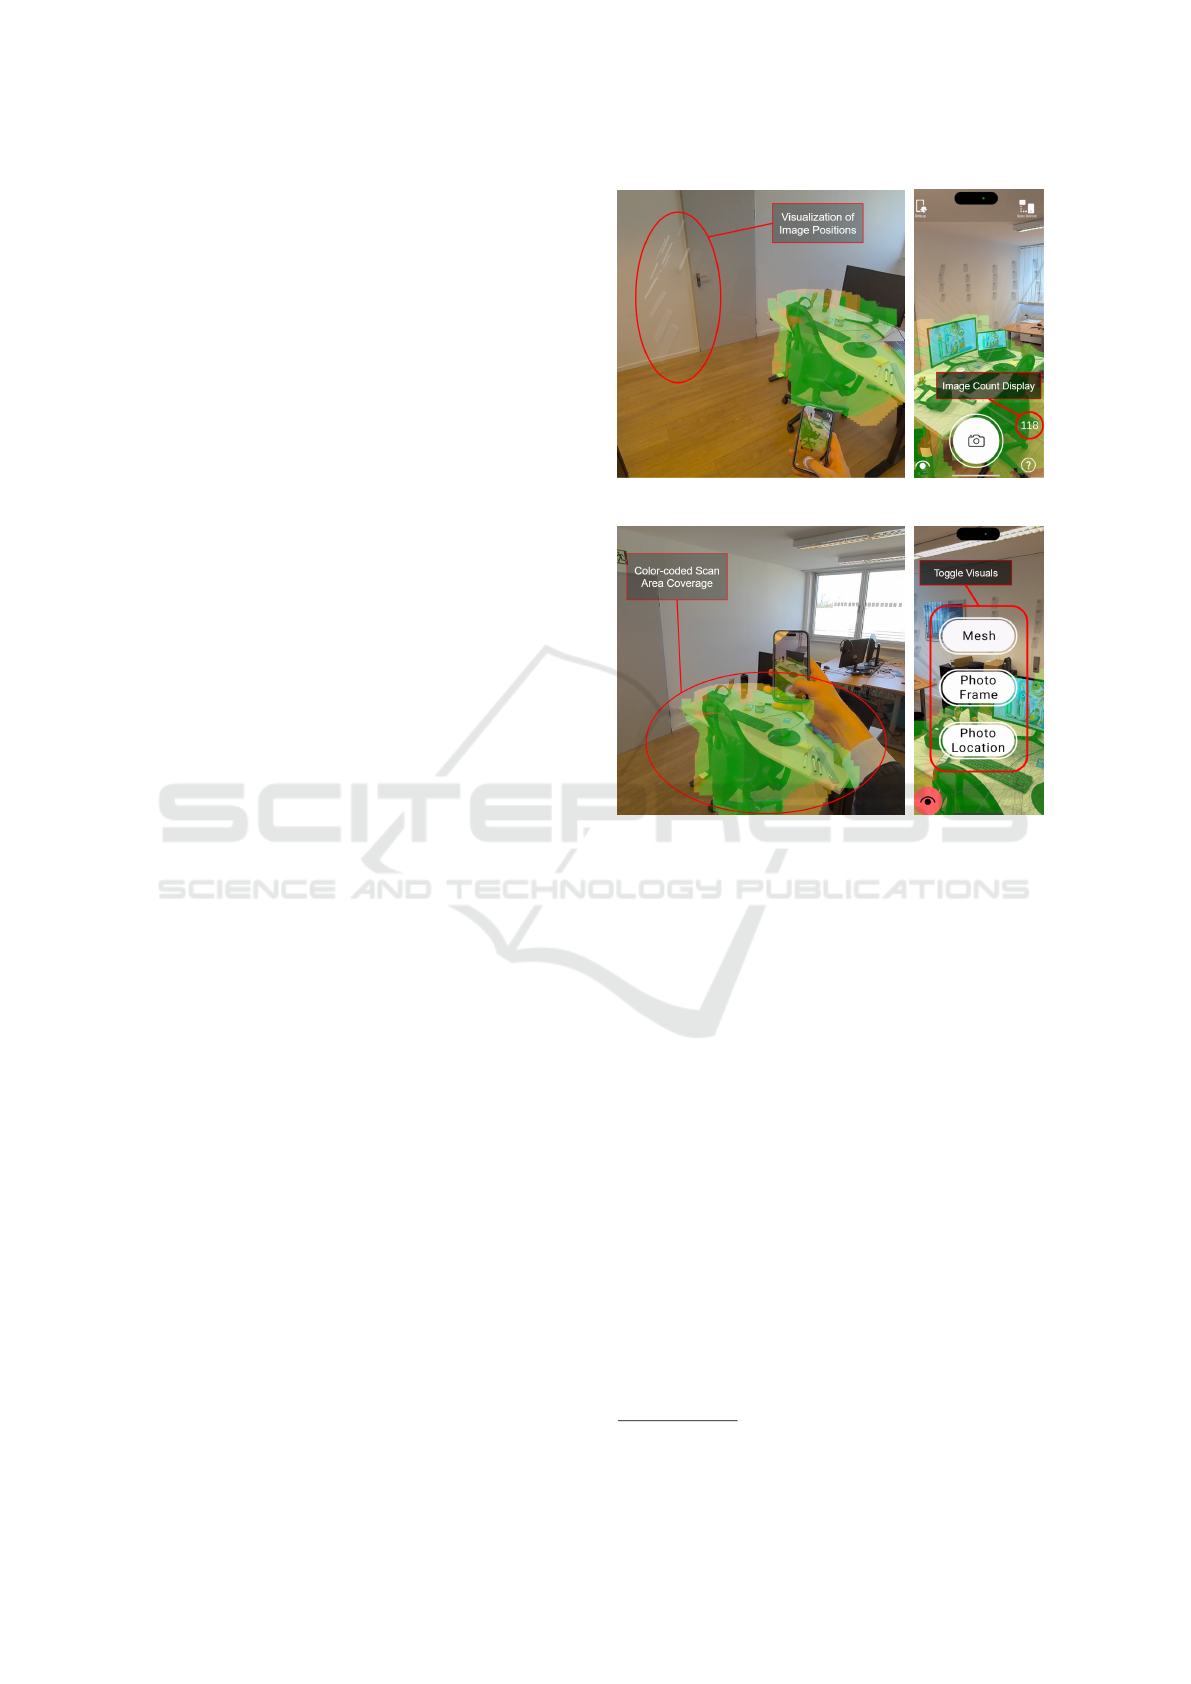
Visualization of Image Positions (Figure 1a): The
system tracks and visualizes the position and orienta-
tion of the smartphone in 3D space for all captured
images and provides real-time feedback via the XR
headset (similar to (Epic Games, Inc, 2024)). This
allows users to see the complete history of previous
image captures directly in their physical environment,
ensuring efficient coverage and preventing areas from
being missed or scanned twice.
Color-coded Scan Area Coverage (Figure 1c): The
system initially overlays a red 3D mesh over the scan
area using the data from the LiDAR sensor of the used
smartphone. As the user captures images, scanned ar-
eas are color-coded: yellow for newly scanned areas
and green for areas scanned multiple times, offering
immediate feedback on scan completeness.
Image Count Display (Figure 1d): The system
shows the number of images already taken, helping
the user tracking their progress throughout the scan-
ning process (like in (Polycam, 2024)).
4.3 Hardware
To meet requirements 2 and 3, the proposed system
integrates an iPhone 14 Pro as the sensor device and
a Meta Quest 3 as the XR headset. The Meta Quest 3
provides real-time, immersive feedback through color
(a) Visualization of image positions. (b) Image count.
(c) Color-coded scan area coverage. (d) Main UI.
Figure 1: Feedback mechanisms shown from the Meta
Quest 3 and the iPhone 14 Pro during scan process.
passthrough and precise tracking. The iPhone 14 Pro,
equipped with a LiDAR scanner and high-resolution
camera, enables online 3D reconstructions by gener-
ating a rough 3D model for immediate feedback. It
also captures high-quality images for later use in pro-
ducing a detailed 3D model.
4.4 Software Architecture
To meet the system requirements, we use Unity3D,
a platform-independent 3D visualization and interac-
tion framework
2
in combination with its ARFounda-
tion and Netcode for GameObjects (NfG) extensions.
ARFoundation provides a unified API for developing
cross-platform XR applications on iOS and Android.
NfG offers a networking library for efficient wireless
communication between devices. The software archi-
tecture, shown in Figure 2, consists of two main de-
vices: the Host (iPhone 14 Pro) and the Client (Meta
Quest 3), each with distinct responsibilities.
2
Unity Technologies, https://unity.com
XR-Assisted 3D Reconstruction: Improving Model Quality Through Real-Time Feedback
621
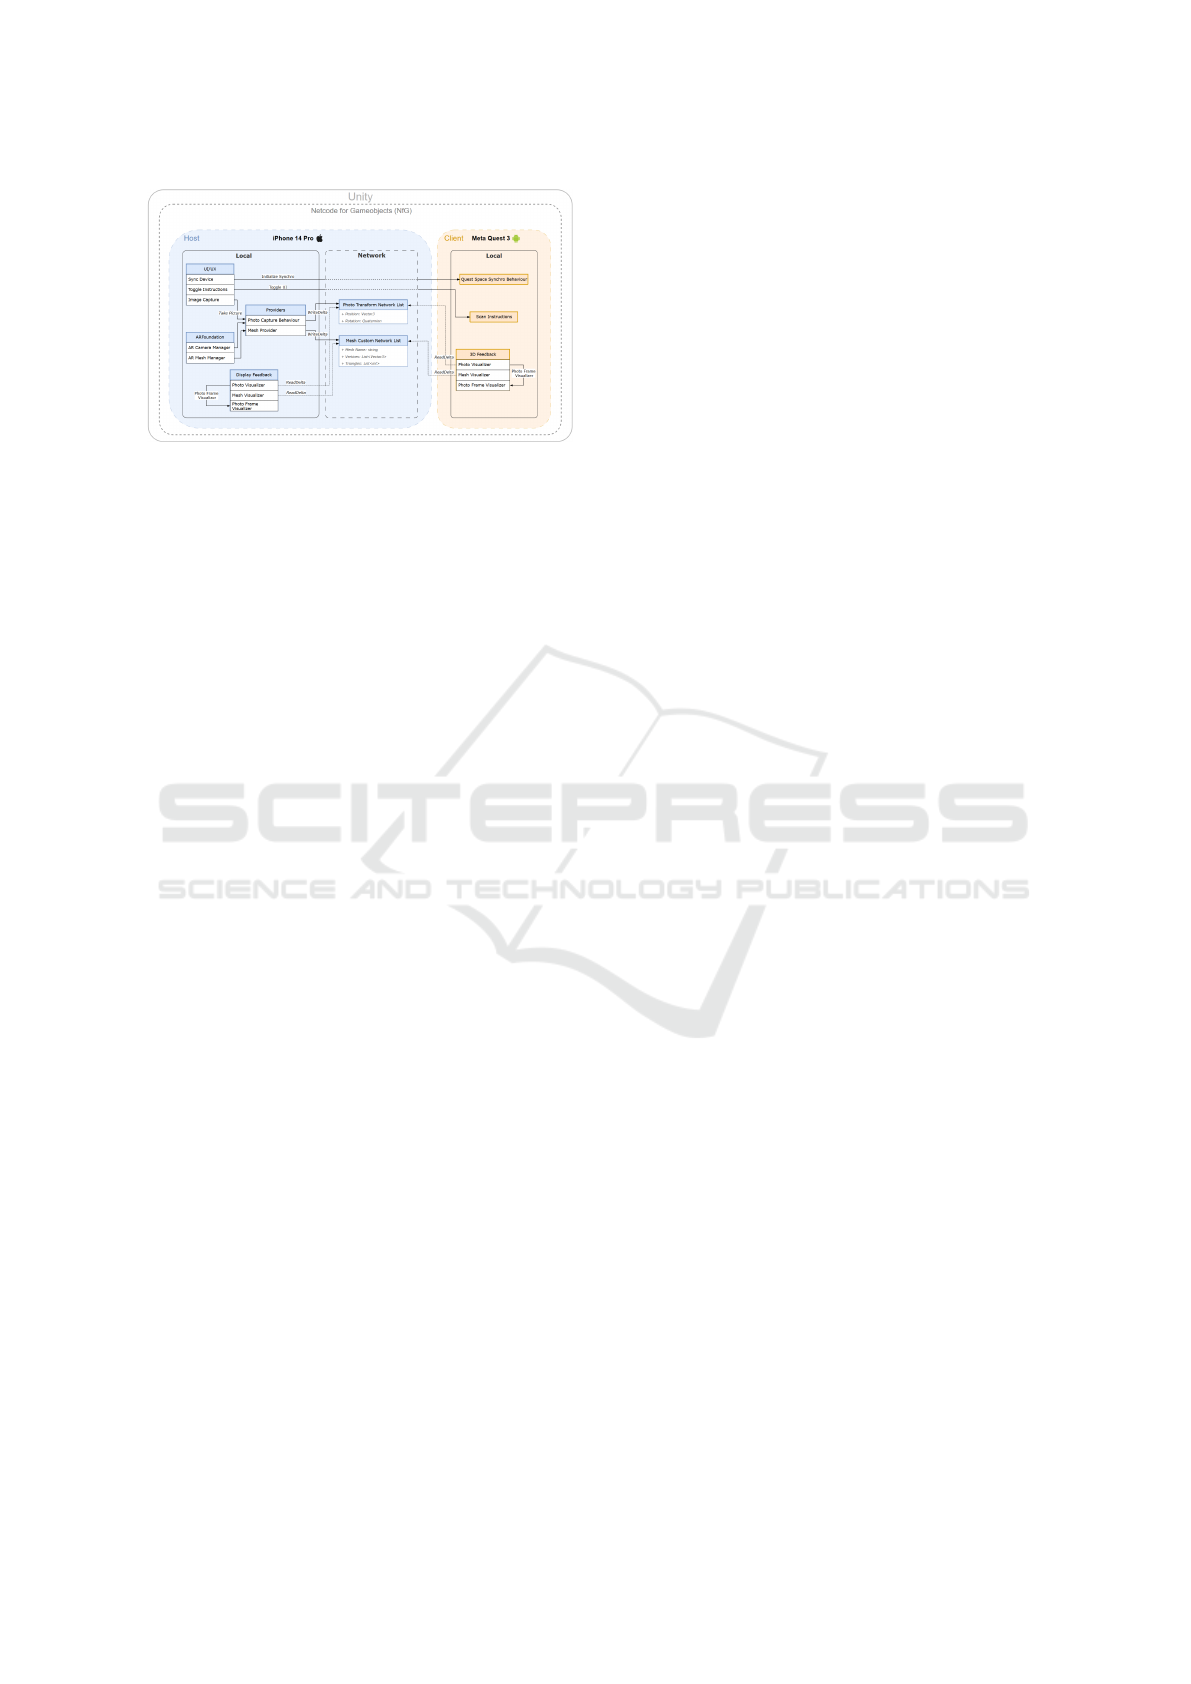
Figure 2: Software architecture of the proposed system.
4.4.1 Host
UI/UX: The smartphone’s interactive UI provides
functionality for synchronizing client devices, tog-
gling instructions, and initializing image capture. The
Sync Device component initializes synchronization,
while the Toggle Instructions component con-
trols the display of user guidance.
ARFoundation: The application utilizes the AR
Camera Manager and AR Mesh Manager for captur-
ing AR data. These components are responsible for
managing camera input and mesh creation. Further-
more, they contribute to accurate tracking of the de-
vice within the real environment, ensuring precise po-
sitioning and movement tracking.
Providers: Consists of the components Photo
Capture Behaviour and Mesh Provider. The
Photo Capture Behaviour handles the image cap-
ture process, saving high quality timestamped im-
ages to the device disk (requirement 3) and writing to
the photo transform network list which holds the im-
age position and rotation. The Mesh Provider uses
the mesh data provided by ARFoundation’s AR Mesh
Manager and optimizes it for network traffic before
writing it to the custom-implemented mesh network
list (requirement 2).
Display Feedback (requirement 1): The Photo
Visualizer reads data from the network list and in-
stantiates a smartphone model at the corresponding
position and rotation to mark the photo location. The
Mesh Visualizer reads data from the network list to
visualize mesh information and creates real-time col-
lider objects for the Photo Frame Visualizer. The
Photo Frame Visualizer does not read from the
network list; instead it takes the photo positions from
the Photo Visualizer and draws the captured frame
on the generated collider objects to ensure proper vi-
sual differentiation of overlapping areas.
Photo Transform Network List: Uses an NfG net-
work variable to manage the position and rotation data
of captured images, including position and rotation.
The network variables are used to ensure that updates
to data (such as position and rotation) are shared effi-
ciently across all clients, typically relying on internal
messaging protocols to propagate changes and main-
tain synchronization.
Mesh Custom Network List: Stores the data from
the optimized mesh, including mesh name, vertices
and triangles. This is a complex data type that re-
quires a custom NfG network variable implementa-
tion. Delta read and write operations need to be im-
plemented to ensure the data can be transferred ef-
ficiently through the network, maintaining synchro-
nization across devices. Network traffic speed plays a
significant role in ensuring a fluent experience during
usage, which is why the custom network variable is
indispensable in regard to requirement 2.
4.4.2 Client
The architecture allows the client not to be limited to
the Meta Quest 3 which means different XR devices,
including mobile devices, XR headsets, and Windows
PCs can be used as Client (requirement 4).
Quest Space Synchro Behavior: Synchronizes spa-
tial information between the XR headset and the host
device, aligning the positioning of the XR headset
so that the origin of ARFoundation (on the smart-
phone) matches the origin of the headset, ensuring
that both devices share a consistent representation of
the scanned environment.
Scan Instructions: Provides step-by-step guidance
through the scanning process in the form of a slide
show, ensuring all areas are covered.
3D Feedback: Provides feedback similarly to the
Display Feedback component on the smartphone but
leverages the XR headset to present it in 3D, offer-
ing spatial awareness and enhancing the user’s under-
standing of scan progress (requirement 1).
5 EVALUATION
5.1 User Study Design
The user study combines both quantitative and quali-
tative methods to evaluate the proposed system. The
design includes an experimental approach where par-
ticipants with basic familiarity with smartphones and
XR technologies are given a 3D scanning task in two
conditions:
• Condition 1: Without XR support, participants
use only the native camera app installed on the
smartphone. This serves as the baseline, leverag-
ing the smartphone’s high-quality imaging capa-
bility but without any guidance.
HUCAPP 2025 - 9th International Conference on Human Computer Interaction Theory and Applications
622
• Condition 2: With XR support, participants use
the proposed system, providing real-time visual
feedback on scanned areas and areas still needing
coverage.
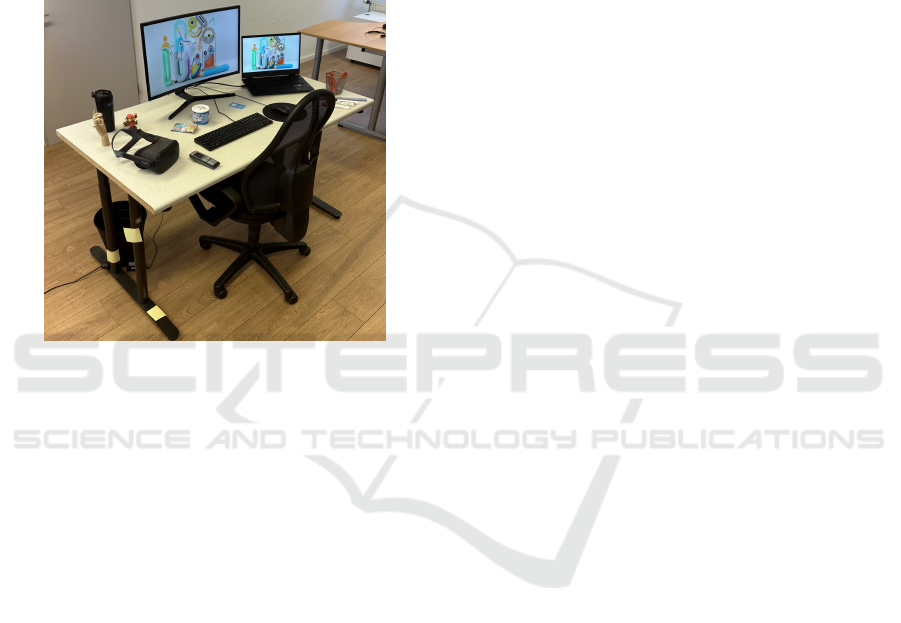
The task was to create as complete a scan as possible
of the desk shown in Figure 3. Each participant
completed the first condition 1, followed by the con-
dition 2. Participants received no results or feedback
on their performance on condition 1, preventing no
learning effects between tasks. The comparison aims
Figure 3: Desk that should be scanned by the participants.
to analyze the advantages of the proposed system
in terms of user experience and improved scan quality.
User Experience Assessment. The user experi-
ence is assessed via questionnaire, which participants
completed after performing the tasks. The question-
naire was distributed via Google Forms to maintain
the anonymity of their responses and includes four
key sections:
• Demographics and Experience: Collects data on
age, gender, and prior experience with similar
technologies. These demographic insights allow
for more nuanced analysis of results by under-
standing sample composition.
• Comparison of Scan Methods: Assesses user pref-
erences and experiences with both the traditional
camera and XR-supported scan methods, focus-
ing on usability, efficiency, coverage, clarity, and
comfort. This helps to determine the system’s
benefits for the 3D scanning process.
• System Usability Scale (SUS): A standardized
quantitative tool for rating the proposed system’s
usability, the SUS is a subjective measure of user-
friendliness, allowing for comparisons with other
systems (Brooke, 1996).
• Open-Ended Feedback: Allows participants to
share personal insights, improvement sugges-
tions, and specific experiences with the proposed
system, providing valuable qualitative feedback
that could highlight areas for enhancement.
These sections provide both structured insights
into the performance of the proposed system and
open-ended responses that reveal individual user
experiences, supporting a thorough evaluation of its
impact.
Scan Data Quality Assessment. The image
data acquired by the participants is processed in
Meshroom to assess the quality of the 3D reconstruc-
tion. The analysis is performed without modifying
the images or the resulting 3D model, and each
participant’s data is evaluated independently. The
extracted key metrics are:
• Number of Images: Measures the extent of image
capture and indicates whether the XR assistant has
improved the efficiency and thoroughness of im-
age capture.
• Estimated Camera Positions: Provide insight into
the accuracy and consistency of image position-
ing, particularly in spatial orientation.
• Feature Point Count: Visually distinct feature cor-
respondences in camera images. Indicates the
density of detected detail and is an indicator for
reconstruction quality.
• Mesh Vertices Count: Reflects the level of detail
of the resulting 3D model.
• Expert Rating: Expert ratings from Usaneers
GmbH qualitatively assess the completeness, vi-
sual quality, and precision of the 3D model on a
scale of 1 to 5. The scores are based on subjective
criteria without a quantitative baseline.
By combining quantitative metrics with expert judge-
ments, this analysis addresses research questions
about the potential benefits of the proposed system in
improving 3D scan quality, integrating both objective
technical measures and user perspectives for a com-
prehensive evaluation.
5.2 Results
5.2.1 User Experience Assessment
Demographics and Experience. The study includes
a total of 16 participants, who had no or very little
experience with 3D reconstruction, and were willing
to test the proposed system and evaluate their experi-
ence. The age distribution ranges from 24 to 63 years,
XR-Assisted 3D Reconstruction: Improving Model Quality Through Real-Time Feedback
623
with an average age of around 34.9 years. This range
allows different age groups to be considered in terms
of their perception and acceptance of the new tech-
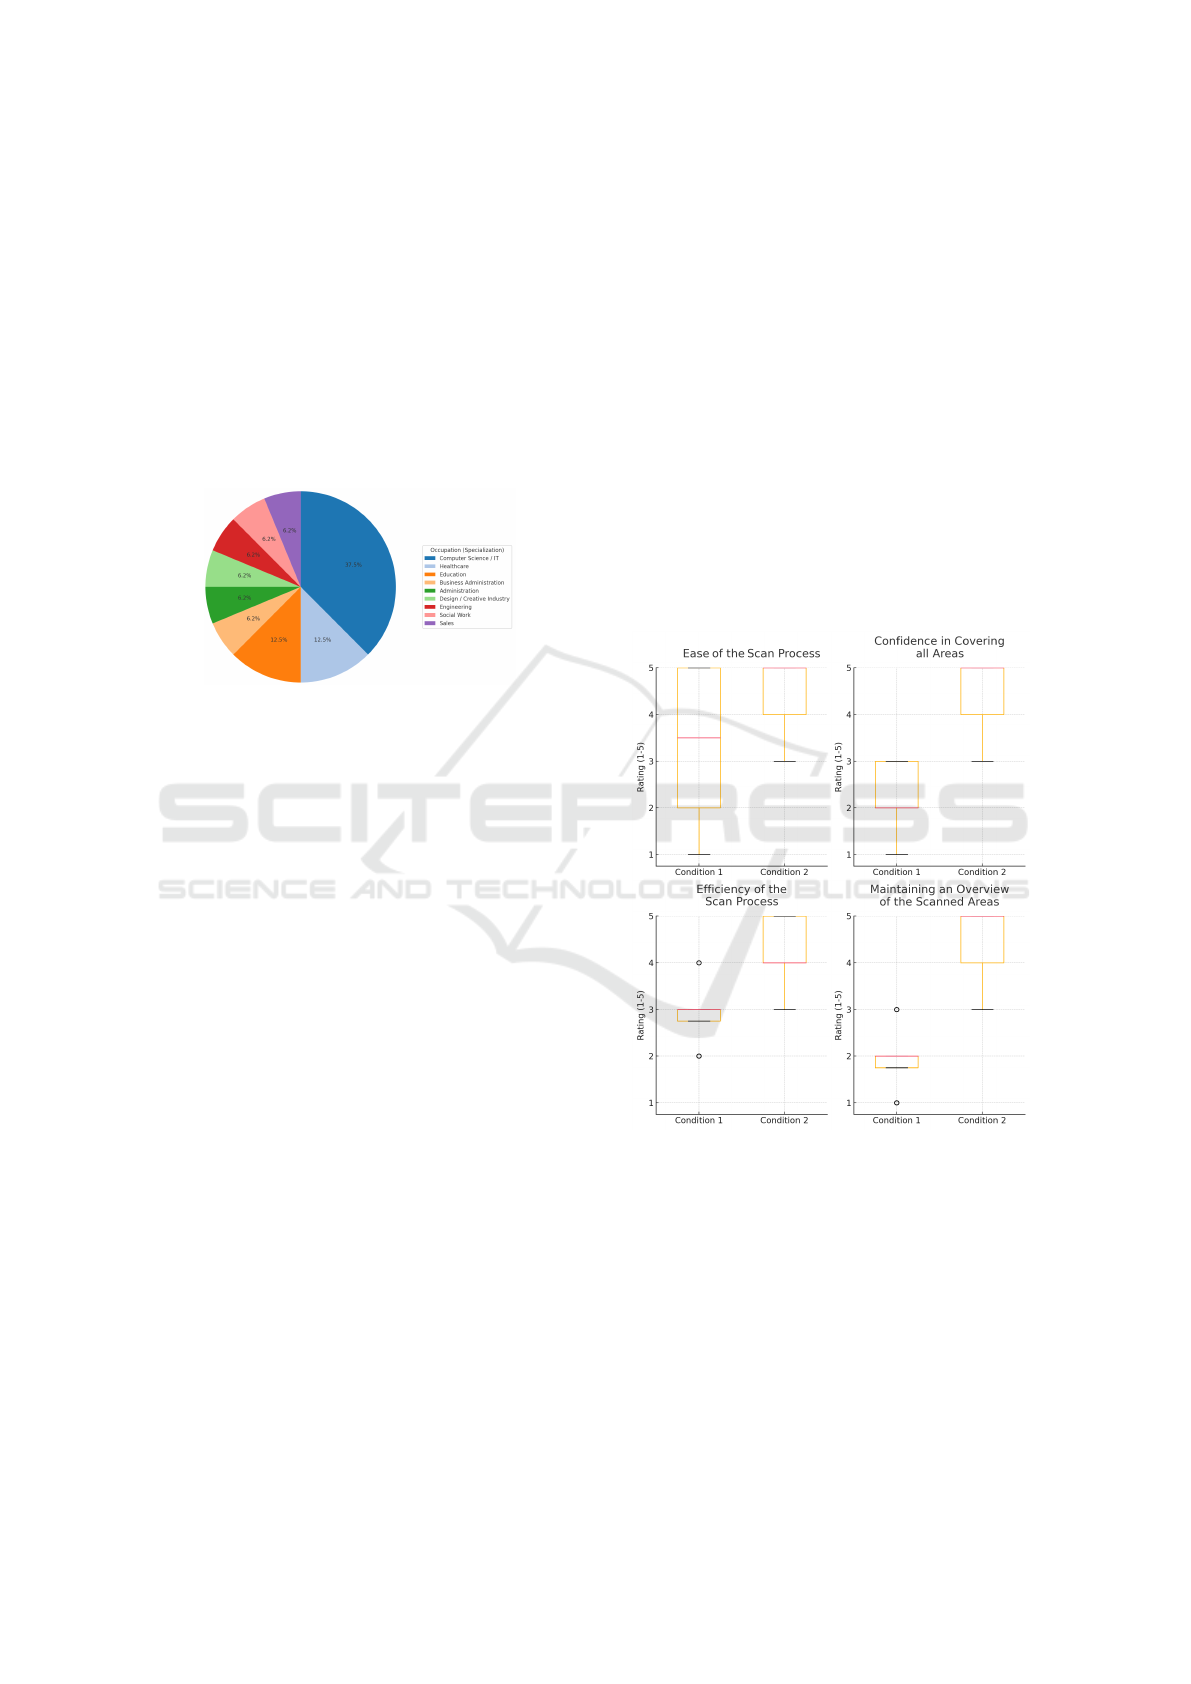
nology. The professional backgrounds of the partic-
ipants are diverse and represent different specializa-
tions. The largest group comes from the IT sector
(6 participants), followed by healthcare and education
professionals (2 participants each). Other participants
come from the fields of business administration, ad-
ministration, design/creative industries, engineering,
social services and sales. See figure 4 for details of
the professional background of the participants.
Figure 4: Professional background of the participants.
Comparison of Scan Methods. In the user study,
participants rated the ease, confidence, efficiency, and
tracking of the scan process for both condition 1 and
condition 2 where the latter showed clear advantages,
as described below (see also Figure 5):
• Ease of the Scan Process: condition 1 received
a mean µ of 2.94 with a standard deviation σ of
1.39. condition 2 was rated significantly higher,
with µ = 4.56 (σ = 0.73). A t-test revealed a
statistically significant difference (t = −3.230,
p = 0.00561), indicating that participants gener-
ally found the XR-supported scan process much
easier, likely due to additional guidance provided
by the proposed system.
• Confidence in Covering all Areas: For condition
1, µ was 2.13 (σ = 0.96), while condition 2 scored
µ = 4.38 (σ = 0.89). The t-test showed a sig-
nificant difference (t = −10.593, p < 0.00001),
demonstrating that the proposed system provided
participants with significantly greater confidence
in covering the entire object, supported by the sys-
tem’s visual feedback.
• Efficiency of the Scan Process: Condition 1
scored a mean of 2.63 (σ = 1.20), compared to
µ = 4.19 (σ = 0.98) for condition 2. he t-test con-
firmed this difference as statistically significant
(t = −5.809, p = 0.00003), suggesting that the
XR-supported approach was perceived as more
efficient, likely due to structured guidance and tar-
geted prompts during the scan process.
• Maintaining an Overview of Scanned Areas:
Condition 1 had a mean score of 2.00 (σ = 0.93),
while condition 2 scored µ = 4.69 (σ = 0.48). The
difference was highly significant (t = −9.373,
p < 0.00001). The high score for the proposed
system indicates that the visual support and real-
time feedback offered clear orientation and ease
of tracking during scanning.
The descriptive analysis of means, standard devi-
ations, and t-test results shows that the proposed
system was rated higher across all examined di-
mensions. This suggests that the additional support
provided by XR technology made the scan process
more intuitive, secure, efficient, and easy to follow
for users. This underscores the potential of XR
technology to significantly improve the 3D scan
process through simplified operation, optimized
efficiency, and enhanced precision.
Figure 5: Comparison of scan methods.
System Usability Scale (SUS). The SUS analysis
reveals that the proposed system achieved an average
SUS score of 80.47, indicating a high level of
perceived user-friendliness. SUS scores are generally
interpreted on a scale from 0 to 100, where values
above 68 are considered above average and scores of
80 or more are rated as excellent. Among the 10 SUS
items, questions related to ease of use and system
integration scored the highest, while those concerning
initial learning effort received comparatively lower
ratings. This highlights the intuitive interface of the
system, though there may be room for improvement
HUCAPP 2025 - 9th International Conference on Human Computer Interaction Theory and Applications
624
in onboarding and first-time use. Such a high score
suggests strong user acceptance and satisfaction,
which is a critical indicator of success for practical
applications.
Several factors investigated in this study likely
contributed to this high score, including the system’s
real-time feedback and intuitive user guidance. These
features support a quick learning curve, allowing
users to confidently complete the 3D scanning pro-
cess without needing constant assistance. Combined
with the results from comparison questions on scan
quality and efficiency, the SUS findings support
the assumption that the proposed system provides a
user-friendly and effective enhancement for the 3D
scanning process.
In conclusion, the SUS evaluation affirms the pro-
posed system’s effectiveness in terms of usability
and highlights its potential applicability in practical,
real-world scenarios.
Open-Ended Feedback. The qualitative feed-
back from open-ended questions suggests for this
particular scenario that the proposed system engages
users and sparks technical curiosity more than the
traditional method. The real-time visualization
of image capture progress adds significant value,
while the traditional method is appreciated for its
simplicity and familiarity. However, feedback on
improvements highlights the need for adjustments in
headset weight, visual clarity, and synchronization to
enhance comfort and effectiveness.
5.2.2 Scan Data Quality Assessment
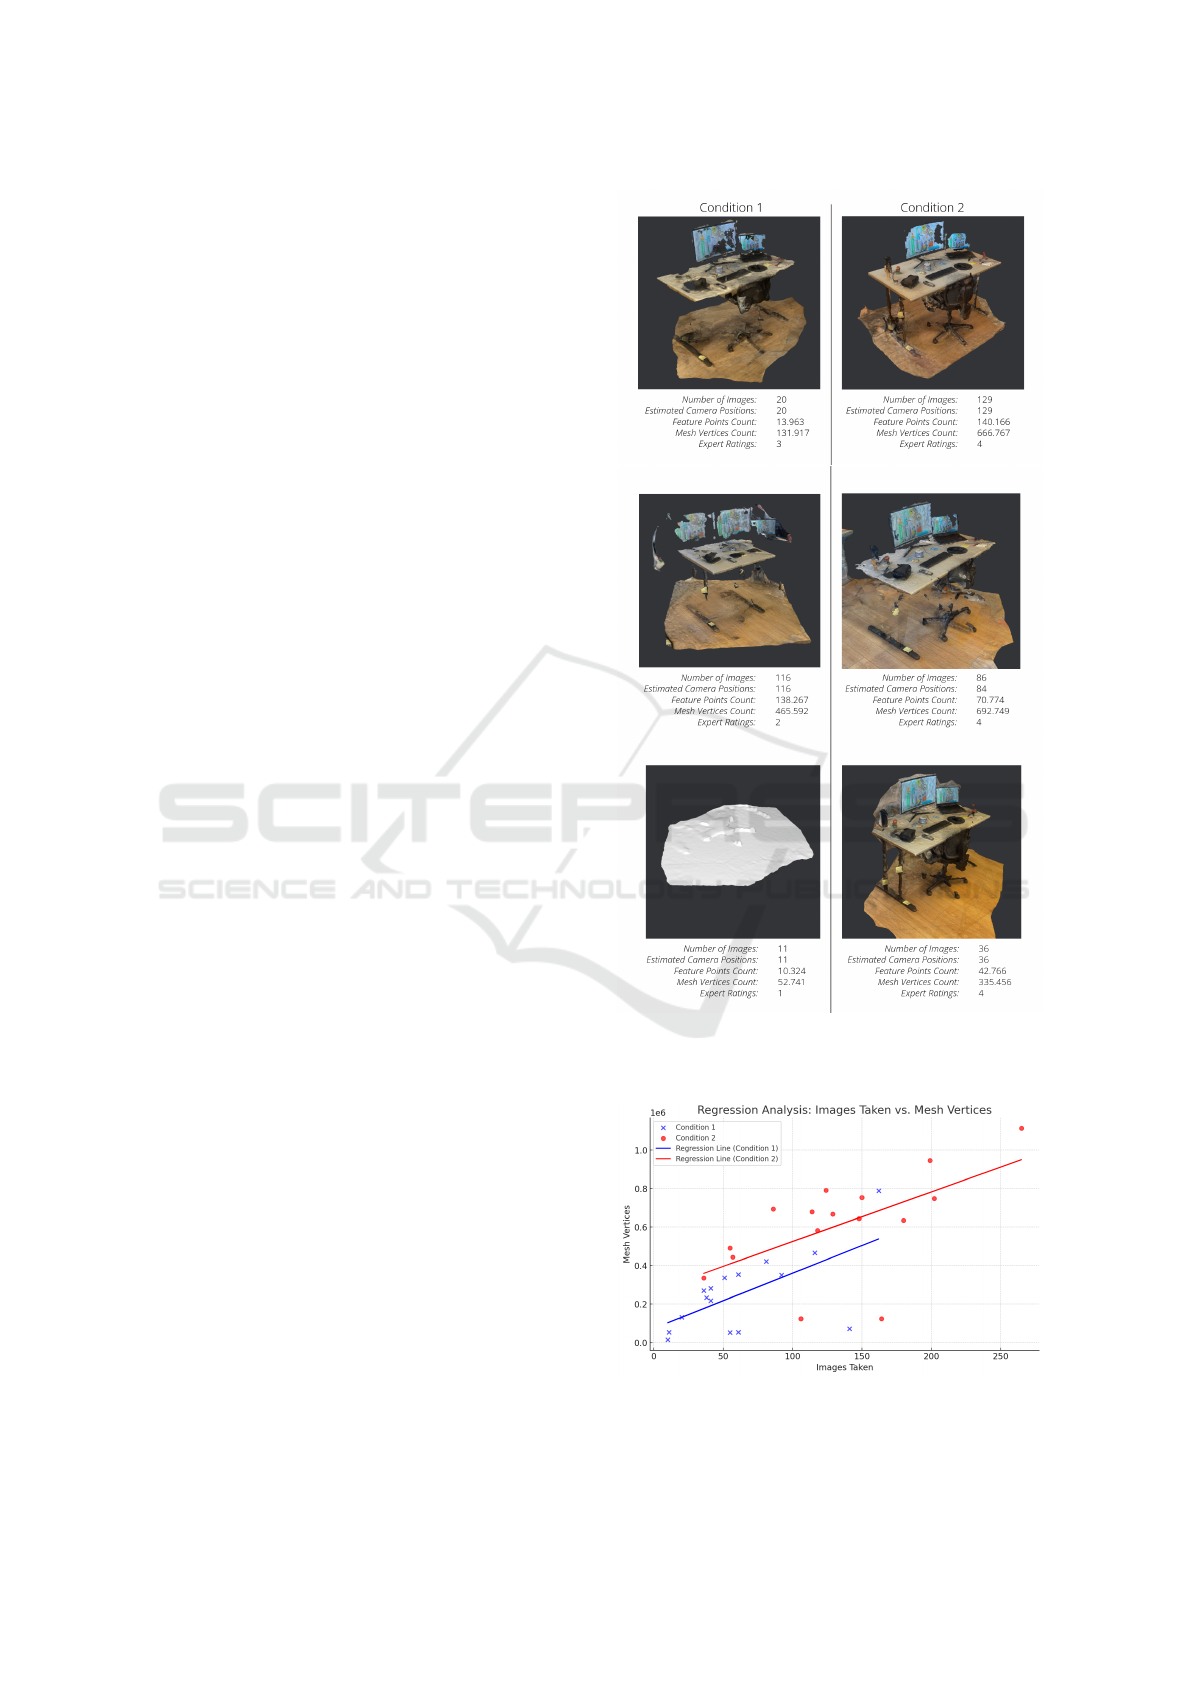
Overall Results. Figure 6 shows example meshes
that were generated based on the images captured by
a selection of participants for both conditions. From
the visible detail and surface coverage it can be con-
cluded that the mesh quality improves when using the
proposed system (condition 2). A full overview of
the results of the quality assessment can be found in
the Appendix, which shows, for example, that the av-
erage expert rating is significantly higher for results
using the proposed system (3.0625 vs. 2.1875).
Number of Images & Mesh Vertices Count. Fig-
ure 7 illustrates the linear relationship between the
number of images captured and the number of ver-
tices in the resulting reconstructed mesh for condition
1 (blue) and 2 (red). It also demonstrates the tendency
for users of the proposed system to capture more im-
ages, resulting in meshes with a larger number of ver-
tices. Furthermore, the same number of captured im-
ages typically yields more detailed meshes when the
proposed system is used.
Figure 6: Comparison of scan data quality for three selected
participants (one participant per row). Left column: Condi-
tion 1, Right column: Condition 2 (the proposed system).
Figure 7: # images taken vs. # mesh vertices.
XR-Assisted 3D Reconstruction: Improving Model Quality Through Real-Time Feedback
625

6 CONCLUSION
This paper demonstrates that the integration of XR
technologies into image-based 3D reconstruction
workflows improves both the image acquisition pro-
cess and the quality of the resulting reconstructions.
The proposed system, using off-the-shelf hardware,
significantly improves the user experience and model
quality, as confirmed by a comparative user study.
While statistically significant improvements were ob-
served with 16 participants, the small sample size lim-
its the generalisability of the results. Larger stud-
ies are needed for more comprehensive validation.
Future work could also extend this system to sup-
port collaborative scanning, allowing multiple users
to capture and visualise a scene simultaneously, im-
proving efficiency and coverage in complex environ-
ments.
ACKNOWLEDGEMENTS
We would like to thank Usaneers GmbH for their sup-
port and resources, which contributed significantly to
this research. The insights and expertise provided by
the Usaneers team were instrumental in advancing the
work presented in this paper. We also acknowledge
the use of the DeepL and ChatGPT AI services for
translation and grammar correction.
REFERENCES
Brooke, J. (1996). SUS – a quick and dirty usability scale,
pages 189–194.
Dall’Asta, E., Thoeni, K., Santise, M., Forlani, G., Gia-
comini, A., and Roncella, R. (2015). Network de-
sign and quality checks in automatic orientation of
close-range photogrammetric blocks. Sensors (Basel,
Switzerland), 15:7985 – 8008.
Danhof, M., Schneider, T., Laube, P., and Umlauf, G.
(2015). A virtual-reality 3 d-laser-scan simulation.
Dietz, O. and Grubert, J. (2022). Towards open-source web-
based 3d reconstruction for non-professionals. Fron-
tiers in Virtual Reality, 2:786558.
Epic Games, Inc (2024). RealityScan App. https:
//www.unrealengine.com/en-US/realityscan. Ac-
cessed: 2024-11-10.
Gao, K., Gao, Y., He, H., Lu, D., Xu, L., and Li, J. (2022).
Nerf: Neural radiance field in 3d vision, a comprehen-
sive review.
Haleem, A., Javaid, M., Singh, R. P., Rab, S., Suman, R.,
Kumar, L., and Khan, I. H. (2022). Exploring the po-
tential of 3d scanning in industry 4.0: An overview.
International Journal of Cognitive Computing in En-
gineering, 3:161–171.
Hartley, R. and Zisserman, A. (2004). Multiple View Geom-
etry in Computer Vision. Cambridge University Press,
2 edition.
Khilar, R., Chitrakala, S., and SelvamParvathy, S. (2013).
3d image reconstruction: Techniques, applications
and challenges. In 2013 International Conference on
Optical Imaging Sensor and Security (ICOSS), pages
1–6.
KIRI Innovations (2024). Kiri engine. https://www.
kiriengine.app/. Accessed: 2024-11-10.
Polycam (2024). Polycam app. https://poly.cam/. Accessed:
2024-11-10.
Rauschnabel, P. A., Felix, R., Hinsch, C., Shahab, H., and
Alt, F. (2022). What is xr? towards a framework for
augmented and virtual reality. Computers in Human
Behavior, 133:107289.
Wang, F., Zhu, Q., Chang, D., Gao, Q., Han, J., Zhang, T.,
Hartley, R., and Pollefeys, M. (2024). Learning-based
multi-view stereo: A survey. ArXiv, abs/2408.15235.
APPENDIX
Scan data quality assessment (complete results):
Table 1: Scan data quality assessment for condition 1 (with-
out XR support).
Participant Images taken Estimated Cameras Feature points Mesh vertices Quality 1-5
1 61 61 469251 53332 1
2 141 140 42618 71856 1
3 162 162 175985 789076 1
4 41 41 41169 282311 4
5 36 36 29895 269755 4
6 38 36 32046 233338 4
7 55 55 25691 52050 1
8 92 92 96594 350625 2
9 20 20 13963 131917 3
10 61 60 65246 353028 3
11 51 50 37380 336177 2
12 116 116 138267 465592 2
13 41 41 62178 217535 3
14 10 10 3694 14844 1
15 81 81 114424 421103 2
16 11 11 10324 52741 1
Table 2: Scan data quality assessment for condition 2 (with
XR support, proposed system).
Participant Images taken Estimated Cameras Feature points Mesh vertices Quality 1-5
1 164 160 705702 123875 2
2 106 103 41037 123584 1
3 150 135 72038 753014 2
4 124 124 115921 790881 4
5 118 118 138190 582178 4
6 199 199 238315 944914 4
7 180 180 218073 634975 3
8 114 114 98443 679456 4
9 129 129 140166 666767 4
10 265 265 315167 1112605 4
11 202 147 85930 747849 1
12 86 84 70774 692749 4
13 55 55 70582 490227 4
14 57 57 51772 444308 3
15 148 148 189464 644123 1
16 36 36 42766 335456 4
HUCAPP 2025 - 9th International Conference on Human Computer Interaction Theory and Applications
626
