
Enhanced Assessment of Gait Dynamics in Multiple Sclerosis:
A Signal Processing Approach for Extracting Range of Motion
Using Wearable IMUs
Dunya Moradi
1
, Kardelen Akar
2,4
, Hussein Youssef
2,4
, Ayse Altintas
2,4
, Atay Vural
2,4
and Beren Semiz
3,4
1
Graduate School of Sciences and Engineering, Koc University, Istanbul, Turkey
2
Department of Neurology, Koc University, Istanbul, Turkey
3
Department of Electrical and Electronics Engineering, Koc University, Istanbul, Turkey
4
Koc University Research Center for Translational Medicine (KUTTAM), Koc University, Istanbul, Turkey
Keywords: Multiple Sclerosis, Inertial Measurement Units, Range of Motion, Timed 25-Foot Walk (T25FW), Biomedical
Signal Processing.
Abstract: This study investigates the gait dynamics and motor impairment severity in individuals with multiple sclerosis
(MS) by analyzing lower limb range of motion (ROM) using data from inertial measurement units (IMUs)
collected during the Timed 25-Foot Walk (T25FW) clinical task. Forty-eight participants were categorized
into two MS groups based on motor impairment severity (16 MS patients with low motor impairment, 16 MS
patients with moderate to severe motor impairment) and 16 healthy control group. IMU raw data of
accelerometer and gyroscope from the feet sensors with respect to the lumbar region, were processed using a
Butterworth filter and an Extended Kalman Filter to obtain accurate orientation, followed by quaternion to
Euler angle conversion for calculating ROM. When the ROM-extracted statistical and time domain features
were compared, there were significant differences in ROM characteristics among groups, particularly
highlighting the increased variability and reduced control in participants with severe motor impairments.
ROM-extracted features such as kurtosis, skewness, and entropy underscored the asymmetrical and irregular
motion patterns in advanced MS cases. These findings support the potential of IMU-derived ROM metrics as
biomarkers for tracking MS disease progression and tailoring rehabilitation.
1 INTRODUCTION
Multiple Sclerosis (MS) is a chronic autoimmune
disorder that affects the central nervous system,
leading to a wide range of physical and cognitive
impairments. One of the key manifestations of MS is
the disruption of motor functions, which can severely
impact the quality of life for those affected. Patients
with MS often experience muscle weakness, spasticity,
and fatigue, all of which can hinder their ability to
perform daily activities. These motor impairments lead
to a reduction in mobility, increasing the risk of
secondary complications such as falls, contractures,
and decreased overall functional capacity (LaRocca,
2011), (Heesen et al., 2008).
Gait asymmetry in MS patients can arise from
various factors, including spasticity, muscle
weakness, or impaired motor coordination.
Spasticity, characterized by increased muscle tone
and resistance to movement, is a common symptom
of MS and can significantly affect gait dynamics
(Coca-Tapia et al., 2021; GÜLŞEN et al., 2024).
Range of motion (ROM) is a critical metric in
assessing the flexibility and functional capabilities of
joints. It quantifies the extent to which a joint can move
through its intended motion patterns, providing
valuable insights into a patient's musculoskeletal
health. In the context of MS, monitoring ROM serves
several important purposes, such as assessing mobility,
informing personalized rehabilitation, monitoring
disease progression, preventing complications, and
enhancing quality of life (Soucie et al., 2011).
Wearable devices facilitate real-world patient
monitoring and provide valuable biomarkers for
symptoms and behaviors associated with gait
disorders, thereby enhancing clinical assessments and
972
Moradi, D., Akar, K., Youssef, H., Altintas, A., Vural, A. and Semiz, B.
Enhanced Assessment of Gait Dynamics in Multiple Sclerosis: A Signal Processing Approach for Extracting Range of Motion Using Wearable IMUs.
DOI: 10.5220/0013260300003911
Paper published under CC license (CC BY-NC-ND 4.0)
In Proceedings of the 18th International Joint Conference on Biomedical Engineering Systems and Technologies (BIOSTEC 2025) - Volume 1, pages 972-979
ISBN: 978-989-758-731-3; ISSN: 2184-4305
Proceedings Copyright © 2025 by SCITEPRESS – Science and Technology Publications, Lda.

enabling personalized treatment plans (Huang et al.,
2024). Recent advancements in wearable
technologies and motion analysis techniques, such as
inertial measurement units (IMUs), have made it
possible to accurately assess ROM in real time. These
innovations provide clinicians and researchers with
valuable tools to evaluate joint movements in
dynamic environments, paving the way for a more
comprehensive understanding and management of
MS-related motor impairments (Grisbrook et al.,
2018), (Blandeau et al., 2023).
Considering the preliminary evidence suggesting
potential benefits of exercise programs on lower limb
flexibility in MS patients (Torres-Pareja et al., 2019),
we believe that a detailed analysis of ROM features
will enhance our understanding of these patients'
physical capabilities. By extracting and analyzing
these beneficial ROM features, we can uncover critical
insights into the mobility dynamics of individuals with
MS, which may inform and refine treatment protocols.
Accurate measurement and monitoring of ROM can
facilitate the identification of specific movement
impairments and provide objective data that healthcare
professionals can use to tailor rehabilitation. Thus,
leveraging the advancements in motion analysis
technology can play a pivotal role in transforming the
management of motor impairments associated with
MS, ensuring that therapeutic approaches are both
effective and individualized.
In this study, we aimed to process IMU data
collected from MS patients during the T25FW test to
evaluate their gait and movement patterns.
Specifically, we focused on calculating the ROM of
the feet relative to the lumbar region, which served as
a reference point for assessing the dynamics of lower
body movements during walking. This analysis was
crucial in identifying and quantifying gait
abnormalities in MS patients, aiding in tracking
disease progression, evaluating balance and
coordination issues, and designing personalized
rehabilitation protocols.
2 METHODOLOGIES
2.1 Participants
The study was conducted under a protocol approved
by the Koc University Institutional Review Board
(2020.418.IRB.157) and all participants provided
written consent. We recruited a total of 48
participants, including 32 individuals with multiple
sclerosis (pwMS) and 16 healthy controls. The pwMS
group was divided into two distinct categories based
on their performance in the T25FW task. Group A,
comprising 16 patients (7 male, 9 female), completed
the T25FW in under 5 seconds, indicating mild motor
impairment. In
contrast, Group B consisted of 16
patients (3 male, 13 female) with moderate to severe
motor impairment, evidenced by a T25FW duration
exceeding 9 seconds. The healthy control group
included 16 participants (8 male, 8 female) and served
as a baseline for comparison. This categorization
enabled us to evaluate differences in gait impairment
levels among pwMS and to assess the precision of our
analytical approach in distinguishing between various
stages of motor impairment and healthy gait patterns
.
Table 1: Participants Mean T25FW Score and Age.
Mean±SD
Healthy
control
Group A Group B
T25FW
duration
(seconds)
4.95±0.79 4.24±0.39 14.17±4.31
Age
(years)
54.15±12.84 38.01±9.12 56.37±11.47
2.2 IMU Data Collection
In this study, IMU data were collected using the
APDM MobilityLab system (APDM Inc., Portland,
OR, USA) during T25FW task. IMU data were
sampled at a frequency of 128 Hz and the sensors
were synchronized in real-time using a dedicated
wireless access point, ensuring precise temporal
alignment. Data processing was performed using
Python for signal filtering, feature extraction and
statistical analysis.
For the T25FW, participants walked 7.62 meters
as quickly as possible (Figure 1), with the time
recorded manually using a stopwatch. Throughout the
task, three OPAL sensors (Oregon, USA) were placed
on participants’ feet and lumbar region to measure
spatiotemporal gait parameters, trunk and turning
angles, and balance during quiet standing (Figure 2).
The system comprised wireless IMU sensors, a
docking station, and a wireless access point for real-
time data synchronization and transmission.
Figure 1: 25 Foot walking Clinical task.
Enhanced Assessment of Gait Dynamics in Multiple Sclerosis: A Signal Processing Approach for Extracting Range of Motion Using
Wearable IMUs
973

Figure 2: Sensor placement for IMU data collecting.
2.3 Calculation of Range of Motion
A Butterworth bandpass filter with a low cutoff
frequency of 0.01 Hz and a high cutoff frequency of
20 Hz was applied to the IMU raw data. For an
accurate orientation estimation, an Extended Kalman
Filter (EKF) was used. The EKF was implemented to
fuse accelerometer and gyroscope data, leveraging
their complementary strengths. The prediction step
utilized gyroscope data to estimate orientation
changes, while the update step corrected these
estimates using accelerometer data, reducing the
impact of drift and noise. The process equations were
based on quaternion kinematics. This iterative
approach ensures accurate orientation estimation,
particularly in dynamic conditions. This was critical
for accurately calculating the ROM from IMU raw
data (Senesh & Wolf, 2009), (Das et al., 2018),
(Keskinoğlu & Aydın, 2021). Precise orientation data
were essential for determining how much the feet
rotated relative to the lumbar region during walking.
Hence, fused accelerometer and gyroscope data could
achieve more accurate 3D orientation estimates for
each foot relative to the lumbar region. Initially,
quaternions were used to represent orientation due to
their ability to avoid gimbal lock, which can occur
when using Euler angles. Quaternions offer a more
stable representation of 3D rotations, especially when
continuous motion is involved, as they do not suffer
from the singularities that Euler angles do. However,
for more intuitive interpretation and ROM
calculation, the quaternions were later converted into
Euler angles.
Euler angles were preferred for this study as they
provide a clearer, more intuitive understanding of
each foot motion relative to the lumbar region,
making it easier to interpret and compute ROM in
clinically relevant terms (Agnew, 1944). The
conversion from quaternions to roll, pitch, and yaw,
calculated according to the Equations (2), (3), and (4),
ensures mathematical precision, facilitating accurate
ROM measurement.
A quaternion is typically expressed as Equation
(1):
𝑄𝑤𝑥𝑖𝑦𝑗𝑧𝑘
(1)
Where
𝑤
is the scalar component and 𝑖, j and k
are the vector components along the x, y, and z axes,
respectively (Latimer, 1948). Therefore, the
calculation of the three Euler angles (roll, pitch, and
yaw) is possible by using quaternion Q=(w,x,y,z), as
in the Equations (2), (3), and (4). In this context, roll
is the rotation around the X-axis, pitch is the rotation
around the Y-axis and yaw is the rotation around the
Z-axis (Diebel, 2006).
𝑅𝑜𝑙𝑙 arctan
(2)
𝑃𝑖𝑡𝑐ℎ 𝑎𝑟𝑐𝑠𝑖𝑛 2𝑤𝑦 𝑧𝑥
(3)
𝑌𝑎𝑤 arctan
(4)
The ROM was calculated using a sliding window
approach, where each set of Euler angles (roll, pitch,
and yaw) was divided into overlapping segments with
a window size of 640 samples and a step size of 128
samples, resulting in a 20 percent step size between
consecutive windows. This method captures the
variability in motion over time by calculating the
ROM based on the maximum and minimum values
within these 5-second windows, offering a detailed
temporal analysis of joint motion. Key phases of gait,
such as heel strike or toe-off, which are often
impaired in MS patients, are highlighted through this
approach. For each window, the ROM was
determined as in the Equation (5), by computing the
difference between the maximum and minimum
values of the Euler angles (roll, pitch, and yaw) for
both the right and left feet, relative to the lumbar
region. This relative comparison aids in
understanding the mobility constraints imposed by
MS, and by capturing the variability in joint angles, it
provides insights into the functional limitations
experienced by MS patients.
𝑅𝑂𝑀 max
𝑗𝑜𝑖𝑛𝑡 𝑎𝑛𝑔𝑙𝑒𝑠
min
𝑗𝑜𝑖𝑛𝑡 𝑎𝑛𝑔𝑙𝑒𝑠
(5)
2.4 Statistical Analysis
Beyond visualizing ROM patterns, key time-domain
and statistical features were extracted to provide a
more detailed comparison between groups. These
features included the standard deviation, skewness,
entropy, peak to peak and time to peak of the ROM
BIOSIGNALS 2025 - 18th International Conference on Bio-inspired Systems and Signal Processing
974
values, offering insights into movement consistency,
variability, and distribution (Table 2). By analyzing
these metrics, we aimed to capture both the
magnitude and irregularities in joint motions,
enhancing the ability to detect subtle motor
impairments in MS patients and provide unique
insights into the ROM characteristics across different
groups and capture various aspects of gait dynamics.
Skewness reflects asymmetry in movement, which is
a common biomarker in MS patients, while entropy
measures the complexity and irregularity of motion
patterns. These metrics collectively provide a
comprehensive view of movement variability, motor
control, and functional capacity, which are critical for
assessing MS-related impairments (Giannakopoulos
& Pikrakis, 2014).
Table 2: ROM-extracted features.
Statistical features Time domain features
Skewness Peak to Peak
Standard deviation Entropy
Time to Peak
3 RESULTS
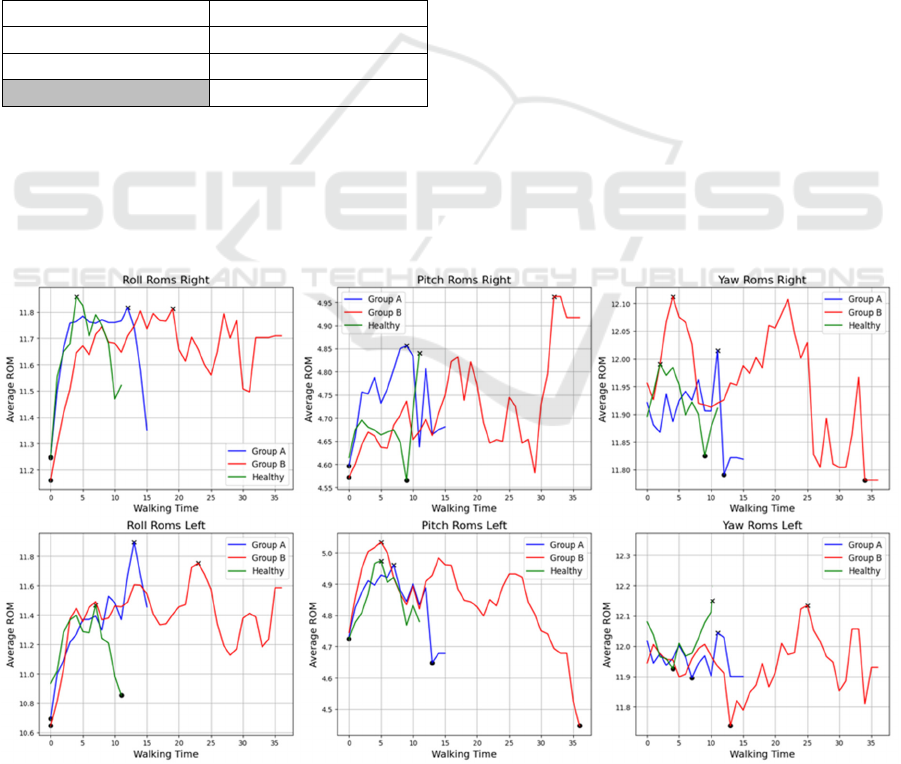
Figure 3 effectively visualizes comparison of all types
of calculated ROM from IMU raw data for both the
right and left feet, across the three groups which
included to the study. The sub-plots focus on the
pitch, yaw, and roll ROM measurements. This
visualization serves as a powerful tool to highlight
variations in mobility and functionality among the
two groups of MS patients and healthy control
participants.
According to the Figure 3, the ROM duration is
noticeably longer for Group B, indicating that
individuals with moderate to severe motor
impairment took more time to complete the walking
task compared to Group A and the Healthy group.
Group B also exhibits greater variability in their
ROM patterns, particularly in roll and pitch,
reflecting difficulty in maintaining consistent
movement and stability during gait. In contrast, the
Healthy group consistently demonstrates smoother,
more controlled movement patterns across all graphs,
with fewer sharp fluctuations and shorter task
durations, highlighting superior motor control and
balance. Group A shows intermediate performance,
with higher initial ROM values in some movements,
particularly in Roll and Yaw, but exhibits more
variability than the Healthy group. Despite this,
Group A maintains better control than Group B,
which shows irregular movement patterns with
sudden spikes and dips in ROM, indicating a lack of
consistent motor control. Additionally, there are
notable differences between Right and Left ROMs
Figure 3: Comparison of extracted types of ROMs for both feet across the three groups (walking time in seconds and average
ROM in degree angles).
Enhanced Assessment of Gait Dynamics in Multiple Sclerosis: A Signal Processing Approach for Extracting Range of Motion Using
Wearable IMUs
975

across groups A and B, with Group B showing greater
variability on one side, suggesting asymmetry in
movement impairment, pointing to uneven motor
function and higher irregularities in roll and pitch
ROM compared to Group A and the Healthy group.
This trend underscores the progressive impact of
motor impairments on walking dynamics and
mobility in MS patients and suggest a progressive
loss of motor control and balance in advanced MS
stages. Additionally, asymmetry between the right
and left feet is more pronounced in Group B,
reflecting uneven motor impairments
3.1 ROM-Derived Features Extraction
3.1.1 ROM Peak to Peak Value Across the
Groups
The peak-to-peak (P2P) ROM measure reflects the
difference between maximum and minimum values,
providing an indicator of movement amplitude. A
higher P2P value suggests increased variability in
movement, which may indicate either broader motion
capacity or challenges with movement control,
particularly relevant in the context of MS-related
motor impairments. The corresponding P2P values
are presented in Table 3. Group B shows consistently
higher P2P values than both Group A and the Healthy
group across all ROM dimensions and for both feet.
This pattern points to greater fluctuations in
movement within the advanced-stage MS group,
highlighting reduced control, increased variability,
and a lack of stability in rotational movements. In
contrast, Group A demonstrates intermediate P2P
values, indicating some variability but with relatively
more control than Group B, while the Healthy group
consistently exhibits the lowest P2P values, reflecting
smoother, more controlled movement patterns.
Table 3: The comparison of ROM peak to peak value across
the three groups.
Measure Healthy
Controls
Group A Group B
Ri
g
ht Roll 0.51 0.57 0.59
Right Pitch 0.11 0.17 0.20
Right Yaw 0.06 0.07 0.19
Left Roll 0.43 0.58 0.84
Left Pitch 0.12 0.18 0.29
Left Yaw 0.14 0.18 0.24
3.1.2 ROM Standard Deviation Value
Across the Groups
Standard Deviation (SD) quantifies the level of
variation or dispersion in ROM data, where a higher
SD value reflects greater variability in movement
patterns. In this study, examining the dispersion of
ROM values is crucial for assessing movement
consistency, which is a key indicator of mobility
impairment in MS patients. As seen in Table 4, Group
B demonstrates higher SD values across five of six
ROM types compared to Group A and the Healthy
group, highlighting increased variability and reduced
movement consistency. This heightened variability
likely reflects the challenges in balance and
coordination associated with advanced MS,
underscoring the progressive impact of the disease on
motor control. In contrast, Group A shows moderate
SD values, suggesting better control than Group B but
with more variability than the Healthy group, which
consistently displays the lowest SD values, indicative
of smooth and stable movement patterns.
Table 4: The comparison of ROM Standard Deviation value
across the three groups.
Measure Healthy
Controls
Group A Group B
Ri
g
ht Roll 0.08 0.07 0.11
Ri
g
ht Pitch 0.02 0.03 0.04
Right Yaw 0.02 0.03 0.04
Left Roll 0.07 0.09 0.17
Left Pitch 0.03 0.03 0.05
Left Yaw 0.02 0.02 0.05
3.1.3 ROM Entropy Value Across the
Groups
As the entropy measures the complexity and
unpredictability of the ROM data, higher entropy
values suggest a more complex movement pattern,
which could be indicative of compensatory strategies
in MS patients. Conversely, lower entropy may
indicate more stereotyped and less varied movements,
potentially reflecting reduced motor function. In our
study, Group B consistently shows higher entropy
across all ROM types, indicating that their movements
are less predictable and more erratic (Table 5). This
could be due to a lack of coordination and stability as
the disease progresses. Group A shows moderately
increased entropy compared to the Healthy group,
which makes sense as early-stage MS patients may
already experience some irregularities in movement,
though not as severe as those in advanced stages.
Healthy individuals have the lowest entropy, indicating
controlled and predictable movement patterns.
BIOSIGNALS 2025 - 18th International Conference on Bio-inspired Systems and Signal Processing
976

Table 5: The comparison of ROM Entropy value across the
three groups.
Measure Healthy
Controls
Group A Group B
Ri
g
ht Roll 1.14 1.25 3.48
Ri
g
ht Pitch 1.14 1.28 3.48
Right Yaw 1.14 1.25 3.48
Left Roll 1.14 1.28 3.57
Left Pitch 1.14 1.25 3.54
Left Yaw 1.14 1.29 3.54
3.1.4 ROM Skewness Value Across the
Groups
As the skewness assesses the asymmetry of the
distribution of ROM data, it can help to identify if a
particular group has a tendency toward higher or
lower ROM measurements. According to Table 6,
both Group A and Group B exhibit high negative
skewness values in roll ROM, indicating a leftward
(negative) bias in their movement distribution. This
could suggest that their rolling motions tend to be
skewed toward a limited range, potentially due to
muscular or motor control issues. Healthy individuals
have slightly less negative skewness, indicating more
balanced motion distributions. The statistical analysis
of ROM data across different groups has revealed
significant insights into the movement capabilities of
MS patients, particularly highlighting the differences
between MS patients with mild motor impairments
and patients with moderate to severe motor
impairments. The measures of central tendency,
variability, energy, complexity, and distribution
shape all underscore the functional limitations
experienced by individuals with MS. Such insights
are crucial for developing targeted rehabilitation
strategies aimed at improving mobility and quality of
life for patients suffering from this condition.
Table 6: The comparison of ROM Skewness value across
the three groups.
Measure Healthy
Controls
Group A Group B
Right Roll -1.25 -3.39 -3.64
Right Pitch -1.88 -2.43 -0.13
Ri
g
ht Yaw 0.71 1.02 1.18
Left Roll -1.53 -3.81 -2.54
Left Pitch 0.34 -2.70 -0.56
Left Yaw 0.24 0.38 -0.92
3.1.5 ROM Time to Peak Value Across the
Groups
The Healthy Group reaches peak ROM the fastest,
with notably low times for Right Roll, Right Yaw and
Left Roll, which aligns with normal motor control and
strength for efficient movement (Table 7). Group B
has a longer time-to-peak in most ROM measures
(Right Roll, Right Pitch, Left Roll and Left Yaw)
indicating that severe MS patients, take longer to
reach their maximum ROM. This likely reflects
greater challenges in motor control and muscular
strength.
Table 7: The comparison of ROM Time to Peak value
across the three groups in seconds (s).
Measure Healthy
Controls
Group A Group B
Ri
g
ht Roll 4 12 19
Ri
g
ht Pitch 11 9 32
Ri
g
ht Yaw 2 11 4
Left Roll 7 13 23
Left Pitch 5 7 5
Left Yaw 11 11 25
4 DISCUSSIONS
4.1 Interpretation of the Results from
Clinical Perspective
Overall, the extracted features clearly illustrate that
Group B, which represents individuals with severe
motor impairment, demonstrated more pronounced
and significant differences in their ROM
characteristics when compared to Group A and
Healthy group, and showed highly irregular ROM
patterns, particularly in Roll movements, where sharp
peaks and drops are evident. Group A demonstrates
more stability than Group B but less control than the
Healthy group. This observation is logical, as
advanced stages of MS are typically associated with
greater functional limitations and variability in
movement patterns, leading to a more evident
expression of motor deficits. Interestingly, while
Group A is characterized by lower motor impairment,
it consistently exhibited intermediate values across in
most extracted features such as standard deviation,
peak to peak, entropy. This indicates that even in the
early stages of MS, individuals may experience subtle
yet meaningful variations in their movement patterns
that can be overlooked in traditional clinical
assessments. Group A patients, as the early-stage
patients tended to complete the task with increased
speed and exerted additional effort, likely as an
attempt to demonstrate their ability to perform certain
movements with ease. The presence of these
intermediate values highlights the importance of
utilizing quantitative measures to capture nuances in
Enhanced Assessment of Gait Dynamics in Multiple Sclerosis: A Signal Processing Approach for Extracting Range of Motion Using
Wearable IMUs
977

motor performance, as reliance on observable
changes alone may lead to an underestimation of
impairments. Overall, our findings underscore the
utility of detailed ROM assessments in differentiating
movement patterns among various stages of MS.
From a clinical perspective, the ROM metrics
analyzed in this study provide actionable insights into
motor impairments in MS patients. The increased
variability and entropy observed in Group B may
indicate a need for targeted interventions aimed at
improving balance and coordination. Similarly, the
asymmetrical gait patterns highlighted by skewness
metrics could guide clinicians in tailoring
rehabilitation programs to address specific motor
deficits. By integrating these objective measures into
routine clinical practice, healthcare professionals can
enhance the accuracy of disease monitoring and
personalize treatment plans.
Comparing these results to earlier studies on MS
and mobility limitations, this study uniquely
quantifies ROM variability calculated from IMU raw
signals, providing a more granular view of the
asymmetrical and erratic movement patterns in
patients with MS by extracting different time domain
and statistical features. In contrast to prior research,
which primarily relied on the directly reported
spatiotemporal gait parameters provided by IMU
recording systems, our study adopted a more
sophisticated approach by independently processing
the raw IMU signals to extract ROM metrics. Rather
than depending solely on system-generated
parameters, we applied signal processing techniques,
including quaternion to Euler angle conversion, to
obtain precise, real-time ROM measurements. This
methodology allowed us to capture nuanced joint
motion patterns, providing a more granular analysis
of movement dynamics, which may reveal subtle
variations in mobility that standard IMU reported
parameters could overlook. The ROM metrics
explored here, such as peak-to-peak, entropy,
kurtosis, and skewness, provide clinicians with an
enriched understanding of MS patients’ movement
consistency and variability. For patients with
moderate to severe impairment, the ability to detect
high variability and asymmetrical movements could
support targeted physical therapy interventions,
aiming to improve balance and reduce fall risks.
Additionally, this study suggests the potential role of
IMUs and ROM analysis in developing predictive
models for motor function decline in MS, which can
assist clinicians in modifying treatment strategies.
MS disease classification primarily rely on
spatiotemporal gait parameters, such as step length
and walking speed, reported by IMU systems, which
often lack the sensitivity to detect subtle motor
impairments. However, this study introduces a novel
approach that leverages ROM-based metrics which
capture the variability, complexity, and asymmetry in
gait dynamics and by incorporating these features,
this study aims to enhance the sensitivity and
specificity of MS disease classification.
4.2 Limitations
While the study presents promising results,
limitations include the small sample size and potential
variability in sensor placement, which may influence
ROM accuracy.
5 FUTURE DIRECTIONS
Future research could expand on this work by
incorporating a larger, more diverse patient
population and exploring longitudinal ROM changes
post-rehabilitation to assess therapy efficacy. Further,
integrating machine learning techniques with ROM
metrics could enhance the predictive power of these
measures, potentially leading to automated, real-time
analysis in clinical settings.
6 CONCLUSIONS
In conclusion, our analysis of range of motion (ROM)
features and their visualizations has significantly
enhanced our understanding of the differences among
the three participant groups. Group B’s heightened
ROM variability reflects impaired motor control,
which is consistent with prior research linking
advanced MS stages to increased motor instability
and reduced gait consistency. These findings
underscore the potential for using ROM metrics as
biomarkers for tracking MS progression and tailoring
rehabilitation approaches. By identifying and
analyzing these subtle differences, clinicians can
improve diagnostic accuracy and better tailor
interventions to meet the specific needs of patients at
different stages of the disease, ultimately enhancing
their mobility and quality of life.
ACKNOWLEDGEMENTS
This study was conducted using the service and
infrastructure of Koc University Research Center for
Translational Medicine (KUTTAM).
BIOSIGNALS 2025 - 18th International Conference on Bio-inspired Systems and Signal Processing
978

REFERENCES
Agnew, R. P. (1944). Euler Transformations. American
Journal of Mathematics, 66(2), 313. https://doi.org/
10.2307/2371990
Blandeau, M., Guichard, R., Hubaut, R. & Leteneur, S.
(2023). IMU positioning affects range of motion
measurement during squat motion analysis. Journal of
Biomechanics, 153(April). https://doi.org/10.1016/
j.jbiomech.2023.111598
Coca-Tapia, M., Cuesta-Gómez, A., Molina-Rueda, F. &
Carratalá-Tejada, M. (2021). Gait pattern in people
with multiple sclerosis: A systematic review.
Diagnostics, 11(4), 1–11. https://doi.org/10.3390/diag
nostics11040584
Das, P., Chakravarty, K., Chowdhury, A., Chatterjee, D.,
Sinha, A. & Pal, A. (2018). Improving joint position
estimation of Kinect using anthropometric constraint
based adaptive Kalman filter for rehabilitation.
Biomedical Physics and Engineering Express, 4(3).
https://doi.org/10.1088/2057-1976/aaa371
Diebel, J. (2006). Representing attitude: Euler angles, unit
quaternions, and rotation vectors. Matrix, 58, 1–35.
ftp://sbai2009.ene.unb.br/Projects/GPS-
IMU/George/arquivos/Bibliografia/79.pdf
Giannakopoulos, T. & Pikrakis, A. (2014). Introduction to
Audio Analysis: A MATLAB Approach. In
Introduction to Audio Analysis: A MATLAB Approach
(pp. 1–266). https://doi.org/10.1016/C2012-0-03524-7
Grisbrook, T., Imms, C., Walmsley, C. P., Campbell, A.,
Elliott, C. & Williams, S. A. (2018). Measurement of
upper limb range of motion using wearable sensors: a
systematic review. Sports Medicine - Open.
Gülşen, Ç., Söke, F., Aydin, F., Özcan Gülşen, E., Yilmaz,
Ö., Koçer, B., Çürük, E., Demirkaya, Ş. & Yücesan, C.
(2024). Effect of task difficulty on dual-task cost during
dual-task walking in people with multiple sclerosis.
Gait and Posture, 114(March), 95–100.
https://doi.org/10.1016/ j.gaitpost.2024.09.003
Heesen, C., Böhm, J., Reich, C., Kasper, J., Goebel, M. &
Gold, S. M. (2008). Patient perception of bodily
functions in multiple sclerosis: Gait and visual function
are the most valuable. Multiple Sclerosis, 14(7), 988–
991. https://doi.org/10.1177/1352458508088916
Huang, J., Wang, H., Wu, Q., Yin, J., Zhou, H. & He, Y.
(2024). Clinical research on neurological and
psychiatric diagnosis and monitoring using wearable
devices: A literature review. Interdisciplinary
Medicine, March. https://doi.org/10.1002/inmd.202300
37
Keskinoğlu, C. & Aydın, A. (2021). Wearable wireless
low-cost electrogoniometer design with Kalman filter
for joint range of motion measurement and 3D
modeling of joint movements. Proceedings of the
Institution of Mechanical Engineers, Part H: Journal of
Engineering in Medicine, 235(2), 222–231.
https://doi.org/10.1177/0954411920971398
LaRocca, N. G. (2011). Impact of Walking Impairment in
Multiple Sclerosis. The Patient: Patient-Centered
Outcomes Research, 4(3), 189–201. https://doi.org/
10.2165/11591150-000000000-00000
Latimer, C. G. (1948). Quaternion algebras. Duke
Mathematical Journal, 15(2), 357–366. https://doi.org/
10.1215/S0012-7094-48-01534-8
Senesh, M. & Wolf, A. (2009). Motion estimation using
point cluster method and Kalman filter. Journal of
Biomechanical Engineering, 131(5). https://doi.org/
10.1115/1.3116153
Soucie, J. M., Wang, C., Forsyth, A., Funk, S., Denny, M.,
Roach, K. E. & Boone, D. (2011). Range of motion
measurements: Reference values and a database for
comparison studies. Haemophilia, 17(3), 500–507.
https://doi.org/10.1111/j.1365-2516.2010.02399.x
Torres-Pareja, M., Sánchez-Lastra, M. A., Iglesias, L.,
Suárez-Iglesias, D., Mendoza, N. & Ayán, C. (2019).
Exercise interventions for improving flexibility in
people with multiple sclerosis: A systematic review and
meta-analysis. Medicina (Lithuania), 55(11).
https://doi.org/10.3390/medicina55110726
Enhanced Assessment of Gait Dynamics in Multiple Sclerosis: A Signal Processing Approach for Extracting Range of Motion Using
Wearable IMUs
979
