
LostPaw: Finding Lost Pets Using a Contrastive Learning-Based
Transformer with Visual Input
Andrei Voinea, Robin Kock and Maruf A. Dhali
a
Department of Artificial Intelligence, Bernoulli Institute, University of Groningen, 9747 AG Groningen, The Netherlands
Keywords:
Contrastive Learning, Neural Networks, Object Detection, Transformers.
Abstract:
Losing pets can be highly distressing for pet owners, and finding a lost pet is often challenging and time-
consuming. An artificial intelligence-based application can significantly improve the speed and accuracy of
finding lost pets. To facilitate such an application, this study introduces a contrastive neural network model
capable of accurately distinguishing between images of pets. The model was trained on a large dataset of dog
images and evaluated through 3-fold cross-validation. Following 350 epochs of training, the model achieved a
test accuracy of 90%. Furthermore, overfitting was avoided, as the test accuracy closely matched the training
accuracy. Our findings suggest that contrastive neural network models hold promise as a tool for locating
lost pets. This paper presents the foundational framework for a potential web application designed to assist
users in locating their missing pets. The application will allow users to upload images of their lost pets and
provide notifications when matching images are identified within its image database. This functionality aims
to enhance the efficiency and accuracy with which pet owners can search for and reunite with their beloved
animals.
1 INTRODUCTION
Experiencing the loss of a pet can be deeply traumatic
for owners, who frequently have difficulty locating
them even after utilizing flyers, online searches, and
private investigators. Since pets can roam far from
home, conventional search strategies often prove in-
effective. Without unified communication channels,
assistance can be limited. Artificial intelligence can
help identify lost pets through image analysis, though
comparing images can still be challenging for vol-
unteers. In recent years, contrastive learning has
emerged as a promising solution to the problem of
differentiating between two or more input data classes
in computer vision (Chen et al., 2020). This approach
involves training a machine learning model to identify
subtle differences between images by comparing pairs
of data samples. This technique has demonstrated
notable efficacy in various visual recognition tasks,
such as image classification, where models are trained
to differentiate between objects or scenes based on
visual features. Contrastive learning methods effi-
ciently learn high-dimensional data representations
by comparing classes, enabling them to handle trans-
formations like rotation and scaling. For instance, a
a
https://orcid.org/0000-0002-7548-3858
model trained on pet images can help identify miss-
ing animals, aiding owners and shelters. Analyzing
image pairs allows a contrastive neural network to dis-
tinguish between breeds and individuals, improving
lost pet searches. This paper will explore the technical
aspects and applications of this approach to develop a
complete web-based solution.
2 RELATED WORKS
Several components are required to create a con-
trastive learning model capable of differentiating be-
tween images of pets. A fundamental part of such a
model is a neural network architecture that can learn a
robust and effective data representation. In this study,
we employed the Vision Transformer model as the
foundation of our contrastive learning model. In ad-
dition, we used the Detection Transformer model to
extract the pets from the images and the AutoAug-
ment feature to augment the images. Finally, to opti-
mize the model, we utilize a contrastive loss function,
which allows the model to learn the underlying struc-
ture of the data by contrasting similar and dissimi-
lar examples. In the following sections, we provide
a more in-depth description of these technologies and
Voinea, A., Kock, R. and Dhali, M. A.
LostPaw: Finding Lost Pets Using a Contrastive Learning-Based Transformer with Visual Input.
DOI: 10.5220/0013261600003905
In Proceedings of the 14th International Conference on Pattern Recognition Applications and Methods (ICPRAM 2025), pages 757-763
ISBN: 978-989-758-730-6; ISSN: 2184-4313
Copyright © 2025 by Paper published under CC license (CC BY-NC-ND 4.0)
757

their implementation in our contrastive learning trans-
former model.
2.1 Transformer Models
Transformer models are a type of neural network ar-
chitecture widely successful in various natural lan-
guage processing tasks and have achieved state-of-
the-art results on a large selection of benchmarks
(Vaswani et al., 2017). Self-attention mechanisms en-
able the model to focus on different parts of input data
at various times. This allows it to capture long-range
dependencies, especially for tasks like language trans-
lation, where a word’s meaning depends on context.
Additionally, transformers utilize multi-headed atten-
tion, allowing simultaneous focus on multiple data
parts. This enhances processing capabilities and over-
all performance on numerous tasks, including natural
language processing, image classification, and object
detection.
2.2 Detection Transformer
The Detection Transformer (DETR) is an end-to-
end object detector that uses a Transformer encoder-
decoder architecture (Carion et al., 2020). It fea-
tures a convolutional neural network (CNN) back-
bone that extracts image features, which are flattened
and combined with positional encoding before be-
ing processed by the Transformer encoder to gener-
ate feature maps representing objects. The output
from the encoder is fed into a Transformer decoder
that uses learned positional embeddings called object
queries. The decoder creates embeddings for each
query, which are then classified as detections or ”no
object” via a shared feedforward network. When de-
tection occurs, the model provides the object’s class
(e.g., cat or dog) and the bounding box indicating its
location in the image.
2.3 Vision Transformer
The Vision Transformer (ViT) is a neural network
architecture for image classification that processes
raw pixel values instead of using convolutional lay-
ers (Dosovitskiy et al., 2021). It consists of trans-
former blocks with self-attention mechanisms that
analyze 16×16 pixel patches from images, allowing
the model to determine the importance of different
patches based on their relationships. The patches
are embedded into a high-dimensional space and pro-
cessed through twelve transformer blocks, which out-
put a new sequence of patches. The output is then
passed through a linear layer and a softmax function
to produce final class probabilities. ViT is trained
with supervised learning, using ground truth labels to
calculate cross-entropy loss for weight updates. This
enables models trained for classification tasks to be
fine-tuned for various applications, including image
pair comparisons.
2.4 AutoAugment
AutoAugment is a method that automates data aug-
mentation, which involves applying transformations
to images in a dataset to increase its size and enhance
the robustness of machine learning models (Cubuk
et al., 2019). It frames the task of finding the opti-
mal augmentation policy as a discrete search prob-
lem, utilizing a recurrent neural network as a con-
troller to sample policies that dictate which image
operations to apply, their probabilities, and their in-
tensity. The algorithm is trained using policy gradi-
ent methods, allowing it to adjust based on the val-
idation accuracy of a neural network trained with a
fixed architecture. AutoAugment offers various pre-
configured policies with transformation functions, in-
cluding shearing, translation, rotation, and adjust-
ments in contrast, brightness, and sharpness. This
approach effectively enhances data augmentation and
improves the performance of models, especially in
image classification tasks.
2.5 Contrastive Loss
Contrastive loss is a loss function widely used in
machine learning for unsupervised learning (Hadsell
et al., 2006). It aims to learn data representations
highlighting class relationships and differences be-
tween similar and dissimilar examples. This loss
function is often applied with Siamese networks,
which consist of two or more identical subnetworks
that process different inputs (Koch et al., 2015).
Trained with the exact weights, these subnetworks
learn a shared data representation. The contrastive
loss is then computed from this representation, guid-
ing updates to the network’s weights. As proposed
by (Hadsell et al., 2006), the contrastive loss func-
tion, shown in Equation 1, uses d to calculate the Eu-
clidean distance between two pet vectors and m as a
margin that controls sensitivity in classifying images
as similar. The function minimizes the distance be-
tween feature vectors of the same pet while maximiz-
ing the distance between those of different pets. Fur-
thermore, the loss function ensures that the distance
between the feature vectors of dissimilar examples ex-
ceeds the margin given by the hyperparameter m.
ICPRAM 2025 - 14th International Conference on Pattern Recognition Applications and Methods
758
L (X
1
, X
2
) =
1
2
E
"(
max{m − d(X
1
, X
2
), 0}
2
different pet
d(X
1
, X
2
)
2
same pet
#
(1)
3 METHODOLOGY
In this study, we develop a contrastive neural network
model to distinguish between pet images. Trained on
a large dataset of various dog breeds, the model is
evaluated on a separate test set. Implemented using
the PyTorch framework (Paszke et al., 2017), it uti-
lizes supervised learning techniques. The following
subsection will cover the dataset, model architecture,
training procedure, and evaluation metrics used to as-
sess performance.
3.1 Dataset
To create the dataset used in this study, we obtain im-
ages of pets from adoption websites such as Adop-
tAPet (Inc and Affiliates, 2023). Each image is fed
through the DETR model, and the resulting bounding
boxes of pets are used to crop them from the image.
We focus only on images of dogs, resulting in 31, 860
pets being stored with an average of 2.47 images per
pet (78, 702 total images). The cropped images are
then resized to fit a square of 384 × 384 pixels, and if
the image is not wide or tall enough, the missing area
is filled with black. Each image is then augmented
twice using a pre-trained AutoAugment model, which
follows the policies CIFAR10, ImageNet, and SVHN.
A test set is created by setting aside images extracted
from 3595 pets, totaling 8854 images. The augmented
dataset contained 236, 106 train images and 26, 562
test images, which are used to train and evaluate the
contrastive neural network model developed in this
study. For a schematic view of the data pipeline, see
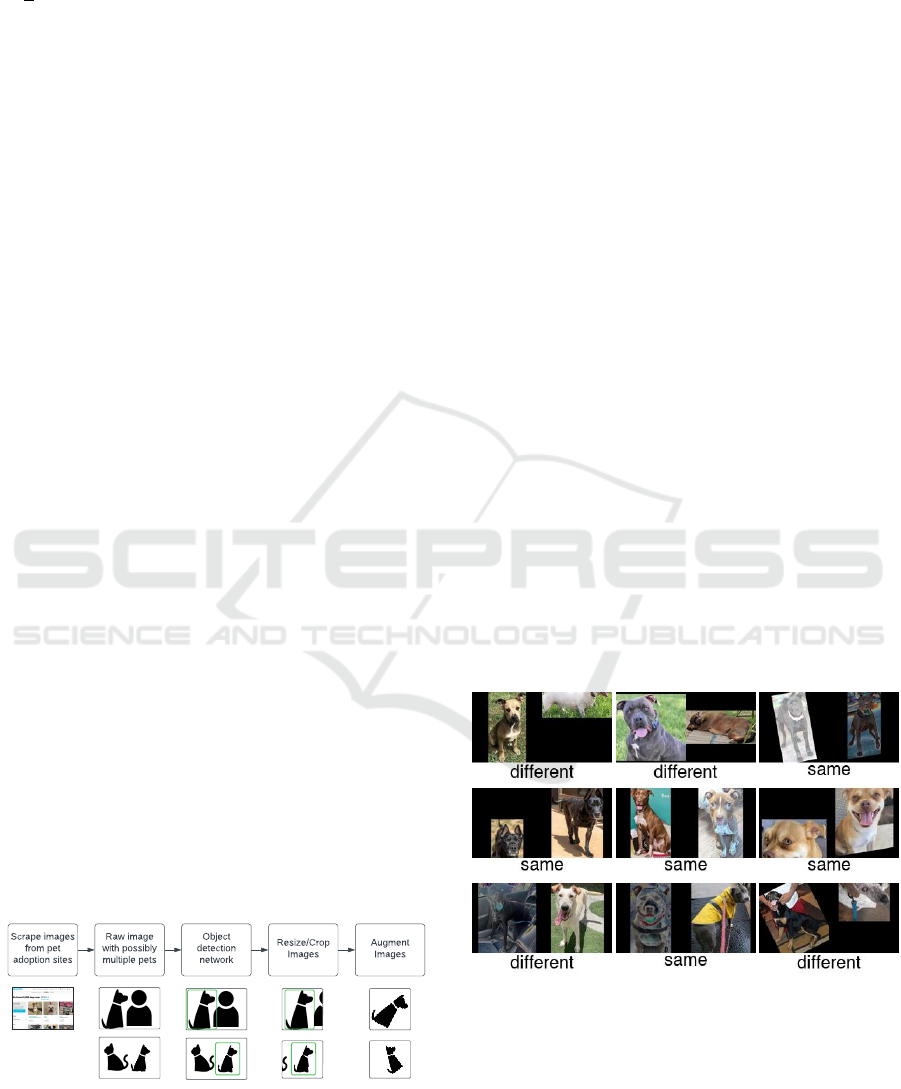
Figure 1.
Raw image
with possibly
multiple pets
Object
detection
network
Augment
Images
Resize/Crop
Images
Scrape images
from pet
adoption sites
Figure 1: Data collection process. The top nodes represent
the individual steps that are taken for each image. The di-
agrams at the bottom show possible configurations of each
step.
To enable the use of our data for contrastive learn-
ing, we need to further combine the images into pairs,
forming a pairwise dataset. Each pair is labeled as ei-
ther different or same and contains two images of size
384 × 384. The pairwise dataset is compiled using a
random number generator to select labels and images,
and a seed value is used to ensure that the dataset is re-
producible between runs. To sample a pair during the
dataset generation, we first choose whether the label is
same or different based on a similarity probability. A
value of 50% is chosen for this probability to create an
approximately equal number of the same and different
pairs. By selecting pairs to be the same or different
with equal probability, we ensure that the contrastive
ViT model is exposed to a balanced set of training la-
bels. This can help prevent the model from becoming
biased towards one type of example or the other and
improve the model’s generalization performance on
the held-out test set. Following this, the images for
the pair are selected from the cropped image set de-
scribed earlier. If the label is different, we randomly
select two different pets from the dataset (using the
same seed described earlier) and then select an image
for each pet. If the label is same, a random pet is cho-
sen, and the pair of images comprises two different
images of the same pet. Furthermore, as each image
in the dataset is augmented twice, we ensure that we
never choose two augmentations of the same image.
The process of selecting pairs is repeated to generate
an extensive set of training pairs for the contrastive
ViT model, an example of which can be observed in
Figure 2.
Figure 2: Example data pairs with labels underneath. Some
of the images have been augmented.
As the dataset is dynamically generated during
training, validating a model requires special attention
due to its stochastic nature. In this study, we em-
ploy k-fold cross-validation with a pairwise dataset,
assigning each pair to one of k distinct folds. This en-
sures that during testing, each fold is used only once
LostPaw: Finding Lost Pets Using a Contrastive Learning-Based Transformer with Visual Input
759
while the remaining folds are for training, prevent-
ing exposure to the same pairs. However, since pairs
are formed from images, there is a possibility that the
same images may appear in both training and cross-
validation. Due to the random selection process, it’s
possible for an image to be compared to one it has en-
countered before. Nevertheless, the large size of the
dataset makes duplicate pairs unlikely. To mitigate
this, we present additional results from a held-out test
set featuring entirely novel pets.
ViT
Features
ViT
Features
ViT
Features
+
-
ViT: Visual Transformer
ViT Patch Embedding
ViT Pooling [768]
2× Dense [1024, ELU]
Dense [512]
12× Encoder layers
Self Attention
Dense [768, RELU]
Layer Norm
Dense [768, RELU]
Dense [3072, GELU]
Dense [768, RELU]
Layer Norm
Features
Contrastive
loss learning
Figure 3: Architecture of the Contrastive Vision Trans-
former model.
3.2 Model Architecture
To develop the contrastive ViT model, we use ViT as
the backbone of the model (Wu et al., 2020). The ViT
output is flattened and followed by three fully con-
nected layers to achieve the desired latent vector size.
The model features two hidden layers with twice the
number of neurons as the latent space and a final out-
put layer matching the latent space size. These lay-
ers transform the ViT backbone’s output into a com-
pact representation of the image’s structure. We use
the Exponential Linear Unit (ELU) activation func-
tion between the layers to propagate negative val-
ues for the contrastive loss function. For a graphi-
cal overview of the model architecture, see Figure 3.
During training, we fine-tune only the last three lay-
ers of the model while keeping the backbone parame-
ters frozen. This approach, while limiting the model’s
ability to learn new lower-level features, results in
a more stable training process and reduces the risk
of overfitting. An ablation study where all param-
eters are updated revealed a significant drop in per-
formance, which is discussed in the Results section.
We select the hyperparameters for the contrastive ViT
model through parameter sweeps. By training with
various values and evaluating the model on a vali-
dation set, we identify the optimal hyperparameters.
This process helps us fine-tune the model to better dif-
ferentiate between pictures of pets. Table 1 lists these
hyperparameters.
Table 1: Hyperparameters for the contrastive ViT model.
Name Value
Epochs 350
Latent Space Size 512
Batch Size 8
Batch Count per Epoch 128
Test Batch Size 8
Test Batch Count 128
Optimizer AdamW
Learning Rate 5.0e-5
Weight Decay 2.0e-4
Contrastive Margin 1.66
3.3 Evaluation Metrics
We use k-fold cross-validation to evaluate the per-
formance of the contrastive learning model. We use
k = 3 for our cross-validation, which resulted in 3 dif-
ferent models being trained and evaluated. We trained
the model for a fixed number of epochs for each fold
and used the validation set to tune the model’s hyper-
parameters. Once the model was trained, we evalu-
ated it on the test set and recorded its performance in
terms of accuracy, the type I and type II errors, and
the F
1
score. The type I error represents the propor-
tion of false positives, while the type II error repre-
sents the probability of false negatives. Using these
values, we calculate the precision and recall of our
model, which are used to obtain the F
1
score value
(see Equation 2). The precision and recall values rep-
resent the performance of the classification model on
the given dataset.
F
1
= 2 ·
Precision · Recall
Precision + Recall
(2)
4 RESULTS
Throughout 350 epochs, an average F
1
score of 88.8%
on the cross-validation set was achieved. In addition,
the model was trained on a large dataset and did not
appear to be overfitting, as the validation accuracy
closely followed the training accuracy (see Figure 4a).
In addition to the accuracy results, we further exam-
ined the loss values of the model during training (see
Figure 4b). We observed that the loss value steadily
dropped from a starting value of approximately 1.16
to a final value of approximately 0.04. This trend gen-
erally indicates the model is steadily learning a better
representation of the data throughout training. Fur-
thermore, the low loss value suggests that the model
ICPRAM 2025 - 14th International Conference on Pattern Recognition Applications and Methods
760
was able to learn an adequate representation of the
data, which could potentially allow the model to make
accurate decisions on unseen samples.
(a) Accuracy.
(b) Loss.
Figure 4: Mean train accuracy and loss of the contrastive
ViT model, averaged over three model runs. The data for
accuracy was smoothed by averaging the values every five
epochs.
When examining the errors of the model (see Fig-
ure 5), we observed that the model initially classified
every pair of pet images as the same pet. However,
over the course of training, the model learned to dif-
ferentiate between different pets, and the type I error
decreased. Furthermore, the type II error was very
close to zero for most of the training period. These re-
sults suggest that the model could learn a robust and
relatively effective representation of the data, which
could distinguish between different pets.
Table 2: Accuracy & errors of the model for various sets.
Dataset
Metric Training Cross-
val.
Held-
out
Held-out
std.
Accuracy 0.8687 0.8737 0.9028 0.0036
Type I error 0.1309 0.1261 0.0966 0.0036
Type II error 0.0004 0.0002 0.0006 0.0003
F
1
score 0.8838 0.8880 0.9108 0.0041
When examining the outcomes of the models on
the held-out test set, as illustrated in Table 2, we noted
that the average F
1
score was 91.1% (SD=0.41%).
Figure 5: Type I and II errors of the model on the test set
at every epoch. The data for the errors were smoothed by
averaging the values every five epochs.
Similarly, the mean type I error was 9.7%, and the
type II error was 0.06%. These outcomes indicate an
improvement over the metric values recorded on the
train and validation sets. This may be attributed to
various reasons, which are discussed in detail in the
subsequent section. However, the results still suggest
that the model has effectively generalized to new data.
Furthermore, during the ablation study, we observed
that a fully-trained contrastive ViT model achieved
a cross-validation F
1
score of 80.0% and a held-out
test set F
1
score of 78.6%. This provides strong sup-
port for our decision to set the layers of the backbone
model as fixed. In particular, the model appears to
overfit the data more than it does with frozen layers
since the held-out test set performance is inferior to
the validation performance. For more results of the
ablation study, see Figure 6 in Appendix 5.
5 CONCLUSIONS
This study involved the development of a contrastive
neural network model to distinguish between images
of dogs, with its performance evaluated on a held-out
test set. Results from a three-fold cross-validation in-
dicated that the model can accurately differentiate be-
tween pet images and generalize well to unseen data.
The following section provides a detailed discussion
of the evaluation results and the implications of these
findings for applying artificial intelligence in search-
ing for lost pets. One concern is the relatively high
incidence of false positives. While this may initially
appear to be a limitation, it could be beneficial in lo-
cating lost pets, particularly when a few pets are re-
ported missing in a given area, allowing for easy dis-
missal of incorrect identifications. Moreover, the use
of the AutoAugment feature, which sometimes alters
the colors of pet images, may influence the accuracy
of the model. However, this variation could enhance
generalization by allowing the model to learn more
LostPaw: Finding Lost Pets Using a Contrastive Learning-Based Transformer with Visual Input
761

robust features, improving its performance on real-
world data with varying color and lighting conditions.
A potential issue has been identified in the model’s
accuracy metrics: both the cross-validation accuracy
and the held-out test set accuracy are higher than the
training accuracy, which needs further investigation.
The higher cross-validation accuracy may result from
random fluctuations, as the two accuracies often inter-
sect during training, as shown in Figure 4a. The im-
provement of over 1% in the held-out test set’s perfor-
mance compared to the cross-validation set is unclear
and could be due to differences in data distribution or
the smaller sample size in the held-out set. However,
measures have been taken to eliminate any system-
atic errors that might affect the observed performance
gains. Future research could explore expanding the
network to include various types of pets. This might
involve using the DETR to identify the specific pet in
an image, such as a cat or dog, and then passing it to
a fine-tuned model that specializes in comparing pets
within each category. This method would combine
the strengths of both DETR and ViT models, result-
ing in a more robust system through enhanced con-
trastive data. Additionally, while this study focused
on dog images, the described contrastive learning ap-
proach can be applied to other datasets. Training on
diverse images enables the model to differentiate be-
tween various classes, with potential applications in
medical image classification, wildlife species identi-
fication, and handwriting comparison. Overall, the
study suggests that contrastive learning can signifi-
cantly improve image classification accuracy.
REFERENCES
Carion, N., Massa, F., Synnaeve, G., Usunier, N., Kirillov,
A., and Zagoruyko, S. (2020). End-to-End Object De-
tection with Transformers. In Vedaldi, A., Bischof,
H., Brox, T., and Frahm, J.-M., editors, Computer Vi-
sion – ECCV 2020, Lecture Notes in Computer Sci-
ence, pages 213–229, Cham. Springer International
Publishing.
Chen, T., Kornblith, S., Norouzi, M., and Hinton, G. (2020).
A simple framework for contrastive learning of visual
representations. In III, H. D. and Singh, A., editors,
Proceedings of the 37th International Conference on
Machine Learning, volume 119 of Proceedings of Ma-
chine Learning Research, pages 1597–1607. PMLR.
Cubuk, E. D., Zoph, B., Mane, D., Vasudevan, V., and Le,
Q. V. (2019). AutoAugment: Learning Augmentation
Strategies from Data. In 2019 IEEE/CVF Conference
on Computer Vision and Pattern Recognition (CVPR),
pages 113–123. IEEE Computer Society.
Dosovitskiy, A., Beyer, L., Kolesnikov, A., Weissenborn,
D., Zhai, X., Unterthiner, T., Dehghani, M., Minderer,
M., Heigold, G., Gelly, S., Uszkoreit, J., and Houlsby,
N. (2021). An Image is Worth 16x16 Words: Trans-
formers for Image Recognition at Scale.
Hadsell, R., Chopra, S., and LeCun, Y. (2006). Dimension-
ality Reduction by Learning an Invariant Mapping.
In 2006 IEEE Computer Society Conference on Com-
puter Vision and Pattern Recognition (CVPR’06), vol-
ume 2, pages 1735–1742.
Inc, K. P. and Affiliates (2023). AdoptAPet: Search for local
pets in need of a home. https://www.adoptapet.com/,
last visited: 28 April 2023.
Koch, G., Zemel, R., Salakhutdinov, R., et al. (2015).
Siamese neural networks for one-shot image recog-
nition. In ICML deep learning workshop, volume 2.
Lille.
Paszke, A., Gross, S., Chintala, S., Chanan, G., Yang, E.,
DeVito, Z., Lin, Z., Desmaison, A., Antiga, L., and
Lerer, A. (2017). Automatic differentiation in Py-
Torch.
Vaswani, A., Shazeer, N., Parmar, N., Uszkoreit, J., Jones,
L., Gomez, A. N., Kaiser, Ł., and Polosukhin, I.
(2017). Attention is all you need. Advances in neural
information processing systems, 30.
Wu, B., Xu, C., Dai, X., Wan, A., Zhang, P., Yan, Z.,
Tomizuka, M., Gonzalez, J., Keutzer, K., and Vajda,
P. (2020). Visual Transformers: Token-based Image
Representation and Processing for Computer Vision.
APPENDIX
Ablation Study Results
As described in Section 4, an ablation study was per-
formed where the entire ViT model was trained along-
side the final layers using the contrastive loss func-
tion. Comparing these results to those obtained with
the fixed layers, we can see that the fully-trained
model has a higher type I error rate and a lower F
1
score on both the cross-validation and held-out test
sets. This indicates that the fully-trained model is
overfitting the data to some extent, which is expected
given the increased flexibility of the model. Overall,
the results of the ablation study support our decision
to use a fixed ViT backbone with contrastive learn-
ing. This approach appears to be more effective at
learning a robust representation of the data and gen-
eralizing to new samples, as demonstrated by the su-
perior performance of the fixed layers model on both
the cross-validation and held-out test sets.
Model Demonstration
To make the contrastive learning model available to
a broader audience, we developed a web application
ICPRAM 2025 - 14th International Conference on Pattern Recognition Applications and Methods
762
(a) Mean train accuracy and validation ac-
curacy.
(b) Type I and II errors of the model on
the test set.
(c) Loss of contrastive ViT Model.
Figure 6: Results of the ablation study averaged over three
model runs. The data for accuracy was smoothed by aver-
aging the values every five epochs. The data was collected
and processed in the same manner as for the plots presented
in Section 4.
that allows users to upload pictures of dogs and dis-
cover whether there are any similar dogs found in the
system. The web application processes the image us-
ing the contrastive learning model and returns a list of
pets along with their similarity score.
(a) Map of pet sightings.
(b) Image of sighted pet.
(c) User uploaded a picture.
(d) First hit of similar pets.
Figure 7: Screenshots of the web application showing how
users might interact with the website. Clicking the sym-
bol highlighted by the red dashed outline (in 7a) opens
the pop-up shown in 7b. Similarly, clicking the sym-
bol highlighted by the solid red outline opens a picture
upload dialog and displays the results as in 7c and 7d.
For code availability, please follow the following link:
https://github.com/vandrw/lostpaw-transformer.
LostPaw: Finding Lost Pets Using a Contrastive Learning-Based Transformer with Visual Input
763
