
Fish Catch Prediction by Combining Fishing,
Weather and Tidal Data
Tomohiro Tanaka, Yasuyuki Tahara, Akihiko Ohsuga and Yuichi Sei
The University of Electro-Communications, Chofu, Tokyo, Japan
Keywords: Fish Catch Prediction, XGBoost, Meteorological Data, Feature Engineering, Time Series Data.
Abstract: This study presents a model designed to predict days with increased probabilities of fish catches for
inexperienced anglers by utilizing weather and tidal data. Specifically, the study pre-processed catch data,
together with meteorological and tidal data from the Japan Meteorological Agency, to consider different fish
species. The study applied feature engineering techniques, incorporating lag features and moving average
features. Comparative evaluations were conducted against a baseline model that neither accounts for fish
species nor includes lag and moving average features. The proposed method exhibited superior performance
across all evaluation metrics compared to the baseline model. Specifically, the proposed method achieved a
Root Mean Squared Error (RMSE) of 4.36 compared to the baseline's 5.47, a Mean Absolute Error (MAE) of
3.02 versus 4.16, an R² score of 0.20 compared to -0.27, a Mean Absolute Percentage Error (MAPE) of 74.6%
versus 133.0%, and a Median Absolute Error (Median AE) of 2.04 compared to 3.33. These improvements
highlight the effectiveness of the proposed model in enhancing predictive accuracy and reliability.
1 INTRODUCTION
Fishing is widely recognized as a popular recreational
activity worldwide. However, the success of catching
fish depends on various environmental factors,
making it challenging for inexperienced anglers to
predict their daily catch. This issue increases the risk
of beginners going fishing on days when they are
unlikely to catch fish, potentially leading to feelings
of frustration.
This study aims to develop a model that predicts
days with a higher probability of catching fish for
fishing novices by utilizing prior weather forecasts
and tidal data. Specifically, the model seeks to make
it easier to select suitable fishing days, thereby
allowing beginners to enjoy fishing more.
In particular, this research employs machine
learning techniques to predict catch outcomes on
specific days based on historical weather data and
tidal information. The prediction model utilizes
XGBoost, training and predicting separate models for
each fish species. It incorporates lag features from the
past one to seven days and introduces moving average
features over the past three days to capture short-term
trends. Furthermore, the performance of these models
is compared and evaluated against a baseline model
that does not account for fish species and does not use
lag or moving average features.
Experimental results indicate that the proposed
method performs better than the baseline model
across all evaluation metrics, with the use of lag
features and moving average features contributing to
improved prediction accuracy.
Additionally, this paper is structured as follows:
Section 2 covers Related Work, Section 3 introduces
the Proposed Method, Section 4 presents
Experiments and Results, Section 5 discusses these
findings, and Section 6 concludes the study.
2 RELATED WORK
2.1 XGBoost
XGBoost (eXtreme Gradient Boosting) is an
improved version of gradient boosting that allows for
fast and efficient learning. It constructs powerful
predictive models by combining multiple weak
learners. The XGBoost algorithm proceeds through
the following steps:
1108
Tanaka, T., Tahara, Y., Ohsuga, A. and Sei, Y.
Fish Catch Prediction by Combining Fishing, Weather and Tidal Data.
DOI: 10.5220/0013263200003890
In Proceedings of the 17th International Conference on Agents and Artificial Intelligence (ICAART 2025) - Volume 3, pages 1108-1115
ISBN: 978-989-758-737-5; ISSN: 2184-433X
Copyright © 2025 by Paper published under CC license (CC BY-NC-ND 4.0)

1. Definition of the Prediction Function
The prediction function
𝑦
()
is defined as
follows:
𝑦
(
)
=
𝑓
(
𝑥
)
(1)
Here,
𝑦
()
represents the prediction value at the t-th
iteration, and
𝑓
indicates the k-th decision tree.
2.
Optimization of the Objective Function
The objective function 𝐿
()
is defined as
the sum of the loss function ℓ and the
regularization term Ω, and is minimized.
𝐿
(
)
=ℓ
𝑦
𝑦
(
)
+𝛺
(
𝑓
)
(2)
3. Construction of a New Decision Tree
When constructing a new decision tree,
the first-order derivative 𝑔
and the second-
order derivative
ℎ
are used to optimize the
split using the following equation:
𝐿
(
)
≈𝑔
𝑓
(
𝑥
)
+
1
2
ℎ
𝑓
(
𝑥
)
+
𝛺
(
𝑓
)
(3)
4. Updating the Prediction Values
Once a new decision tree is built, it is added
to the original model, and the prediction
values are updated as follows:
𝑦
(
)
=𝑦
(
)
+𝜂
𝑓
(
𝑥
)
(4)
Here, η is the learning rate.
XGBoost prevents overfitting by limiting the
depth of trees and the number of leaf nodes, and by
applying L1/L2 regularization. This approach
effectively controls the complexity of the model
while achieving high prediction accuracy, thus
balancing precision and generalization performance.
2.2 Fishing Catch Prediction Methods
Hashimoto (Hashimoto, 2022) developed a fishing
catch prediction system using data collected from the
fishing information website "Kanpari." In their study,
fishing catch data were gathered through Python-
based web scraping, followed by the imputation of
missing values to construct the dataset. To evaluate
the performance of their model, they compared it with
other machine learning techniques such as LightGBM
and nonlinear SVM. The evaluation criteria included
accuracy and processing time. The results confirmed
that Random Forest outperformed the other methods
in balancing processing speed and accuracy. However,
since their approach involved subjective binary
labeling of "caught" or "not caught," the method
could not predict the exact number of fish caught
objectively. In contrast, this study sets the number of
catches as the target variable, adopting a method that
predicts specific numerical values.
In the study by Zhang (Zhang, 2023), the
objective was to predict salmon catch volumes along
the coastal areas of Hokkaido. They proposed a
comprehensive prediction method that integrated
both long-term and short-term catch data. For long-
term predictions, the ARIMA model was utilized,
while short-term predictions employed LSTM
networks and S-LSTM. This combination effectively
captured variations in catch patterns across different
temporal and geographical scales. Additionally, by
introducing filtering techniques such as data
augmentation based on the Poisson distribution and
the removal of data from specific days, they overcame
data limitations and enhanced prediction accuracy.
Experimental results demonstrated that the proposed
method significantly reduced RMSE compared to
traditional methods like ARIMA, showcasing its
effectiveness. However, Zhang's study focused on a
single fish species, considering only the species-
specific catch patterns and environmental factors. In
contrast, this study targets multiple fish species,
constructing individual prediction models for each
species to accommodate a more diverse range of
catch patterns.
Raman and Das (Raman and Das, 2019)
developed a SARIMA model using quarterly shrimp
catch data from 2001 to 2015 to predict shrimp catch
volumes. The study selected the optimal model based
on the Akaike Information Criterion (AIC) and
Bayesian Information Criterion (BIC), finding that
the SARIMA model, which accounts for seasonal
variations, provided high-precision predictions.
Particularly, in Chilika Lagoon, shrimp catches
peaked during the summer, suggesting that seasonal
environmental factors influence catch volumes.
Furthermore, by introducing exogenous variables
such as water temperature and salinity into the
SARIMA model to form the SARIMAX model,
prediction accuracy was improved. Specifically,
physical and chemical parameters like water
temperature and salinity significantly impacted catch
volumes, enabling the SARIMAX model to achieve
higher prediction accuracy for total catch volumes
compared to the SARIMA model. However, the
environmental factors considered exogenous
variables were limited. In contrast, this study adopts
an approach that utilizes a wide range of features to
comprehensively capture environmental factors.
Fish Catch Prediction by Combining Fishing, Weather and Tidal Data
1109

Yadav et al. (Yadav et al., 2019) aimed to predict
the catch per unit effort (CPUE) of fish by designing
and comparing three types of fuzzy inference systems:
Mamdani FIS, Sugeno FIS, and Sugeno-ANFIS, using
Chl-a and Kd_490 as input variables. These factors are
elements of the marine environment that influence
CPUE. Each model was implemented using
MATLAB's Fuzzy Toolbox, and prediction accuracy
was evaluated using Mean Squared Error (MSE) and
Mean Error Rate. The comparison results showed that
the Sugeno-ANFIS model outperformed the other two
FIS models and maintained high prediction accuracy
even on 28 independent test datasets. This confirmed
that Sugeno-ANFIS is effective in handling complex
and uncertain marine environmental data, making it the
most reliable model for predicting CPUE. However,
the study by Yadav et al. aimed to predict CPUE and
did not focus on catch prediction itself. Additionally,
the authors' feature engineering was limited. In contrast,
the present study introduces methods such as lag
features and moving average features to capture
temporal dependencies in time-series data.
3 PROPOSED METHOD
In this study, this study proposes a method that
combines fishing catch data, weather data, and tidal
data to predict fishing outcomes. This approach aims
to forecast whether fish can be caught on a given day
based on prior forecasts, thereby making it easier for
beginners to choose suitable fishing days. This
section first describes data collection and
preprocessing, followed by the method for
constructing the prediction model.
Additionally, the “number of catches per person
per day” is defined as the “recommendation score.”
3.1 Data Collection
The data used in this study consist of three types:
fishing catch data, weather data, and tidal data. Firstly,
fishing catch data were collected from the official
website of "Yokohama Fishing Piers". The collected
data includes "fishing dates," "number of visitors,"
"water temperature," "weather," and "catch data"
from the "Honmoku Fishing Facility" spanning from
January 1, 2023, to October 2, 2024. The catch data
encompass "fish species" and "number of catches."
Next, weather data were downloaded from the
official website of the Japan Meteorological Agency.
The selected region was Yokohama, and the collected
information includes "average temperature (°C),"
"average wind speed (m/s)," "maximum temperature
(°C)," "minimum temperature (°C)," "maximum wind
speed (m/s)," and "average humidity (%)".
Finally, tidal data were obtained from the Japan
Meteorological Agency's official website. The
retrieved information relates to low tide times.
Although there are two low tides per day, this study
utilizes only the first occurrence.
3.2 Data Preprocessing and Feature
Engineering
To enhance the quality of the data used for
constructing the fishing catch prediction model,
preprocessing was performed. The datasets involved
include fishing catch data, tidal data, and weather data,
each possessing unique characteristics and formats.
Below are the preprocessing steps for each dataset.
3.2.1 Data Preprocessing
Since handling missing values and ensuring data
integrity are essential to model performance, we
addressed any missing values in each dataset first. For
consecutive missing data points, Forward-Fill and
Backward-Fill methods were applied to maintain data
continuity. This process formatted the data into a
structure suitable for numerical analysis.
Additionally, fishing catch data may contain
invalid entries or unnecessary information, which
were excluded through data cleaning procedures.
Formatting date information is also an essential
part of preprocessing. The "date" columns in each
dataset were represented in multiple formats, so they
were uniformly converted to date types.
Finally, the fishing catches data, tidal data, and
weather data were merged based on the data to create
a single integrated dataframe. After merging, missing
values were addressed again using Forward-Fill and
Backward-Fill to ensure data continuity. This
integration maintained consistency across the
datasets while formatting the data appropriately for
the prediction model.
3.2.2 Feature Engineering
To maximize the performance of the prediction model,
feature engineering was conducted. In this study, the
following methods were employed to generate and
transform useful features:
Firstly, lag features were added. This method
captures the influence of past data on current fishing
outcomes. Specifically, features such as the number
of catches, number of visitors, and temperature were
lagged based on the past one to seven days. This
ICAART 2025 - 17th International Conference on Agents and Artificial Intelligence
1110

process allows the model to learn the temporal
dependencies in the time-series data.
Next, moving average features were introduced.
This technique captures short-term trends by
calculating moving averages over the past three days
and using them for current predictions. The moving
average features were shifted to exclude the current
day's data, making it easier for the model to capture
short-term trends.
Furthermore, categorical data were converted into
dummy variables. Transforming categorical data like
fish species into numerical form allows the machine
learning model to process this information effectively.
This conversion allows the incorporation of
categorical data into the model without losing the
information it contains.
Lastly, feature scaling via standardization was
performed. Scaling numerical features are important
for improving the learning efficiency and prediction
accuracy of the model. In this study, all numerical
features were standardized. Standardization scaled
each feature to have a mean of 0 and a standard
deviation of 1, balancing features with different
scales. This approach facilitates efficient learning by
gradient-based algorithms like XGBoost, thereby
enhancing the model's prediction accuracy. The data
used in this study are as follows:
Tidal Data: Low tide times.
Weather Data: Maximum temperature, minimum
temperature, average temperature, average wind
speed, maximum wind speed, average humidity.
Fishing Catch Data: Number of visitors, water
temperature, weather, fish species, number of catches.
3.2.3 Learning Model
In this study, XGBoost was employed as the fishing
catch prediction model. XGBoost is a high-
performance machine learning algorithm based on the
gradient boosting framework, capable of handling
complex datasets.
Furthermore, the study implemented three key
approaches.
First, models were trained individually for each
fish species. By training and predicting models
separately for each species, it became possible to
capture the unique fishing patterns and environmental
factors specific to each species. This approach
enabled flexible predictions that account for
differences between fish species.
Second, lag features were utilized. By adding lag
features from the past one to seven days, the model
learned the impact of historical catch numbers and
weather conditions on current catches. Lag features
capture the temporal dependencies in the time-series
data.
Third, moving average features were introduced.
By calculating moving average features over the past
three days, the model was able to capture short-term
trends. This approach involved the data being shifted
to exclude the current day's information.
4 EXPERIMENTS AND RESULTS
4.1 Experimental Setup
In this study, XGBoost, a machine learning technique,
was selected to construct a model that predicts the
“recommendation score” as the target variable.
XGBoost, based on the gradient boosting framework,
is known for its effectiveness in regression problems.
To maximize the model's performance,
hyperparameter tuning was conducted.
Additionally, the following evaluation metrics
were employed to assess the model's predictive
performance:
RMSE (Root Mean Squared Error): Represents the
square root of the average squared differences
between predicted and actual values, evaluating the
magnitude of prediction errors.
MAE (Mean Absolute Error): Represents the average
of the absolute differences between predicted and
actual values, assessing the average size of errors.
R² Score: Also known as the coefficient of
determination, it indicates how well the model
explains the variability of the actual data. A score
closer to 1 signifies higher explanatory power.
MAPE (Mean Absolute Percentage Error):
Represents the average percentage of prediction
errors, providing a relative measure of prediction
accuracy.
Median AE (Median Absolute Error): Represents the
median of the absolute differences between predicted
and actual values, serving as an error metric less
susceptible to outliers.
These metrics were selected to evaluate the
discrepancies between predicted and actual values
from multiple perspectives.
4.2 Experimental Procedure
To verify the effectiveness of the proposed method,
experiments followed the procedures outlined below.
First, based on the data preprocessing steps,
Fish Catch Prediction by Combining Fishing, Weather and Tidal Data
1111
fishing catch data, tidal data, and weather data were
loaded and merged to create an integrated dataframe.
Specifically, after handling missing values and
excluding unnecessary data from each dataset, the
data were merged based on the date to construct a
consistent integrated dataset.
Next, the data were divided into training and
testing sets based on the time series. Specifically, the
last 180 days were designated as the test set, while the
preceding data constituted the training set. This
splitting method replicates the actual operational
environment in which the model predicts future data.
Subsequently, feature engineering was performed.
Lag features and moving average features were
generated to enable the model to learn the influence of
past data on current predictions. Specifically, lag
features based on the past one to seven days were
added, and moving average features over the past three
days were calculated. Additionally, categorical data
were transformed into dummy variables to incorporate
them into the model as numerical data. Furthermore,
all numerical features were standardized to reduce the
impact of differing feature scales.
For model training and hyperparameter tuning,
XGBoost was employed. During this process, cross-
validation suitable for time series data was conducted
to evaluate the model's generalization performance.
Finally, the predictive performance of the
optimized model was evaluated on the test data based
on the evaluation metrics. Specifically, RMSE, MAE,
R² Score, MAPE, and Median AE were calculated to
provide a comprehensive evaluation of the model's
prediction accuracy and error distribution.
4.3 Comparative Experiments
In addition to training and predicting models for each
fish species, a baseline model was implemented to
predict the “recommendation score” without
considering fish species. A model was trained using
the integrated dataframe to predict the
“recommendation score” without considering fish
species. This baseline model did not involve training
separate models for each species.
Furthermore, this baseline model did not utilize lag
features or moving average features. This comparative
experiment assessed the impact of training separate
models for each fish species and the application of
feature engineering on prediction accuracy.
4.4 Experimental Results
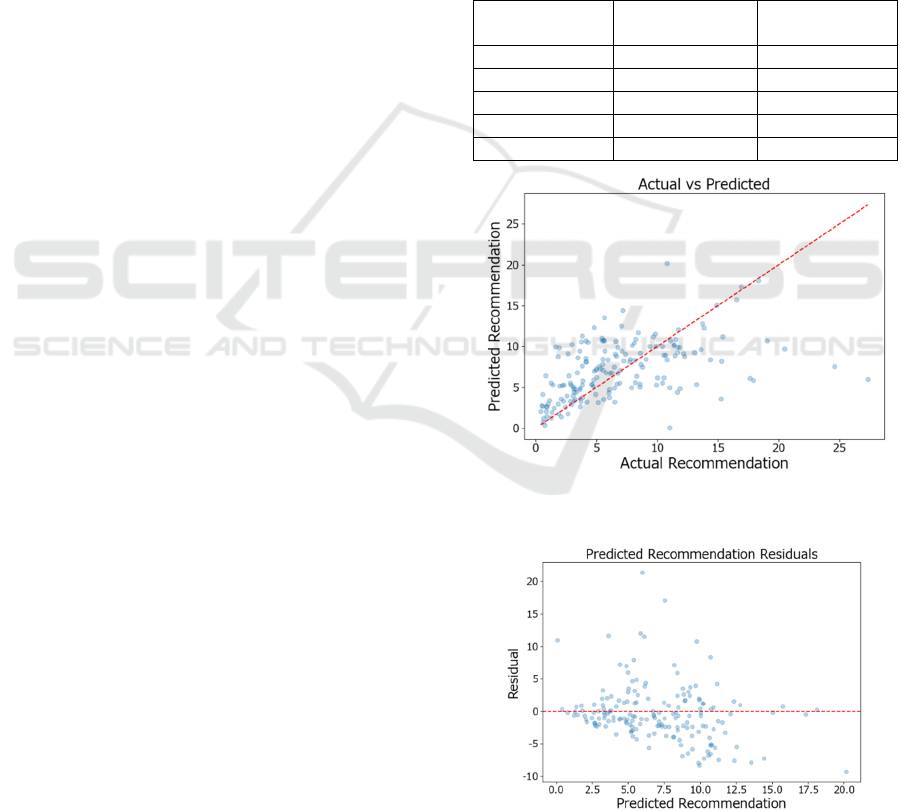
Table 1 presents the performance evaluation results
of the fishing catch prediction models developed in
this study. The table summarizes the outcomes of
each evaluation metric on the test data. Based on
these results, the prediction accuracy and the
distribution of errors were assessed.
Figure 1 illustrates the correlation between the
actual and predicted values, confirming that the
model adequately captures the overall trend.
Furthermore, Figure 2 indicates that the residuals
are smaller than those of the baseline model.
Lastly, Figure 3 shows that the model captures
temporal fluctuations, aligning well with the actual
fishing catch patterns.
Table 1: Comparison of Performance Metrics between
Proposed Method and Base Model.
Proposed
method
Base model
RMSE 4.36 5.47
MAE 3.02 4.16
R² Score 0.20 -0.27
MAPE 74.6% 133.0%
Median AE 2.04 3.33
Figure 1: Actual vs Predicted Scatter Plot(Proposed
method).
Figure 2: Residuals of Predicted Recommendations
(Proposed method).
ICAART 2025 - 17th International Conference on Agents and Artificial Intelligence
1112
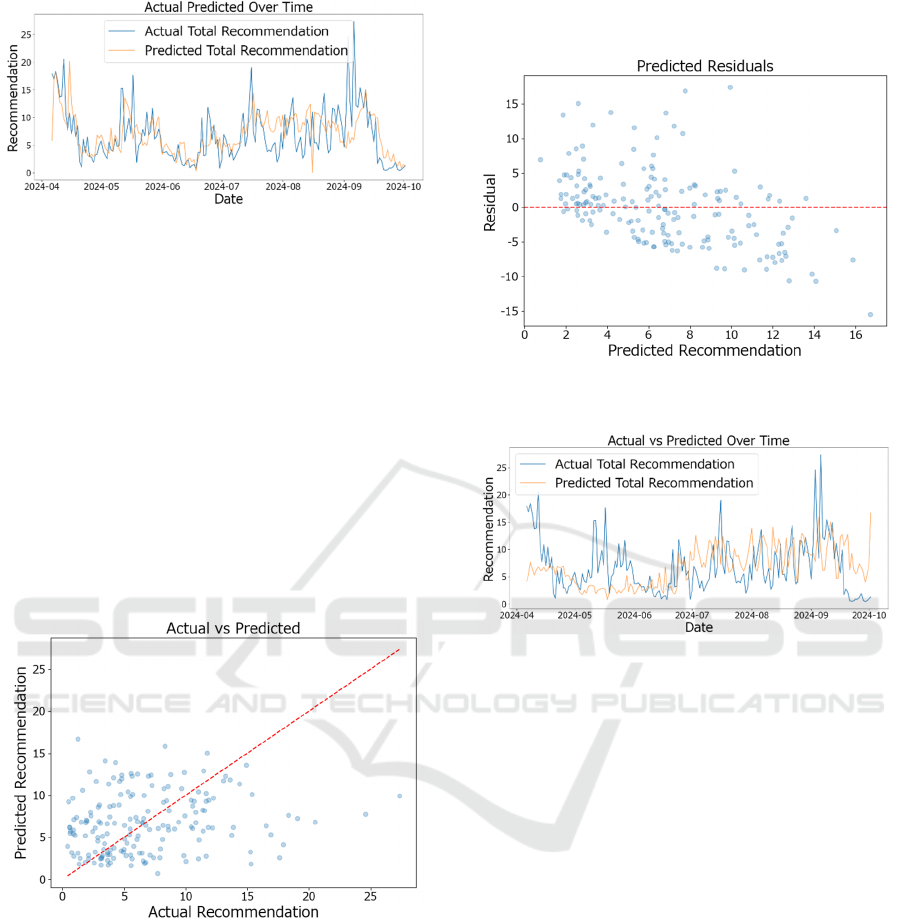
Figure 3: Actual vs Predicted Over Time: (Proposed
method).
4.5 Comparative Evaluation with
Baseline Model
From the results of this experiment, it was confirmed
that the proposed method performs better than the
baseline model. Specifically, Figure 4 shows that the
predictions of the baseline model are concentrated
below 10, and many data points deviate from the
diagonal line. In Figure 5, the residual plot of the
baseline model reveals high positive residuals. Figure
6 indicates that the baseline model fails to adequately
capture actual fluctuations. These results demonstrate
that the proposed method exhibits higher prediction
accuracy compared to the baseline model.
Figure 4: Actual vs Predicted Scatter Plot(Base model).
4.6 Comparative Experiments and
Comprehensive Evaluation
The proposed method demonstrated higher
performance compared to the baseline model. This is
attributed to the baseline model not utilizing lag
features and moving average features, resulting in an
inability to capture the temporal dependencies and
short-term trends inherent in the time-series data.
Consequently, prediction accuracy decreased, and
errors increased. These experimental results indicate
that training separate models for each fish species and
incorporating feature engineering enhances prediction
accuracy.
Figure 5: Residuals of Predicted Recommendations (Base
model).
Figure 6: Actual vs Predicted Over Time (Base model).
5 DISCUSSION
In this study, the proposed method was implemented
by training models for each fish species and
performing feature engineering. The "number of
catches per person per day" was defined as the
"recommendation score," and the model's predictive
performance was evaluated. The experimental results
demonstrated that the proposed method achieved
improved prediction accuracy compared to the
baseline model. Specifically, the proposed method
yielded an RMSE of 4.36, MAE of 3.02, R² score of
0.20, MAPE of 74.6%, and Median AE of 2.04. In
contrast, the baseline model exhibited an RMSE of
5.47, MAE of 4.16, R² score of -0.27, MAPE of
133.0%, and Median AE of 3.33 on the test data.
These results indicate that the proposed method has
higher predictive performance than the baseline model.
5.1 Improvement in Prediction
Accuracy
The proposed method produced more accurate results
Fish Catch Prediction by Combining Fishing, Weather and Tidal Data
1113

than the baseline model. This improvement is
attributed to the individual training and prediction for
each fish species, which enabled the detailed capture
of unique fishing patterns and environmental factors
specific to each species. Additionally, by utilizing lag
features and moving average features, the model was
able to learn the influence of recent catch numbers
and weather conditions on current catches. Lag
features, incorporating data from the past one to seven
days, captured the temporal dependencies in the time-
series data, reflecting temporal variations and trends
in the model. Furthermore, moving average features,
calculated based on data from the past three days,
reduced noise and allowed the model to learn more
stable trends. The incorporation of these features
allowed the model to more accurately capture the
impact of recent fish and weather trends on catches,
thereby improving prediction accuracy.
5.2 Future Challenges
The enhanced predictive performance of the proposed
method is likely due to the fish species-specific model
training and feature engineering. However, this study
has several limitations.
Firstly, the R² score of 0.20 in the proposed
method is relatively low, which may be due to the
insufficient identification of factors that cause
significant fluctuations in catches. The data include
days with unusually high catches, and the model's
predictive accuracy on these days is reduced. In other
words, the proposed model may lack a
comprehensive understanding or representation of the
factors that lead to substantial variations in catches.
To accurately predict such extreme fluctuations in
catches, further feature addition and model
refinement are necessary.
6 CONCLUSION
This study developed and evaluated a fishing catch
prediction model that employs species-specific model
training and feature engineering to predict days with
a higher probability of successful catches for
beginners. Specifically, fishing catch data, weather
data, and tidal data were integrated, and XGBoost
was utilized to define and predict the "number of
catches per person per day" as the "recommendation
score." Additionally, lag features and moving average
features were introduced to capture the temporal
dependencies and short-term trends inherent in time-
series data.
The results demonstrated that the proposed
method outperformed the baseline model. In
particular, the incorporation of lag features and
moving average features allowed the model to learn
the influence of recent catch numbers and weather
condition trends on fishing success, thereby
enhancing prediction accuracy. However, a limitation
of the proposed method is the low R² score, which
indicates that the model was unable to sufficiently
identify and account for factors causing significant
fluctuations in catches. Consequently, additional
feature incorporation and more advanced model
development are necessary to accurately predict
extreme variations in fishing outcomes.
Future research will address these challenges by
incorporating additional features and improving the
model architecture to develop a more accurate fishing
catch prediction model.
ACKNOWLEDGEMENTS
This work was supported by JSPS KAKENHI Grant
Numbers JP22K12157, JP23K28377, JP24H00714.
We acknowledge the assistance for the ChatGPT
(GPT-4o and 4o mini) was used for proofreading,
which was further reviewed and revised by the
authors.
REFERENCES
Yokohama Fishing Piers Official Website. Retrieved from
https://honmoku.yokohama-fishingpiers.jp/
Japan Meteorological Agency. Weather Data Download
Page. Retrieved from https://www.data.jma.go.jp/
risk/obsdl/index.php
Japan Meteorological Agency. Tide Tables (Estimated Tide
Levels). Retrieved from https://www.data.jma.go.jp/
kaiyou/db/tide/suisan/suisan.php
Chen, T., & Guestrin, C. (2016). XGBoost: A scalable tree
boosting system. In Proceedings of the 22nd ACM
SIGKDD International Conference on Knowledge
Discovery and Data Mining (KDD '16) (pp. 785-794).
ACM.
He, H., & Garcia, E. A. (2009). Learning from imbalanced
data. IEEE Transactions on Knowledge and Data
Engineering, 21(9), 1263-1284.
Hashimoto, I. (2022). Fishing catch prediction using
random forest with fishing information sites. KGPS
Review, (29), 109-118.
Zhang, Y. (2023). A study on deep learning for catch
forecast of salmon (Doctoral dissertation). Division of
Information and Electronic Engineering, Muroran
Institute of Technology, Muroran, Japan.
ICAART 2025 - 17th International Conference on Agents and Artificial Intelligence
1114

Raman, R. K., & Das, B. K. (2019). Forecasting shrimp and
fish catch in Chilika Lake over time series analysis. In
IntechOpen. https://doi.org/10.5772/intechopen.85458
Yadav, V. K., Jahageerdar, S., & Adinarayana, J. (2019). A
comparison of different fuzzy inference systems for
prediction of catch per unit effort (CPUE) of fish.
Indian Journal of Geo-Marine Sciences, 48(1), 60–69.
Bergstra, J., Bardenet, R., Bengio, Y., & Kégl, B. (2011).
Algorithms for hyper-parameter optimization. In
Advances in Neural Information Processing Systems 24
(NIPS 2011).
Arlot, S., & Celisse, A. (2010). A survey of cross-validation
procedures for model selection. Statistics Surveys, 4,
40-79.
Ebrahimi, S. H., Ossewaarde, M., & Need, A. (2021). Smart
fishery: A systematic review and research agenda for
sustainable fisheries in the age of AI. Sustainability,
13(11), 6037.
Gladju, J., Kamalam, B. S., & Kanagaraj, A. (2022).
Applications of data mining and machine learning
framework in aquaculture and fisheries: A review.
Fisheries Research: Smart Agricultural Technology, 2,
December.
de la Bourdonnaye, F., & Daniel, F. (2021). Evaluating
categorical encoding methods on a real credit card fraud
detection database. Artificial Intelligence Department
of Lusis, Paris, France.
Hamzaoui, M., Aoueileyine, M. O.-E., Romdhani, L., &
Bouallegue, R. (2023). Optimizing XGBoost
performance for fish weight prediction through
parameter pre-selection. Fishes, 8(10), 505.
Okamura, H., Morita, S., & Kuroda, H. (2024). Forecasting
fish recruitment using machine learning methods: A
case study of arabesque greenling. Fisheries Research,
278, 107096.
Galparsoro, I., Pouso, S., García-Barón, I., Mugerza, E.,
Mateo, M., Paradinas, I., Louzao, M., Borja, Á.,
Mandiola, G., & Murillas, A. (2024). Predicting
important fishing grounds for the small-scale fishery,
based on Automatic Identification System records,
catches, and environmental data. ICES Journal of
Marine Science, 81(3), 453–469.
Fish Catch Prediction by Combining Fishing, Weather and Tidal Data
1115
