
Automating Compression Ultrasonography of Human Thigh Tissue and
Vessels via Strain Estimation
Rytis Jurkonis
1 a
, Rimvydas Eitminavi
ˇ
cius
1 b
, Vaidotas Marozas
1 c
and Andrius Sakalauskas
2 d
1
Biomedical Engineering Institute, Kaunas University of Technology, K. Bar
ˇ
sausko 59, Kaunas, Lithuania
2
TELEMED, Ultrasound Medical Systems, Savanoriu 178A, Vilnius, Lithuania
Keywords:
Deep Vein Thrombosis, Compression Quantification, Operator Free, Tissue Displacement.
Abstract:
Despite the progress made in ultrasonic imaging, the current examination of vein structures by compression
is highly operator-dependent and is a time-consuming clinical routine. Current guidelines for the manage-
ment of deep vein thrombosis recommend compression ultrasonography follow-up for patients at risk of life-
threatening complications (pulmonary embolism, heart attack, or stroke). New methods are needed to allow
operator-free monitoring of vein structure at the point of care. This article presents the results of integrated
imaging with a tissue compression actuator and automated control of tissue deformation through strain es-
timation. The data for feedback control of the actuator is calculated from raw ultrasound radio-frequency
backscattered signals. The region-averaged strain curve (strain versus time) obtained during the tissue com-
pression cycle serves as input for the actuator. The mounting on the human thigh is made from rigid, pre-
shaped shells, which are adjusted to the circumference of the thigh with straps. The actuator facilitates a
novel, on-body-mounted, automated, operator-free examination of the human femoral vein.
1 INTRODUCTION
Compression ultrasonography is a method for vein
structure analysis, including testing of suspected deep
vein thrombosis (DVT). DVT is the formation of a
blood clot within the deep veins that blocks blood
flow. In 50% of people with DVT, the clot even-
tually breaks off and travels to the central circu-
lation, causing life-threatening complications (pul-
monary embolism, heart attack, or stroke). Early di-
agnosis of DVT is crucial, and despite the progress
made in ultrasonic imaging, the current examination
of vein structures by compression is highly operator-
dependent and a time-consuming clinical routine.
In reviewing the history of venous ultrasound,
Cronan et al. (Cronan, 2003) mention that an arti-
cle by Talbot et al. (Talbot et al., 1982) highlights a
significant breakthrough in venous clot detection that
occurred in 1982. Talbot noted that there were easily
recognizable differences between patent normal veins
and those containing clots. Using a combination of
a
https://orcid.org/0000-0002-9481-1773
b
https://orcid.org/0009-0009-4682-8878
c
https://orcid.org/0000-0002-6879-5845
d
https://orcid.org/0000-0002-3978-7301
B-mode real-time imaging and pulsed Doppler imag-
ing, the author indicated that (1) flows in a normal
vein varied with respiration; (2) a Valsalva maneuver
augmented the size of a normal vein; (3) light pres-
sure exerted on a normal vein caused it to collapse;
and (4) Doppler signals were found in a patent vein.
Obstructed veins tend to be larger. Often, it contained
a speckled mass within it, and the diameter did not
change with respiration, a Valsalva maneuver, or light
pressure exerted on the overlying skin. The next par-
ticular paper (Raghavendra et al., 1986) proposed a
method called compression ultrasonography. Surpris-
ingly, quantitative characterization of compression or
criteria was described only in recent articles and only
in cases of residual vein thrombosis. With sonogra-
phy, vein diameters were evaluated during compres-
sion, and residual vein thrombosis (RVT) was defined
as the persistence of thrombotic material resulting in
a diameter of 4 mm or more (Prandoni et al., 2002).
Criteria were defined as ultrasound incompressibil-
ity of at least 4 mm in the common femoral and/or
popliteal vein after 3 months of RVT. This RVT cri-
terion was shown to be reproducible in other institu-
tions (Tan et al., 2012; Palareti et al., 2014; Liu et al.,
2023).
Jurkonis, R., Eitminavi
ˇ
cius, R., Marozas, V. and Sakalauskas, A.
Automating Compression Ultrasonography of Human Thigh Tissue and Vessels via Strain Estimation.
DOI: 10.5220/0013264300003911
Paper published under CC license (CC BY-NC-ND 4.0)
In Proceedings of the 18th International Joint Conference on Biomedical Engineering Systems and Technologies (BIOSTEC 2025) - Volume 1, pages 239-245
ISBN: 978-989-758-731-3; ISSN: 2184-4305
Proceedings Copyright © 2025 by SCITEPRESS – Science and Technology Publications, Lda.
239
To the best of the author’s knowledge, no more
quantitative criteria about the limits of compression
are published. Therefore, there is a need for new ob-
jective criteria, especially from sonography images.
The study explores the feasibility of automated com-
pression ultrasonography of thigh tissues by propos-
ing a hardware actuator and compression control solu-
tion. Results of the investigation (intra- and intersub-
ject variability) by using the prototype are disclosed.
2 MATERIAL AND METHODS
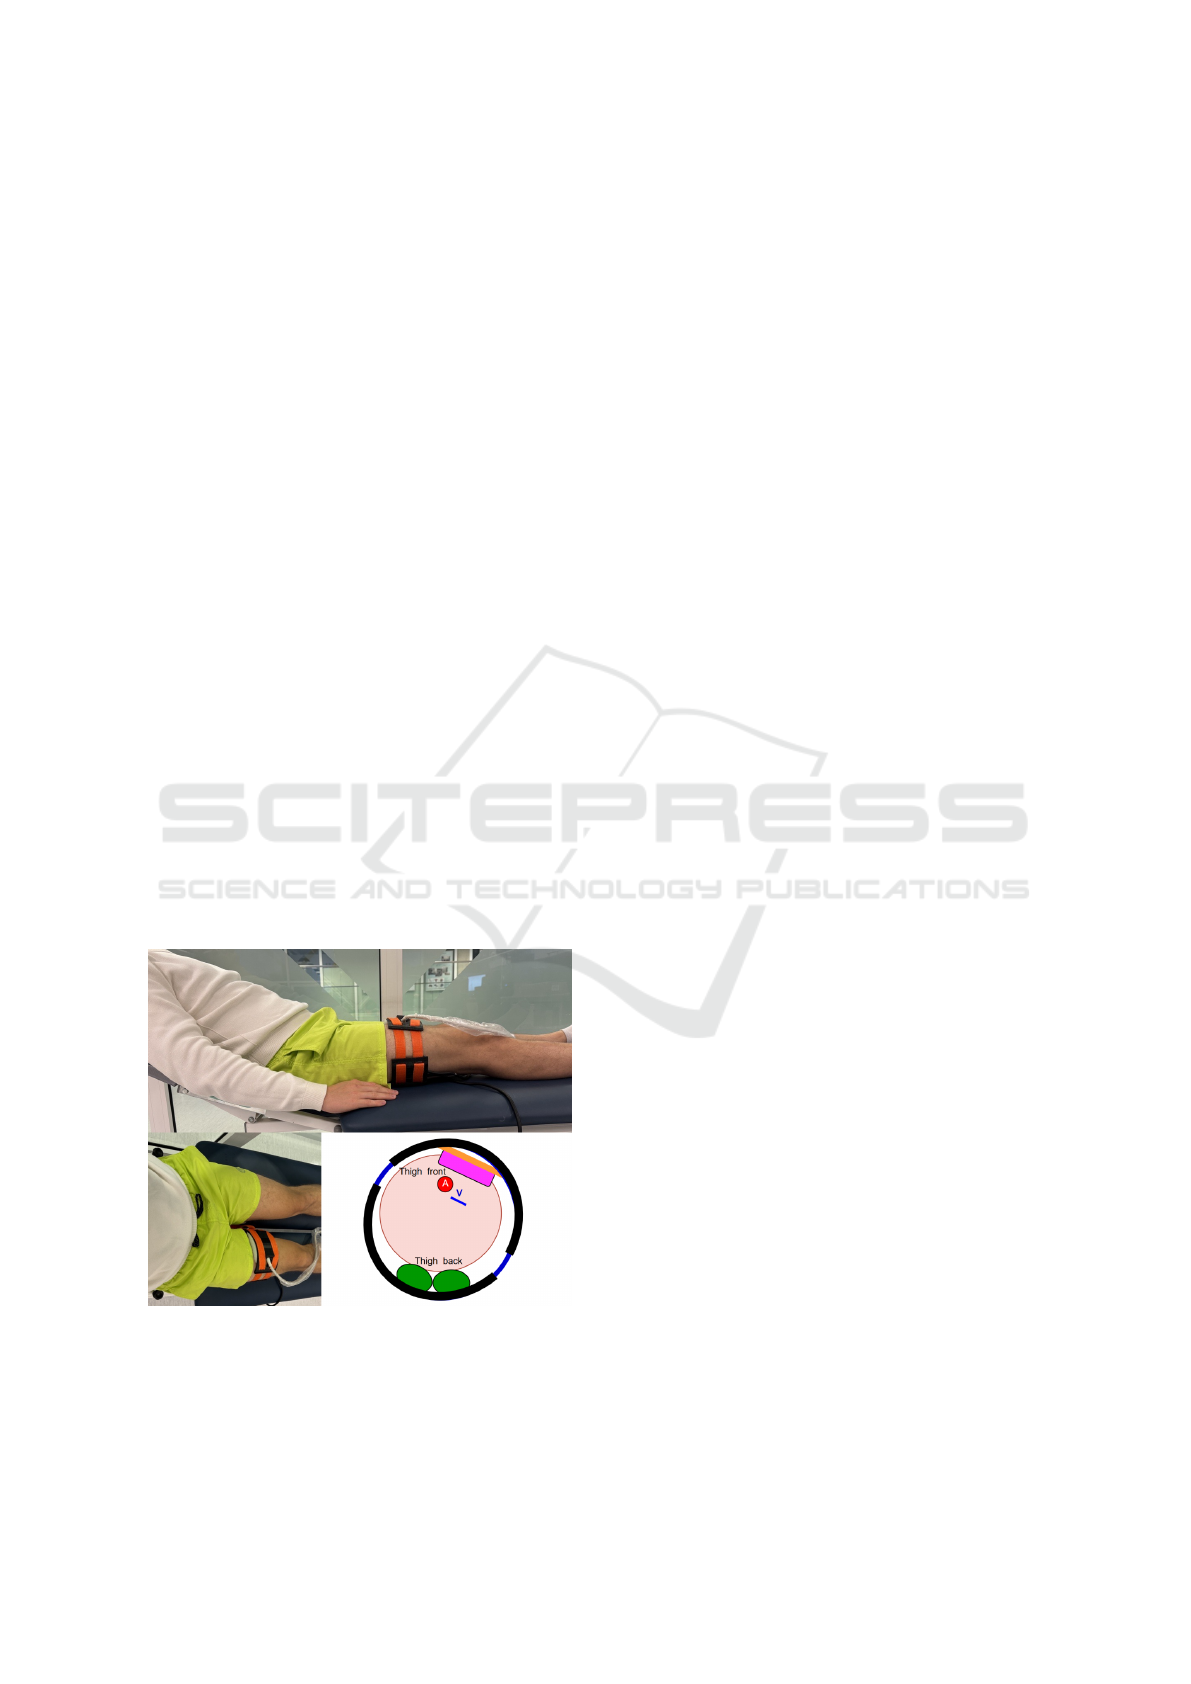
2.1 Thigh Mount Supports
The prototype of the thigh mount was made from two
rigid C-shaped frames (Fig. 1). When designing these
C-shaped frames the anthropometric data (Heitmann
and Frederiksen, 2009) of human thigh size (median
circumference 56 cm) was considered. In one frame
the locking slot for fixing the imaging transducer was
formed according to the transducer enclosing dimen-
sions. The first frame to the second was fixed with two
nonelastic straps that were adjusted to the individual
circumference of the thigh of the subject. After fixa-
tion, the length of the straps was stable during the time
required for the whole session of data recording. The
second C-shaped frame has two fixed bladders (Fig. 1
(b)). The fixation was made with woven fabric, for
prototyping, while future support designs (including
the choice of fabric materials) will be improved for
better comfort of the user.
a)
b)
Figure 1: The tested design for mounting of compression
actuator and imaging transducer on human thigh: a) mount-
ing on the thigh; b) rigid frames with a mounted actuator
pressing tissues against the imaging transducer. The ap-
proximate location of the femoral artery and the compressed
femoral vein is indicated by “A” and “V”, respectively.
2.2 Pneumatic Actuator
Actuation on tissues was performed using bladders
that were in contact with the skin on the thigh. The air
bladders were rectangular with a size of 60 x 100 mm.
The required air volume to pressurize the bladders
to 100 mmHg was 200 mL (per bladder). Bladders
were pressurized by a silent piezoelectric air pump,
model UXPB5400000A (Lee Company, Westbrook,
CT, USA). This pump in combination with a smart
pump module is capable of producing pressures of up
to 190 mmHg, and a free flow output of 1.35 L/min.
The pump and electronics were powered by a Li-Ion
battery.
2.3 Ultrasonic Imaging
Thigh tissue imaging was performed using the ArtUs-
1H beamformer (Telemed, Lithuania) that has raw
beamformed radio frequency (RF) data output. The
beamformer was equipped with a low-profile linear
array (LF11-5H60-A3). The beamformer was inter-
faced to the computer via USB 3.0 and had syn-
chronization output connectors installed. Sync pulses
from the beamformer served as the activation signal
for the pneumatic actuator. The main parameters of
ultrasonic scanning were as follows: scanning depth
of 5 cm, ultrasound wave frequency in the range of 5
- 11 MHz, and transmission of a single focal depth of
5 cm. B-mode images (512 x 512) were acquired in
real-time into the host computer. The RF signal was
digitized with a 40 MHz sampling frequency and the
analog-to-digital converter resolution of 16 bits was
analyzed in real-time as described in the 2.3.2 section.
2.3.1 Software
Two real-time streams—B-mode ultrasound images
(for navigation) and RF data (for strain assess-
ment)—were transmitted to the MATLAB environ-
ment and MATLAB GUI application using a software
development kit (SDK) developed by TELEMED.
The functionality of the MATLAB GUI application
was sufficient for research purposes and had an op-
tion to: adjust imaging depth, choose the frequency
of waves, adjust emission power and receiving gain,
preset the threshold of strain, and initiate the imag-
ing session. The DLL can be used to link C++
TELEMED SDK to any programming platform.
2.3.2 Estimation of Real-Time Tissue Axial
Displacements and Strain
Tissue displacements and strain parameters (calcu-
lated from RF data) are well-known in the commu-
BIOIMAGING 2025 - 12th International Conference on Bioimaging
240
nity of ultrasound elastography (Garra, 2015). Typ-
ically, these parameters serve for the assessment of
tissue hardening, because the parameters are highly
correlated with the stiffness of tissue. In this study,
tissue strain parameter was employed for the quantita-
tive assessment of compression ultrasonography with
implications to be used in the diagnosis of throm-
botic veins. Axial displacements were estimated by
using a window-based correlation technique proposed
by Zahiri and Salcudean (Zahiri Azar and Salcudean,
2006). The algorithm is one of the fastest proposed
up to date because it uses displacement value esti-
mated in previous, neighboring, correlation window
as a prior, to reduce the search for the next one to a
very small area of 3 samples (-1, 0, +1). Displace-
ment estimates are refined by using parabolic interpo-
lation which is again very fast and efficient. The time
delay was calculated by using the following parabolic
interpolation formula:
∆ = T
s
y
0
− y
2
2(y
0
− 2y
1
+ y
2
)
(1)
where T
s
– ultrasound RF data sampling period,
y
1
– the argument for maximal correlation (time delay
for the correlation peak), and y
0
, y
2
– nearest neigh-
bors of the peak.
Strain estimates were obtained from displace-
ments using a gradient operator combined with a
smoothing filter. The size of the kernel for axial dis-
placement evaluation was 107 (samples) × 7 (scan
lines). The median value of the strain matrix is cal-
culated from every frame of the RF data. Then the
strain curve is formed from the calculated median val-
ues. Real-time strain assessment served in a feedback
loop with a tissue compression actuator. The pneu-
matic actuator continuously applied the pressure onto
the thigh gradually closing the vein under investiga-
tion at the same time strain was estimated for each
received data frame of backscattered signals. The
operator sets the strain threshold value in the MAT-
LAB GUI application, which defines the end of the
ultrasonic imaging session. At the instance when the
imaging is stopped the beamformer provides a syn-
chronization pulse to the actuator to halt the pump and
initiate the release of the applied pressure.
2.4 Data Collection and Analysis
The subjects were instructed to relax their body mus-
cles, similar to the procedure during blood pressure
measurement with a brachial cuff. In addition, the
positioning of the body and the leg was standardized:
the subjects were placed on the testbed (Matsubara
et al., 2022) with their back elevated at a 30-degree
angle and the leg freely extended. Thigh tissue com-
pressions were performed in two different variants:
1) manually, by maneuvering the imaging transducer,
and 2) by using an automated tissue compression ac-
tuator. The automated compression was conducted
with a thigh-mounted imaging transducer and pres-
surized bladders, as depicted in Figure 1. Manual
compression was applied from the front side of the
thigh, in the same way as in routine clinical practice.
The dosing of compressions in both manual and auto-
mated variants was quantified using the preset strain
thresholds in MATLAB GUI. Manual compression
was stopped at 2, 5, 8, and 11% strain thresholds,
while the automated compression was halted at 1.5,
2.5, 3.5, 4.5, and 5.5%. For each threshold, three
compressions were recorded. These levels were cho-
sen empirically based on a current design. Image
sequences of tissue reactions were saved for off-line
analysis, which is described in the following section.
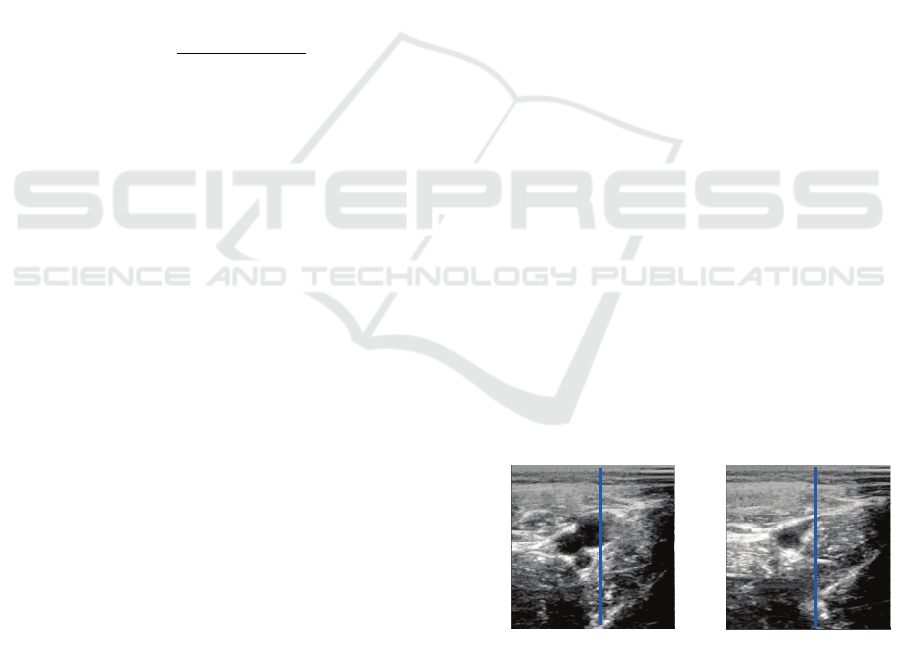
The initial and final B-mode images from the sin-
gle subject thigh compression session are provided in
Fig. 2. In the initial image, the largest ellipse-shape
darker pattern represents the femoral vein in cross-
section. This pattern decreases in size as the thigh
tissues are compressed, either manually or by the acti-
vated actuator. The artery lumen appears as a smaller,
more circular pattern. The artery lumen begins to de-
form under a stronger compression, once the lumen of
the healthy vein is fully closed. The depicted B-mode
images are primarily used to initiate offline analy-
sis (intermediate images are provided in the appendix
Figure 9). M-mode imaging facilitated the analysis of
deformation over time. To generate the M-mode im-
age, the intensity of the B-mode image was extracted
along the blue line, which is centered on the main vein
width in the initial image (left panel in Fig. 2). The
same line location is indicated on the B-mode image
after maximal compression.
Figure 2: Cross-section B-mode images of femoral vessels
before compression (left) and at full lumen closure of the
veins (right).
The overview of tissue compression progress in
a sequence of B-mode images can be enhanced by
preparing M-mode images with a time dimension
Automating Compression Ultrasonography of Human Thigh Tissue and Vessels via Strain Estimation
241
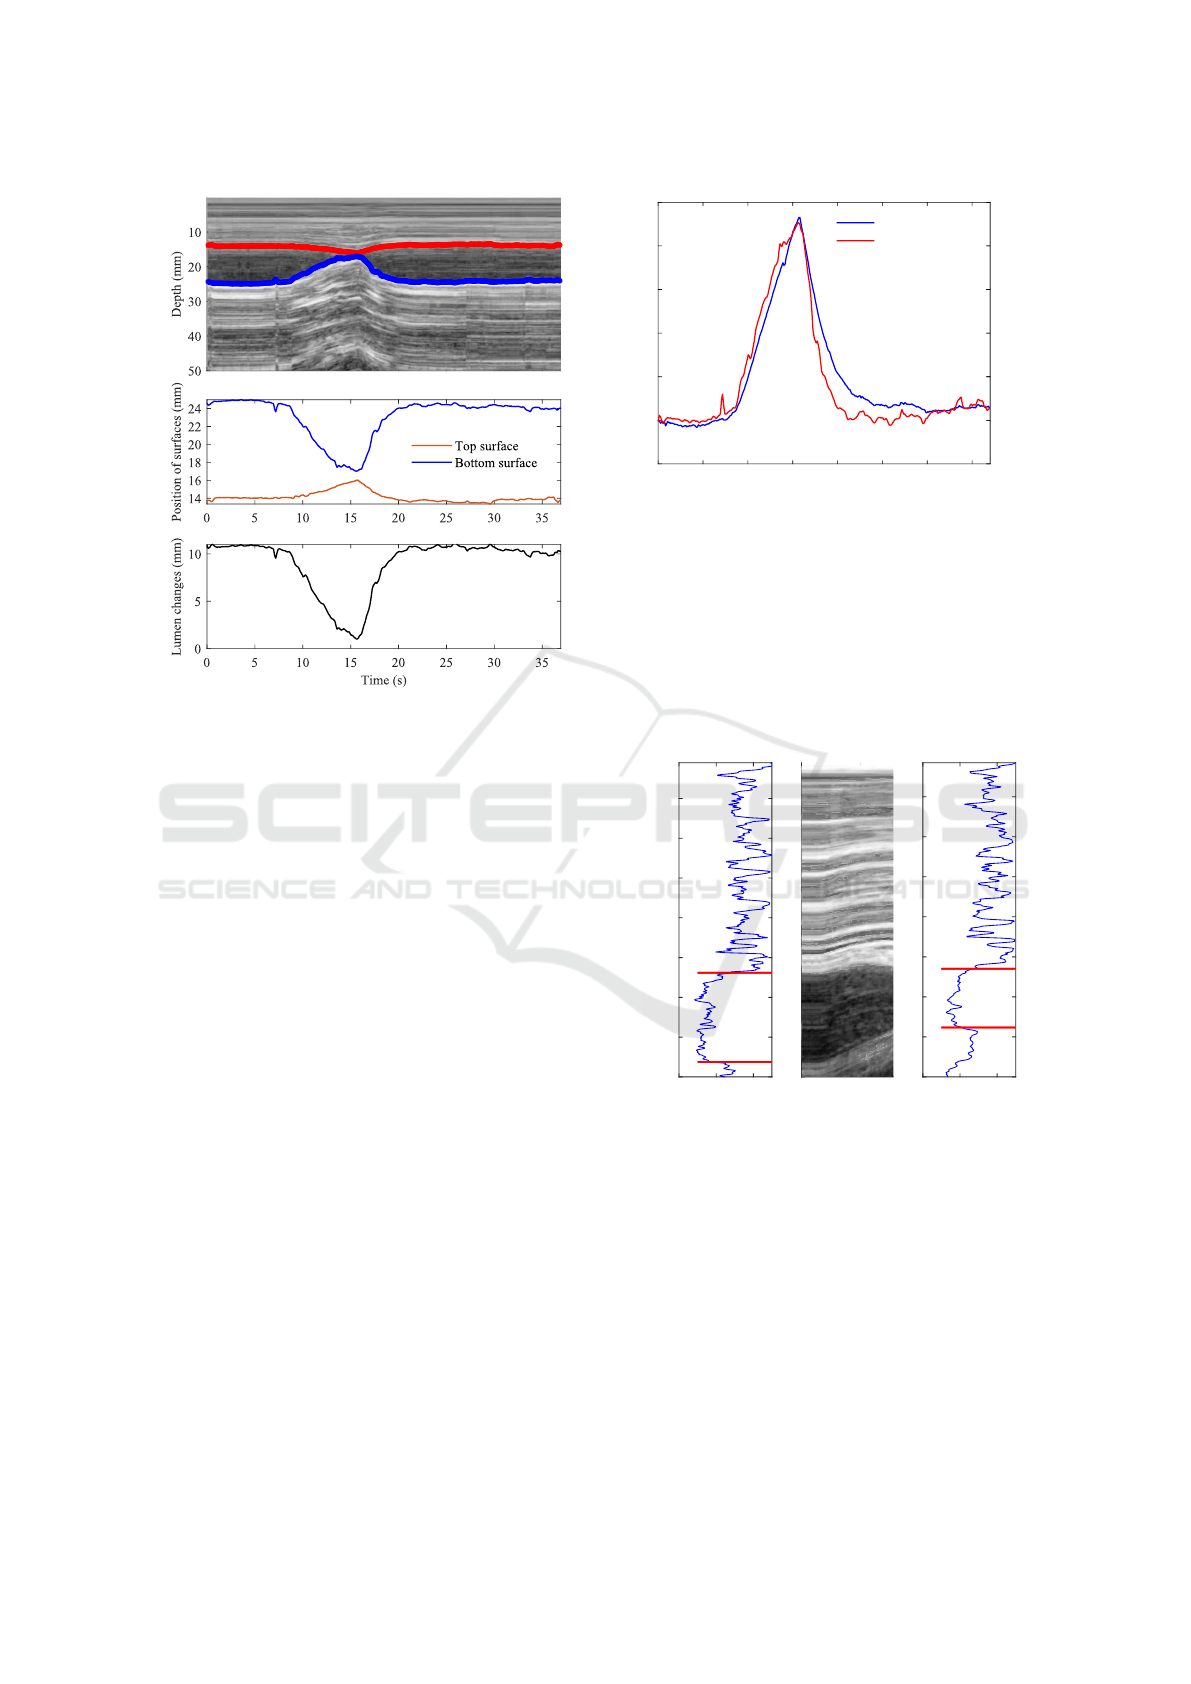
a)
b)
c)
Figure 3: Human thigh imaging data: a) representation of
vein lumen deforming in M-mode time diagram as prepared
from image intensity profiles indicated on B-mode images;
b) extracted position changes of vein walls (surfaces), and
c) calculated vein lumen changes during compression and
release of thigh tissues.
(Fig. 3 (a)). The transitions of tissue structures’ po-
sitions appear more continuous and smooth, making
tracking easier. Displacements of the upper and lower
walls of the vein are extracted from the M-mode im-
age, as exemplified by the lines on the grayscale im-
age. These traces (Fig. 3 (b)) assist in calculating the
absolute size of the vein lumen. Figure 3 (c) shows the
initial size of the vein lumen, approximately 11 mm,
which was compressed to around 1 mm, resulting in
a relative decrease of the vein lumen by about 90%.
This is an example of the resulting reaction of tissues
and the femoral vein after manual compression on the
thigh. The subjective quantification of the degree of
compression could be enriched with strain parameter.
The lumen decrease trace is exemplified together in
strain–time dependency (Fig. 4).
The corresponding strain, as the quantity of the
whole image, averaged degree of deformation, in-
creases to more than 9% in the final stage of the com-
pression. The strain increases while the lumen de-
creases, both peaking around 15 seconds in this exam-
ple. The strain appears more smooth during compres-
sion and the release of the thigh. Strain value mon-
itoring was done in real-time with ultrasonic imag-
ing, allowing the degree of deformation to be dosed
by the set threshold of strain. Real-time thresholding
0 5 10 15 20 25 30 35
Time (s)
-2
0
2
4
6
8
10
Strain in tissue (%)
-20
0
20
40
60
80
100
Lumen decrease (%)
Strain
Lumen decrease
Figure 4: Comparison of lumen relative decrease with strain
calculated from ultrasonic imaging RF data.
in strain trace was verified with vein lumen decrease
obtained from the M-mode image. An example of the
compression dosed according to the strain threshold
is provided in Figure 5. In this example, the preset
threshold for tissue strain was 8% which resulted in a
vein lumen change from the initial size of 11.2 mm to
7.3 mm (relative decrease of 35%).
0 100 200
B-scan intensity
5
10
15
20
25
30
35
40
Depth (mm)
11.2 mm
0 100 200
B-scan intensity
5
10
15
20
25
30
35
40
7.3 mm
5
10
15
20
25
30
35
40
0 5
Time (s)
M-scan
Figure 5: Analysis of the tissue compression image se-
quence: M-mode diagram is prepared for overview for over-
all progress; the B-mode image intensities profile exempli-
fies initial (left panel) and final (right panel) dimensions of
vein lumen size.
This approach of estimation of only initial and fi-
nal (strain threshold triggered) vein lumen sizes was
applied in the analysis of data from a group of healthy
subjects. In total three cases of thigh tissue reac-
tions to compression were recorded and analyzed to
estimate inter-subject variability. The possibilities of
monitoring tissue reactions in single subjects, or intra-
subject variability, were also evaluated.
BIOIMAGING 2025 - 12th International Conference on Bioimaging
242
3 RESULTS
In total 9 healthy volunteers were included in this
study, all participating in the intersubject investiga-
tion and one of them in the long-term (2.5 hours)
intrasubject investigation. Vein lumen responses to
manual and automated compressions were analyzed
offline in M-mode diagrams. Both inter-subject and
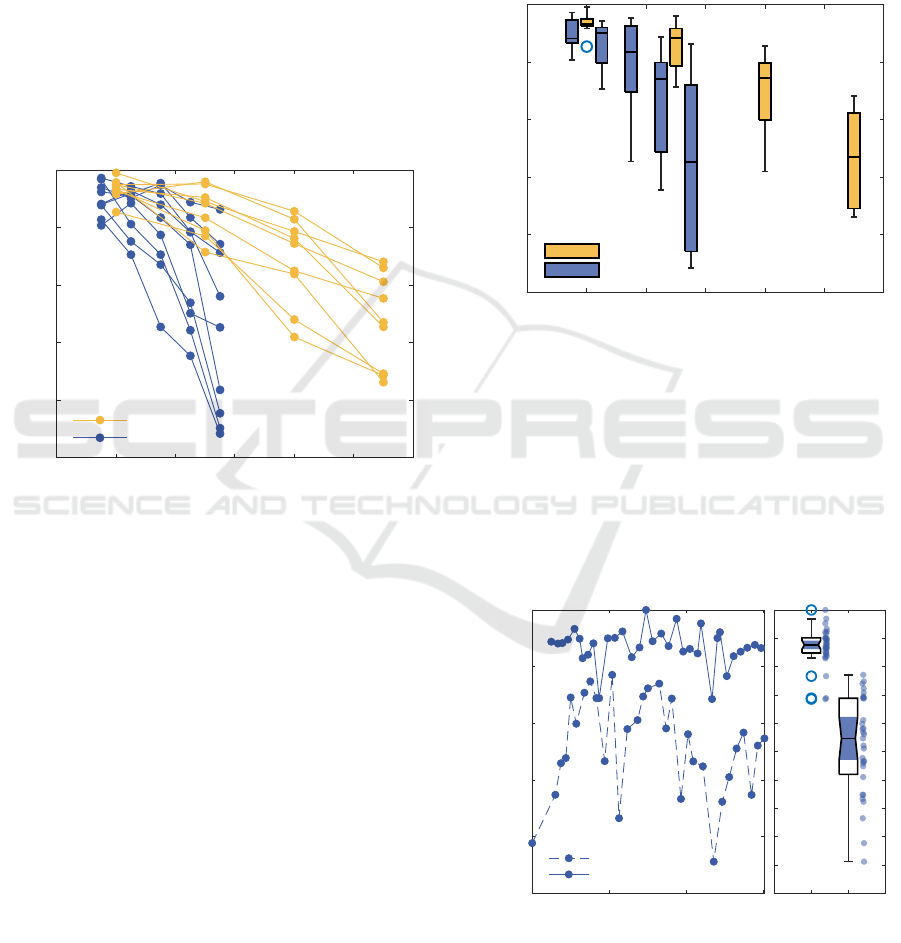
intra-subject variabilities were examined. Figure 6
illustrates inter-subject variability in vein lumen re-
actions to manual and automated thigh compressions
(intermediate images are provided in the appendix
Figure 10 and Figure 11). Each point represents the
mean result of three compression sessions, with lines
connecting points to show trends for each subject.
0 2 4 6 8 10 12
Strain threshold (%)
-100
-80
-60
-40
-20
0
Lumen decrease (%)
Manual
Automatic
Figure 6: Reactions of vein lumen in healthy subjects with
dosing the compression amount according to strain thresh-
old: manual (by-hand) maneuvering and automatic com-
pression.
Observed vein lumen reactions differ significantly.
With the preset value of threshold of 11% for strain,
vein lumen reduction can range from 30% to 70%.
Meaning, that the same values of threshold can not be
applied to a whole group. In the manual variant, the
imaging transducer applies compression, while in the
automatic variant, tissues are pushed toward it, caus-
ing the differences.
Figure 7 compares the results using boxplots for
different strain thresholds in manual and automated
compression ultrasonography procedures. A strong
relationship between strain threshold and percentage
of lumen decrease can be observed. However, the in-
terquartile range of lumen decrease increases signifi-
cantly at higher strain thresholds.
An automatic tissue compression actuator will be
used for prolonged intermittent monitoring of venous
conditions. Therefore, evaluating intra-subject vari-
ability in measurements is important. Figure 8 (a)
presents two series of automatic measurements ob-
tained using two different strain threshold settings
over 150 minutes of monitoring. Figure 8 (b) com-
pares the interquartile ranges of lumen decrease for
these two strain threshold settings. A higher strain
threshold setting results in significantly greater intra-
subject variability in the estimated decrease in vein
lumen.
0 2 4 6 8 10 12
Strain threshold (%)
-100
-80
-60
-40
-20
0
Lumen decrease (%)
Manual
Automatic
Figure 7: Box-plot of vein lumen decrements in healthy
subjects during manual (by-hand) and automatic compres-
sion.
The boxplot in Figure 8 (b) provides a statistical
representation of the data in Figure 8 (a). The notches
do not overlap, which suggests a statistically signif-
icant difference in medians between the two groups.
The left boxplot (2.5% threshold) has a much tighter
interquartile range, indicating lower variability when
compared to the right boxplot (4.5% threshold).
0 50 100 150
Time (min)
-100
-80
-60
-40
-20
0
Lumen decrease (%)
a)
Threshold 4.5%
Threshold 2.5%
2.5 4.5
Strain threshold (%)
b)
Figure 8: Results of vein lumen response using a thigh-
mounted imaging transducer, with automated compression
doses set to strain thresholds of 2.5% and 4.5%. A single
actuator application produced 31 repeated automated com-
pressions at each threshold over a 2.5-hour period.
Automating Compression Ultrasonography of Human Thigh Tissue and Vessels via Strain Estimation
243

4 DISCUSSION
The tissue response to compression is subject-
specific. Deformation and accordingly calculated
strain depend on the site of actuation. If the actua-
tor is mounted on the side with varying layers of adi-
pose superficial tissue, or varying stiffness of muscle
because of involuntary movements of the leg the re-
actions to compression will be different. So the intra-
subject peculiarities of tissues are proposed to be con-
sidered with the initial adjustment of the strain thresh-
old. The automatic compressions are performed from
the back side of the thigh and result in smaller mod-
ulation of strain. Despite low modulation of strain,
the actuation on the thigh from the opposite side and
the use of rigid pre-shaped frames to mount the imag-
ing transducer and actuating bladders contribute to re-
ducing uncertainty in tissue response (reducing shear
deformation).
The whole B-mode image was used for the strain
estimate calculation and not justified to regions of
thigh tissues. Adjusting region for strain estimation
could potentially increase strain modulation and the
accuracy in quantifying compression amount. Pro-
vided experimental results are from a limited num-
ber of healthy subjects. The personal body charac-
teristics were not examined in detail, thus further re-
search is needed including a bigger group of subjects
with higher variability in body composition. Addi-
tionally, individualized calibration should be devel-
oped to perform long-term accurate monitoring of tis-
sue response.
5 CONCLUSIONS
In this study, an ultrasonography tissue compression
actuator for automated long-term monitoring of ve-
nous vessels in the lower extremities is proposed. The
actuator is controlled by a tissue strain parameter that
regulates compression. The results show a negative
correlation between venous vessel lumen closure and
the tissue strain parameter, suggesting that using tis-
sue strain as a feedback mechanism is feasible. How-
ever, the variability at a higher strain threshold is rel-
atively big, leaving room for improvement. Inter-
subject variability could be addressed through initial
calibration, while intra-subject variability for moni-
toring applications could be managed by defining a
more targeted region of interest.
ACKNOWLEDGEMENTS
This work is funded under the Horizon Europe In-
novation Action ThrombUS+ (Grant Agreement No.
101137227), co-funded by the European Union.
REFERENCES
Cronan, J. J. (2003). History of venous ultrasound. J Ultra-
sound Med, 22(11):1143–1146.
Garra, B. S. (2015). Elastography: history, principles, and
technique comparison. Abdom Imaging, 40(4):680–
697.
Heitmann, B. L. and Frederiksen, P. (2009). Thigh circum-
ference and risk of heart disease and premature death:
prospective cohort study. BMJ, 339:b3292.
Liu, Y., Deng, X., Zhu, F., Zhu, W., and Wang, Z. (2023).
High fibrinogen and mixed proximal and distal throm-
bosis are associated with the risk of residual venous
thrombosis in patients with posttraumatic deep vein
thrombosis. Front Cardiovasc Med, 10:1003197.
Matsubara, S., Sugiyama, S., and Waki, N. (2022). Is long-
axis or short-axis pulsed wave doppler optimal for pre-
operative assessment of varicose veins in the lower
extremities? The Japanese Journal of Phlebology,
33:317–321.
Palareti, G., Cosmi, B., Legnani, C., Antonucci, E.,
De Micheli, V., Ghirarduzzi, A., Poli, D., Testa, S.,
Tosetto, A., Pengo, V., Prandoni, P., and DULCIS
(D-dimer and ULtrasonography in Combination Ital-
ian Study) Investigators (2014). D-dimer to guide
the duration of anticoagulation in patients with ve-
nous thromboembolism: a management study. Blood,
124(2):196–203.
Prandoni, P., Lensing, A. W. A., Prins, M. H., Bernardi, E.,
Marchiori, A., Bagatella, P., Frulla, M., Mosena, L.,
Tormene, D., Piccioli, A., Simioni, P., and Girolami,
A. (2002). Residual venous thrombosis as a predictive
factor of recurrent venous thromboembolism. Ann In-
tern Med, 137(12):955–960.
Raghavendra, B. N., Horii, S. C., Hilton, S., Subramanyam,
B. R., Rosen, R. J., and Lam, S. (1986). Deep venous
thrombosis: detection by probe compression of veins.
J Ultrasound Med, 5(2):89–95.
Talbot, S. et al. (1982). Use of real-time imaging in iden-
tifying deep venous obstruction: a preliminary report.
Bruit, 6(41-42):9.
Tan, M., Bornais, C., and Rodger, M. (2012). Interob-
server reliability of compression ultrasound for resid-
ual thrombosis after first unprovoked deep vein throm-
bosis. J Thromb Haemost, 10(9):1775–1782.
Zahiri Azar, R. and Salcudean, S. (2006). Motion esti-
mation in ultrasound images using time domain cross
correlation with prior estimates. IEEE transactions on
bio-medical engineering, 53:1990–2000.
BIOIMAGING 2025 - 12th International Conference on Bioimaging
244
APPENDIX
5
10
15
20
25
30
35
40
45
50
Depth (mm)
10 20 30 40 50
Width (mm)
Lumen decr. (%), -4
Strain (%), 0.01
A
5
10
15
20
25
30
35
40
45
50
Depth (mm)
10 20 30 40 50
Width (mm)
Lumen decr. (%), -5
Strain (%), 0.5
B
5
10
15
20
25
30
35
40
45
50
Depth (mm)
10 20 30 40 50
Width (mm)
Lumen decr. (%), -13
Strain (%), 1
C
5
10
15
20
25
30
35
40
45
50
Depth (mm)
10 20 30 40 50
Width (mm)
Lumen decr. (%), -21
Strain (%), 2
D
5
10
15
20
25
30
35
40
45
50
Depth (mm)
10 20 30 40 50
Width (mm)
Lumen decr. (%), -36
Strain (%), 4
E
5
10
15
20
25
30
35
40
45
50
Depth (mm)
10 20 30 40 50
Width (mm)
Lumen decr. (%), -66
Strain (%), 6
F
5
10
15
20
25
30
35
40
45
50
Depth (mm)
10 20 30 40 50
Width (mm)
Lumen decr. (%), -82
Strain (%), 8
G
5
10
15
20
25
30
35
40
45
50
Depth (mm)
10 20 30 40 50
Width (mm)
Lumen decr. (%), -87
Strain (%), 9
H
Figure 9: Cross-sectional images of femoral vessels during compression session of the thigh tissues. The artery is the most
left circular pattern in all images and does not collapse at the end of the compression session.
5
10
15
20
25
30
35
40
Depth (mm)
10 20 30 40
Width (mm)
Lumen decr. (%), -7
Strain (%), 2.5
A
5
10
15
20
25
30
35
40
Depth (mm)
10 20 30 40
Width (mm)
Lumen decr. (%), -9
Strain (%), 3.5
B
5
10
15
20
25
30
35
40
Depth (mm)
10 20 30 40
Width (mm)
Lumen decr. (%), -18
Strain (%), 4.5
C
5
10
15
20
25
30
35
40
Depth (mm)
10 20 30 40
Width (mm)
Lumen decr. (%), -31
Strain (%), 5.5
D
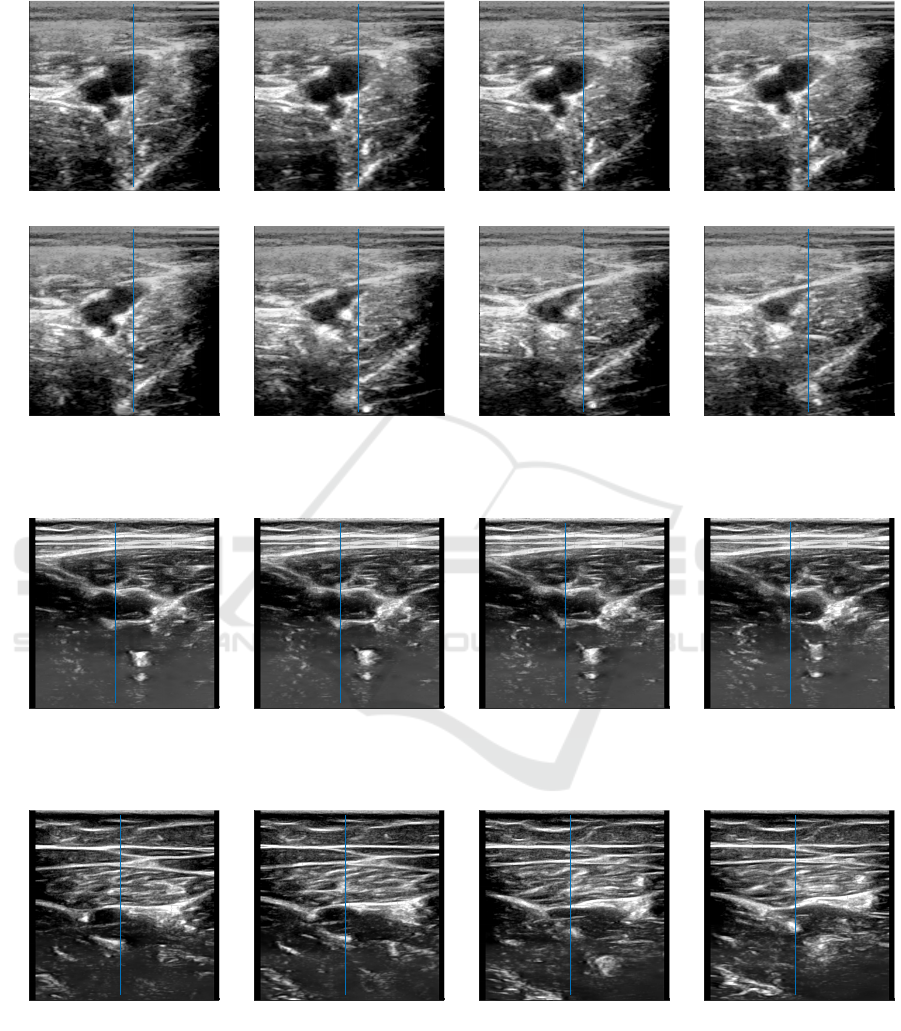
Figure 10: Cross-sectional images of blood vessels during automated compression (up to strain 5.5%) of thigh tissues: inter-
mediate reactions of one of the subjects characterized in Figures 6.
5
10
15
20
25
30
35
40
Depth (mm)
10 20 30 40
Width (mm)
Lumen decr. (%), -5
Strain (%), 2
A
5
10
15
20
25
30
35
40
Depth (mm)
10 20 30 40
Width (mm)
Lumen decr. (%), -17
Strain (%), 5
B
5
10
15
20
25
30
35
40
Depth (mm)
10 20 30 40
Width (mm)
Lumen decr. (%), -36
Strain (%), 8
C
5
10
15
20
25
30
35
40
Depth (mm)
10 20 30 40
Width (mm)
Lumen decr. (%), -68
Strain (%), 11
D
Figure 11: Cross-sectional images of blood vessels during manual compression (up to strain 11%) of thigh tissues: interme-
diate reactions of one of the subjects characterized in Figures 6.
Automating Compression Ultrasonography of Human Thigh Tissue and Vessels via Strain Estimation
245
