
Efficient CNN-Based System for Automated Beetle Elytra Coordinates
Prediction
Hojin Yoo
1 a
, Dhanyapriya Somasundaram
2 b
and Hyunju Oh
1 c
1
Department of Computer Science and Engineering, The Ohio State University, U.S.A.
2
Department of Data Science, University of Arizona, U.S.A.
Keywords:
Beetle Elytra, Convolutional Neural Networks, Object Detection, Regression Models.
Abstract:
Beetles represent nearly a quarter of all known animal species and play crucial roles in ecosystems. A key
morphological feature, the elytra, provides essential protection and adaptability but measuring their size man-
ually is labor-intensive and prone to errors, especially with large datasets containing multiple specimens per
image. To address this, we introduce a deep learning-based framework that automates the detection and mea-
surement of beetle elytra using Convolutional Neural Networks (CNN). Our system integrates advanced object
detection techniques to accurately localize individual beetles and predict elytra coordinates, enabling precise
measurement of elytra length and width. Additionally, we recreated an existing beetle dataset tailored for
elytra coordinate prediction. Through comprehensive experiments and ablation studies, we optimized our
framework to achieve a measurement accuracy with an error margin of only 0.1 cm. This automated approach
significantly reduces manual effort and facilitates large-scale beetle trait analysis, thereby advancing biodiver-
sity research and ecological assessments. Code is available at https://github.com/yoohj0416/predictbeetle.
1 INTRODUCTION
Beetles (Coleoptera) represent nearly 25% of all
known animal species, with over 400,000 described
species worldwide. They play critical roles in ecosys-
tems as decomposers, pollinators, and predators, con-
tributing significantly to nutrient cycling, pest con-
trol, and soil aeration. Consequently, studying bee-
tles offers crucial insights into biodiversity, ecosystem
health, and evolutionary processes. Given their eco-
logical importance, beetles are often used as bioindi-
cators for monitoring environmental changes and as-
sessing ecosystem resilience (Langhans and Tockner,
2014).
A distinctive and scientifically relevant feature of
beetles is their hardened forewings, known as elytra,
which protect the delicate hindwings and body. Stud-
ies on elytra have yielded valuable information about
beetle morphology and adaptation. For instance, the
size of the elytra—its length and width—can indicate
a beetle’s habitat and ecological niche, with larger
elytra often associated with open, arid environments
a
https://orcid.org/0000-0002-4291-0745
b
https://orcid.org/0009-0000-7606-4623
c
https://orcid.org/0009-0006-8600-1208
and smaller or more compact elytra linked to humid,
dense vegetation (Ernst and Buddle, 2015).
However, manually measuring beetle elytra in
large datasets is labor-intensive and time-consuming.
Traditional measurement techniques involve physi-
cally handling specimens, which risks errors and be-
comes particularly challenging when multiple beetles
are preserved in a single image (Gibb et al., 2013).
To address this, automated, scalable methods are ur-
gently needed for accurate trait analysis.
CNN have propelled image analysis in special-
ized tasks, such as license plate recognition and insect
landmark identification (Yoo and Jun, 2020; Yoo and
Jun, 2021; Le et al., 2020). Despite these successes,
there remains a gap in leveraging CNN for predicting
elytra size in various beetle species, especially within
images containing multiple individuals. Bridging this
gap is critical for advancing large-scale trait analy-
sis and supporting broader ecological and evolution-
ary research.
To tackle this challenge, we propose a deep
learning-based framework for automating the detec-
tion and measurement of beetle elytra (Figure 1). Our
approach utilizes object detection and CNN to pre-
dict the coordinates of the elytra, enabling precise
measurement of their length and width with minimal
934
Yoo, H., Somasundaram, D. and Oh, H.
Efficient CNN-Based System for Automated Beetle Elytra Coordinates Prediction.
DOI: 10.5220/0013264600003912
Paper published under CC license (CC BY-NC-ND 4.0)
In Proceedings of the 20th International Joint Conference on Computer Vision, Imaging and Computer Graphics Theory and Applications (VISIGRAPP 2025) - Volume 2: VISAPP, pages
934-941
ISBN: 978-989-758-728-3; ISSN: 2184-4321
Proceedings Copyright © 2025 by SCITEPRESS – Science and Technology Publications, Lda.
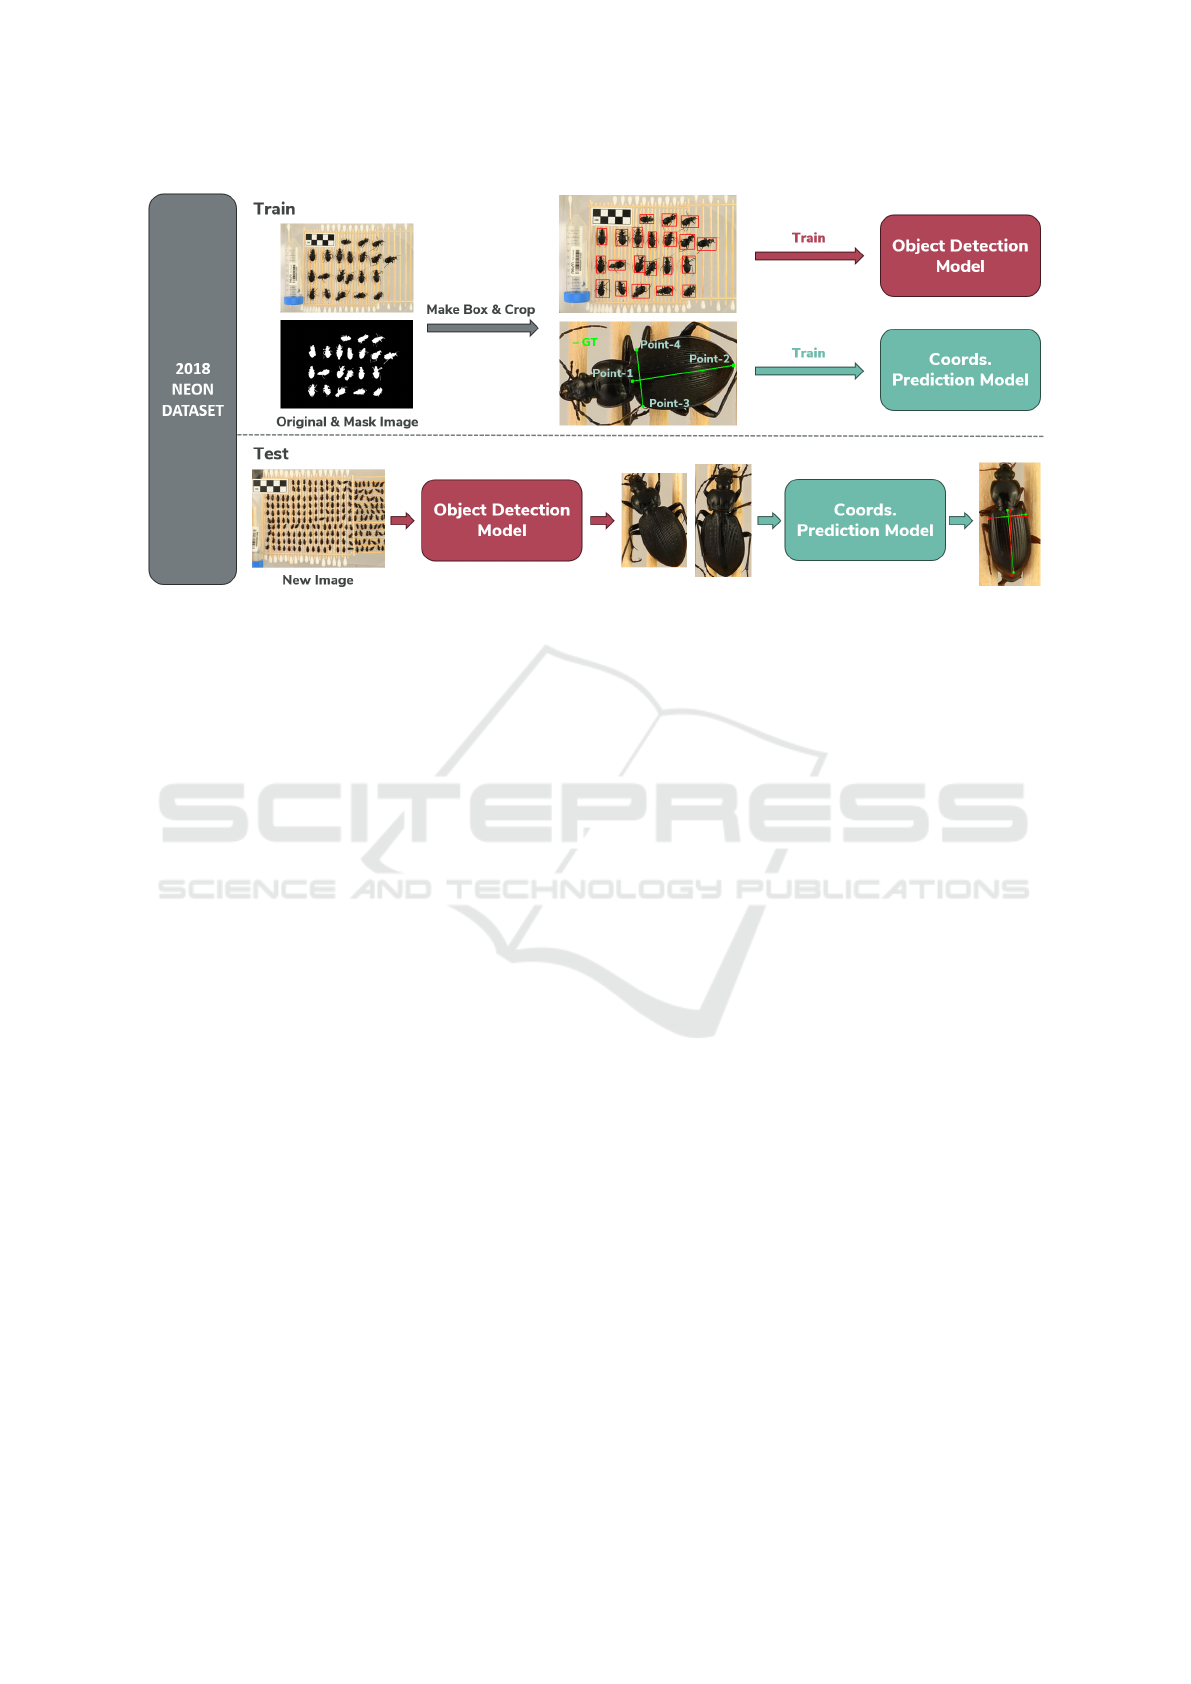
Figure 1: Overall Architecture of the Proposed CNN-Based Framework for Automated Beetle Elytra Coordinates Prediction.
Connecting Point-1 and Point-2 represents the elytra length, while connecting Point-3 and Point-4 represents the elytra width.
manual effort. The key contributions of our work are
threefold:
• We develop a system that integrates object detec-
tion and CNN-based elytra prediction, enabling
accurate measurement of beetle elytra size from
images.
• We recreate an existing beetle dataset to facili-
tate more precise prediction of elytra coordinates,
thereby enabling large-scale trait analysis.
• We conduct extensive experiments and ablation
studies to determine optimal configurations and
parameters, ensuring both high accuracy and ef-
ficiency.
2 RELATED WORK
Significance of Beetle Elytra. The elytra, or hard-
ened forewings of beetles, are crucial to Coleoptera’s
ecological success. They protect delicate hindwings,
aid in thermal regulation and water conservation, and
offer camouflage, enabling beetles to flourish in di-
verse habitats. In ecological studies, elytra size and
morphology provide insights into habitat preferences,
predatory avoidance, and reproductive strategies, of-
ten correlating with environmental conditions such as
humidity, temperature, and vegetation. From an evo-
lutionary standpoint, robust elytra support survival in
harsh environments, whereas softer elytra favor moist,
sheltered areas (Goczał and Beutel, 2023; Beutel and
Leschen, 2016). These variations illuminate phylo-
genetic relationships and underscore elytra’s role in
flight dynamics and speciation (Zhao et al., 2021).
Elytra-based analyses also inform biodiversity
conservation by enabling species identification and
population monitoring, particularly under habitat loss
and climate change (Langhans and Tockner, 2014;
Ernst and Buddle, 2015; Gibb et al., 2013; Goczał
and Beutel, 2023). Advancements in imaging and
machine learning have further streamlined large-
scale morphological studies, reducing manual effort
and improving measurement accuracy (Goczał and
Beutel, 2023). In cases where elytra are reduced
or lost, beetles rely on alternative defense mecha-
nisms, including Batesian mimicry, chemical pro-
tection, and bioluminescence—adaptations that high-
light beetles’ evolutionary plasticity and underscore
the fundamental importance of elytra in their diversi-
fication (Goczał, 2023).
Applications of CNN. CNN have transformed im-
age classification through hierarchical feature extrac-
tion, starting with LeNet-5 (LeCun et al., 1998)
and evolving with AlexNet (Krizhevsky et al.,
2012), VGGNet (Simonyan and Zisserman, 2014),
GoogLeNet (Szegedy et al., 2015), and ResNet (He
et al., 2016), leading to high performance across di-
verse domains like medical imaging (Litjens et al.,
2017). In object detection, R-CNN (Girshick et al.,
2014) laid the groundwork for Fast R-CNN (Girshick,
2015), Faster R-CNN (Ren et al., 2016), YOLO (Red-
mon, 2016), and CornerNet (Law and Deng, 2018),
enabling accurate, real-time detection for applications
such as autonomous driving. CNN-based face recog-
nition, exemplified by DeepFace (Taigman et al.,
2014) and FaceNet (Schroff et al., 2015), has achieved
near-human accuracy. Further specialized tasks in-
Efficient CNN-Based System for Automated Beetle Elytra Coordinates Prediction
935

clude license plate detection (Yoo and Jun, 2020; Yoo
and Jun, 2021) and automated insect landmarking (Le
et al., 2020). Despite these advances, the use of CNN
to predict elytra size in multiple beetle species re-
mains underexplored, representing a significant gap
in morphological research.
3 BEETLE ELYTRA SIZE
PREDICTION
In this section, we present the methodologies used to
automate the prediction of elytra size in ground bee-
tles via computer vision techniques. Our approach
is divided into two main tasks: object detection for
beetle localization and elytra size prediction. By ad-
dressing these tasks sequentially, we establish a robust
framework that enables accurate, efficient morpho-
logical analysis of beetles from grouped images. As
illustrated in Figure 1, our system’s workflow covers
the entire process, from input images and beetle lo-
calization to the precise measurement of elytra length
and width.
Object Detection for Elytra Size Prediction. The
first step involves accurately identifying and localiz-
ing each beetle within grouped images to enable sub-
sequent elytra size measurements. The grouped im-
ages display considerable variability in beetle counts
per image, ranging from a single specimen to over
eighty. This variation creates challenges for direct
elytra size prediction, as overlapping or closely po-
sitioned beetles can obscure individual features and
hinder measurement accuracy. To address this, we
propose training an object detection model specifi-
cally tailored to detect and delineate each beetle in
the grouped images.
For precise localization, contour detection tech-
niques are applied to mask images of individual bee-
tles, extracting bounding boxes around each speci-
men. These bounding boxes serve as ground truth an-
notations for training the object detection model, al-
lowing it to learn the spatial distribution and size vari-
ations of beetles across diverse images. The process
for generating bounding box annotations from mask
images is described in Section 4.2. By applying the
loss function established in prior research (Reis et al.,
2023), our model is optimized to accurately identify
beetle locations and sizes within grouped images. The
trained model effectively manages variations in bee-
tle count and positioning, ensuring reliable detection
across the dataset.
Elytra Size Prediction. After detecting and isolat-
ing individual beetles, the next phase focuses on pre-
dicting the coordinates of the elytra to determine their
length and width. We propose a deep neural network
that integrates a CNN backbone with fully connected
(FC) layers for elytra coordinate regression. Specif-
ically, the FC layer predicts eight coordinate values:
(x
1
, y
1
, x
2
, y
2
, x
3
, y
3
, x
4
, y
4
), representing four pairs of
coordinates defining the elytra boundaries. This de-
sign enables the model to accurately identify key mor-
phological points essential for measuring elytra di-
mensions, as illustrated in Figure 1.
To train the elytra coordinates prediction model,
we employ a loss function based on the sum of
squared differences (SSD) between the ground truth
annotations and the predicted coordinates, as shown
in Equation 1. SSD quantifies the discrepancy be-
tween the model’s predictions and actual elytra posi-
tions, thereby enhancing regression accuracy. While
mean squared error (MSE) is a common choice, our
ablation studies indicate that SSD provides superior
prediction accuracy for this task, as it more effectively
captures cumulative differences across all coordinate
points. Consequently, we selected SSD to optimize
training and ensure reliable elytra dimension predic-
tions.
Loss
SSD
=
4
∑
i=1
(x
gt
i
− x
pred
i
)
2
+ (y
gt
i
− y
pred
i
)
2
(1)
By merging object detection and elytra size pre-
diction, we create a comprehensive system capa-
ble of autonomously analyzing beetle morphology in
grouped images. Isolating each beetle and then pre-
dicting elytra coordinates with high precision signif-
icantly reduces manual annotation needs and stream-
lines morphological data gathering. This automated
pipeline not only scales more effectively for beetle
studies but also lays the groundwork for future com-
puter vision advances in entomological research. The
resulting models support large-scale ecological as-
sessments, offering deeper insights into beetle bio-
diversity and how environmental factors affect their
populations.
4 BEETLE ELYTRA SIZE
PREDICTION DATASET
This section provides an overview of the dataset used
for Beetle Elytra Size Prediction. We detail the 2018-
NEON-beetles dataset (Fluck et al., 2024), including
its background (Section 4.1), re-creation process for
individual specimen images (Section 4.2), and statis-
tical analyses ensuring balanced representation (Sec-
VISAPP 2025 - 20th International Conference on Computer Vision Theory and Applications
936
tion 4.3). These steps establish a solid foundation for
our predictive models.
4.1 Dataset Background
The 2018-NEON-beetles dataset was originally com-
posed of 577 high-resolution images of ground bee-
tles collected in 2018 from diverse NEON sites.
These images showcase multiple beetles arranged in
a lattice pattern, each accompanied by a centimeter-
based scalebar and a unique barcode specifying
the sample’s origin. Detailed elytra measurements
(length and width) were recorded using the Zooni-
verse platform, providing reliable morphological data
through consistent annotation protocols.
(Ramirez and Campolongo, 2024) facilitated ad-
vanced analyses, such as automated segmentation and
morphological assessments, by employing the Seg-
ment Anything Model (SAM)(Kirillov et al., 2023).
They used the elytra coordinates as key input points
for SAM’s point-based segmentation, allowing each
beetle to be isolated through the generated mask im-
ages. However, due to inconsistencies in mask gen-
eration for some images, 103 grouped images were
excluded. As a result, the final curated dataset com-
prises 474 grouped images, providing a robust foun-
dation for subsequent machine learning tasks.
4.2 Dataset Re-Creation
Recreating the 2018-NEON-beetles dataset for object
detection and elytra coordinate prediction was a crit-
ical endeavor, aimed at enabling more refined ma-
chine learning applications. First, bounding boxes
were extracted from the SAM-generated mask im-
ages through contour detection, precisely localizing
each beetle within the original grouped images. These
bounding boxes were then used as ground truth anno-
tations for training an object detection model, allow-
ing for automated identification of individual beetles
in images containing multiple specimens.
In the next step, each beetle was cropped from the
grouped images based on its bounding box to cre-
ate standalone images. This process ensured a con-
sistent format for training a dedicated model to pre-
dict elytra length and width coordinates. The origi-
nal elytra annotations—provided for the grouped im-
ages—were carefully recalibrated to match the new
cropped images. By aligning the annotation coor-
dinates with the individual beetle images, we estab-
lished accurate ground truth data for elytra measure-
ments. This method preserves the morphological in-
tegrity of the original dataset while making it more
flexible for large-scale morphological and ecological
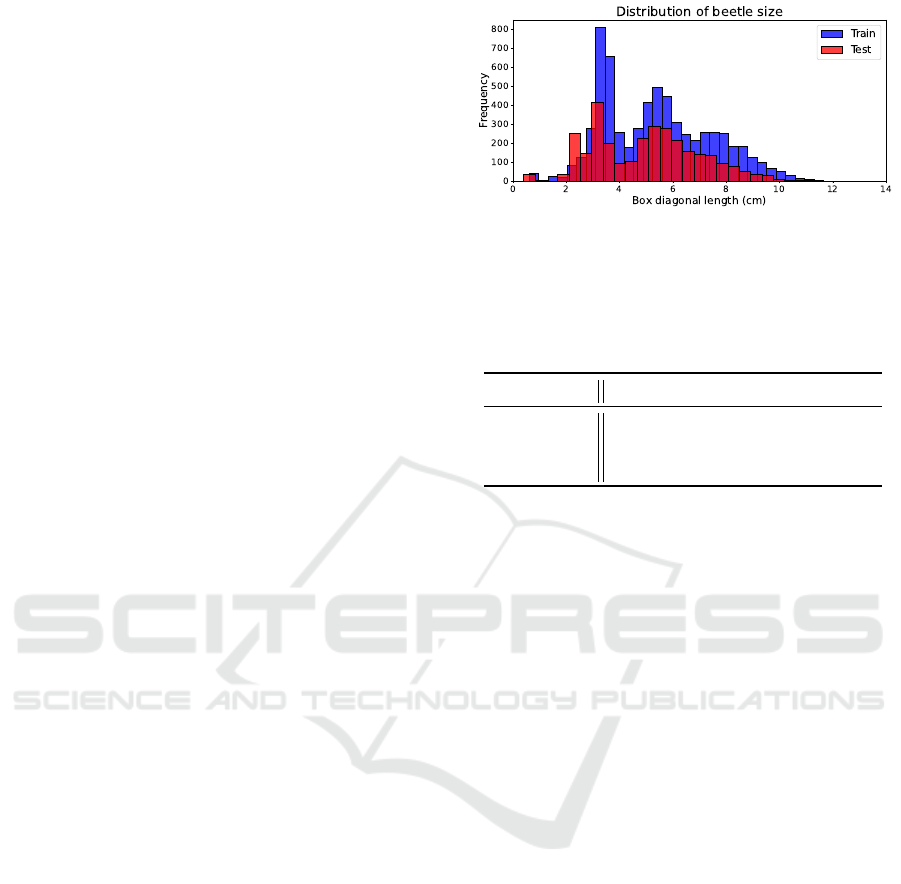
Figure 2: Distribution of Beetle Sizes in Training and Test-
ing Datasets. Size is quantified by the diagonal length of the
bounding boxes (cm).
Table 1: Performance Comparison of Object Detection
Models for Beetle. mAP refers to mAP50-95, and Infer-
time indicates the average inference time for all test images.
Model AP50 mAP Infer-time(ms)
YOLOv8n 0.968 0.800 3.8
YOLOv8s 0.970 0.805 4.3
YOLOv8m 0.971 0.804 38.6
research.
4.3 Dataset Statistics
From the curated set of 474 grouped images, 331 were
designated for training and 143 for testing. Following
the approach described in Section 4.2, individual bee-
tle images were produced, yielding 6,469 samples for
training and 3,074 for testing. To fine-tune model per-
formance, the training set was further partitioned into
5,175 training samples and 1,294 validation samples,
maintaining a substantial representation of beetle di-
versity.
To assess any potential size-based biases, bound-
ing box diagonals were converted to centimeters and
compared across the training and testing sets (Fig-
ure 2). The closely aligned size distributions indi-
cate a balanced representation of beetle morpholo-
gies, minimizing risks of overfitting to specific size
ranges. All models in this study were trained on these
consistent data splits, ensuring a fair basis for model
comparison and performance evaluation.
5 EXPERIMENT
In this section, we address two primary tasks: object
detection and elytra coordinates prediction. Multiple
models were trained for each task to determine the
most effective approach for beetle researchers. Sec-
tion 5.1 presents the evaluation metrics and exper-
imental details, Section 5.2 provides a comparative
Efficient CNN-Based System for Automated Beetle Elytra Coordinates Prediction
937
Table 2: Performance Comparison of Elytra Size Prediction Models.
Model MSE ↓ Params FLOPs Infer-time(ms)
ResNet50 1.941E-03 23.5M 4.1B 30
ResNet101 1.971E-03 42.5M 7.9B 52
MobileNetV3-Large 1.952E-03 4.2M 238M 18
EfficientNetV2-S 1.870E-03 20.2M 2.9B 74
EfficientNetV2-M 1.756E-03 52.9M 5.5B 86
Table 3: Impact of Batch Size on Performance.
Model Batch Size MSE
ResNet50
8 2.199E-03
16 2.007E-03
32 1.941E-03
analysis of the models, Section 5.3discusses our abla-
tion studies, and Section 5.4 demonstrates real-world
validation by converting pixel-level predictions into
centimeter-level measurements.
5.1 Experimental Setup
We fine-tuned YOLOv8 (Reis et al., 2023), initially
pretrained on the COCO dataset (Lin et al., 2014),
to detect and localize beetles within grouped images.
Model performance was assessed via average preci-
sion (AP) at an Intersection over Union (IoU) thresh-
old of 0.50 (AP50) and mean AP across IoU thresh-
olds of 0.50 to 0.95 (mAP50–95). Each YOLOv8
model was trained for 100 epochs with a batch size
of 16 and a learning rate of 0.01. Data augmen-
tations—including random scaling, flips, and color
adjustments—were applied using Ultralytics’ default
settings to enhance generalization during fine-tuning.
For predicting beetle elytra width and length, we
fine-tuned three backbone architectures—ResNet (He
et al., 2016), MobileNetV3 (Howard et al., 2019),
and EfficientNetV2 (Tan and Le, 2021)—originally
pretrained on ImageNet. A fully connected layer
produced eight (x, y) values corresponding to ely-
tra boundaries. These models were trained for 500
epochs with a batch size of 32, an input size of
224 × 224 pixels, and a learning rate of 0.001. To
preserve image aspect ratios and avoid distorting ely-
tra features, zero-padding was used during resizing.
Horizontal and vertical flips served as augmentations
to increase dataset variety.
All models used the same dataset split, ensuring
fair comparisons. Training and inference were carried
out in an environment equipped with Intel Xeon 8268
CPUs and NVIDIA Volta V100 GPUs.
Table 4: Performance Comparison of Loss Functions for
Elytra Size Prediction. Mean denotes models trained using
MSE as the loss function, while Sum denotes models trained
using SSD as the loss function.
Model Loss Function MSE
ResNet50
Mean 1.969E-03
Sum 1.941E-03
EfficientNetV2-S
Mean 2.027E-03
Sum 1.870E-03
EfficientNetV2-M
Mean 1.864E-03
Sum 1.756E-03
Table 5: Impact of Input Size on EfficientNetV2 Perfor-
mance.
Model Input Size MSE
EfficientNetV2-S
224 1.870E-03
386 1.875E-03
EfficientNetV2-M
224 1.756E-03
480 2.130E-03
5.2 Experimental Results
In this section, we summarize the experimental re-
sults for object detection and beetle elytra coordinates
prediction. We evaluate multiple models based on
performance metrics, parameter counts, FLOPs, and
inference time, offering a comprehensive view that
helps researchers select models best suited to their
computational constraints.
Comparison on Object Detection Models.
Table 1 presents the performance of three
YOLOv8 variants—YOLOv8n, YOLOv8s, and
YOLOv8m—trained on grouped beetle images.
YOLOv8m achieved the highest AP50 (0.971),
indicating superior precision in detecting the beetle
class at an IoU threshold of 0.50, while YOLOv8s
recorded the highest mAP (0.805). The difference in
mAP across the three models was minimal (largest
gap of 0.005), suggesting that all variants perform
comparably under our single-class detection scenario.
This relatively small performance gap can be at-
VISAPP 2025 - 20th International Conference on Computer Vision Theory and Applications
938
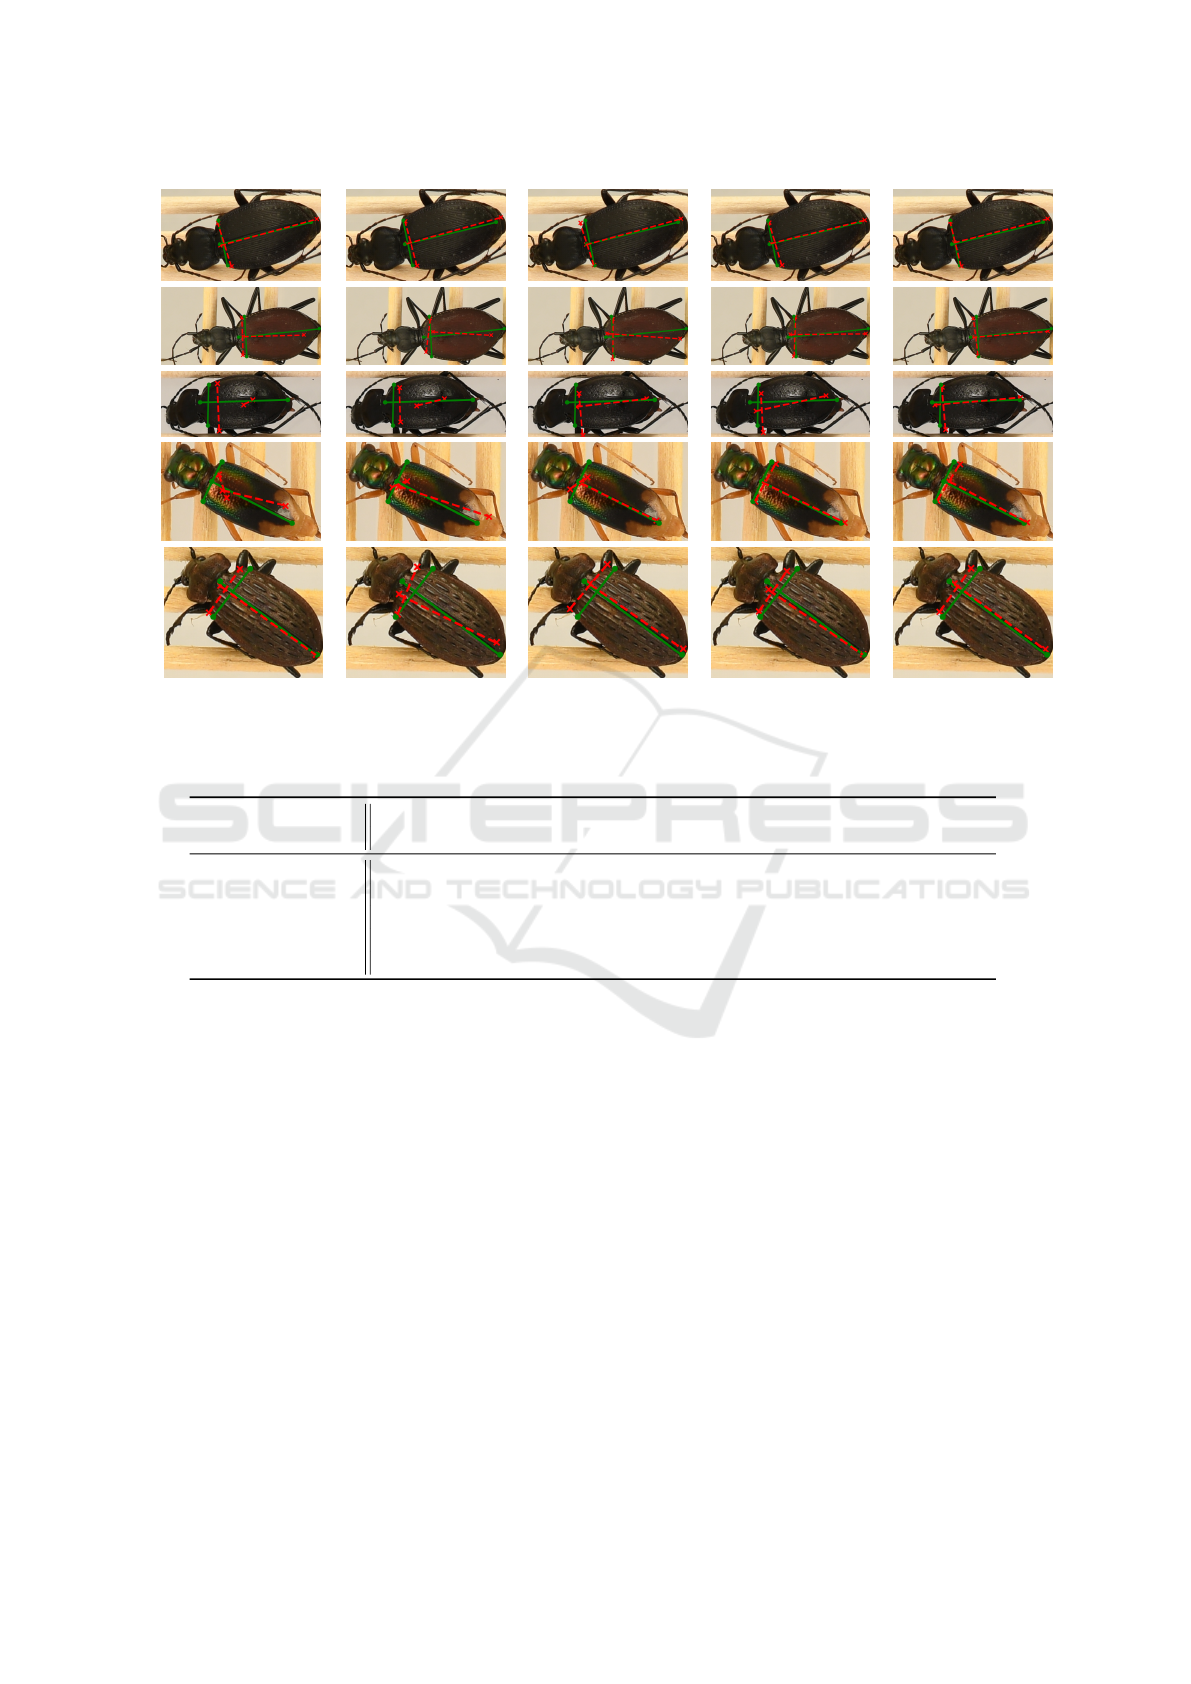
(a) ResNet50 (b) ResNet101 (c) MobileNetV3-L (d) EfficientNetV2-S (e) EfficientNetV2-M
Figure 3: Example Results of Elytra Coordinates Prediction by Different CNN Models. Green lines indicate the ground truth
elytra boundaries, while red dotted lines represent the predicted coordinates.
Table 6: Centimeter-Level Average Points Difference for Beetle Elytra Coordinates Prediction Models.
Model
Points Difference (cm) ↓
Point 1 Point 2 Point 3 Point 4 Total
ResNet50 0.103 0.124 0.143 0.143 0.128
ResNet101 0.105 0.127 0.151 0.145 0.132
MobileNetV3-Large 0.091 0.108 0.137 0.135 0.118
EfficientNetV2-S 0.081 0.095 0.131 0.132 0.110
EfficientNetV2-M 0.091 0.098 0.128 0.123 0.110
tributed to the well-organized and uncluttered na-
ture of the images, where each beetle is clearly vis-
ible. Consequently, models benefit from straight-
forward detection tasks, unlike multi-class scenarios
with substantial occlusions or overlapping objects.
Researchers aiming for faster inference may prefer
YOLOv8n or YOLOv8s, accepting a negligible ac-
curacy trade-off for improved speed. Conversely,
YOLOv8m may be more suitable where the highest
precision is essential.
Comparison on Prediction Models. We next inves-
tigated ResNet, MobileNetV3, and EfficientNetV2
for elytra coordinates prediction in individual bee-
tle images. Table 2 summarizes the performance of
each model on the test set. EfficientNetV2 outper-
formed ResNet, suggesting that its depth-wise scal-
ing strategy offers a pronounced advantage in captur-
ing crucial elytra features. MobileNetV3 performed
comparably to ResNet while maintaining a notably
smaller architecture, which is beneficial in resource-
constrained environments.
These observations highlight that Efficient-
NetV2’s higher accuracy makes it a strong candidate
for tasks demanding maximal precision in elytra
measurement. In scenarios where computational
overhead and inference speed are primary concerns,
MobileNetV3’s reduced parameter count and FLOPs
make it an appealing alternative. As illustrated
by a sample of prediction results in Figure 3, Ef-
ficientNetV2 consistently produces more precise
elytra boundary estimates, whereas MobileNetV3
remains competitive without incurring significant
computational costs.
Efficient CNN-Based System for Automated Beetle Elytra Coordinates Prediction
939

5.3 Ablation Studies
We conducted three ablation studies to identify the
optimal settings for beetle elytra coordinates predic-
tion, focusing on batch size, loss function, and input
size. First, we tested ResNet50 with batch sizes of
32, 16, and 8. Table 3 shows that a batch size of 32
yielded the lowest MSE, attributed to the SSD loss
function’s summation of differences, which yields
more robust gradient signals than smaller batch sizes.
Second, we compared SSD and MSE loss
functions on ResNet50, EfficientNetV2-S, and
EfficientNetV2-M. As seen in Table 4, the SSD-
based models consistently outperformed their MSE
counterparts, reinforcing that the SSD loss’s cumu-
lative approach facilitates better optimization. Lastly,
we examined different input resolutions for Efficient-
NetV2. Table 5 shows that 224 × 224 pixels produced
lower MSE, partly due to the zero-padding process at
higher resolutions, which introduces additional non-
informative pixels. Furthermore, the elytra coordi-
nate task is less complex than high-class classifica-
tion tasks, reducing the benefits of larger input sizes.
These findings confirm batch size 32, SSD loss, and
224 × 224 pixels as the most effective configuration.
5.4 Real-World Validation
While MSE offers a metric for evaluating predic-
tion accuracy, it is expressed in pixel-level differ-
ences. To provide practical relevance for beetle re-
searchers, we converted these pixel-level discrepan-
cies into centimeter-level errors using the scale bars
in the images (Table 6). The results indicate superior
performance on elytra length coordinates (points 1
and 2) over width coordinates (points 3 and 4), reflect-
ing the greater variability associated with partially
open or missing elytra. Notably, EfficientNetV2-S
and EfficientNetV2-M achieved an average deviation
of 0.110cm, indicating that our models can predict
elytra size within ∼ 0.1 cm of the ground truth. This
level of accuracy substantially reduces manual mea-
surement efforts, thereby facilitating more efficient
and reliable morphological analyses.
6 LIMITATIONS
While our deep learning-based approach achieves
strong performance for both object detection and ely-
tra coordinates prediction, it remains susceptible to
domain shifts, such as changes in plate color or ma-
terial. These variations can diminish detection accu-
racy, highlighting a need for zero-shot or few-shot ob-
ject detection techniques to improve adaptability and
generalizability in beetle elytra size analysis. Ad-
ditionally, training Transformer-based models (e.g.,
SwinTransformer (Liu et al., 2021), ViT (Dosovit-
skiy, 2020)) for elytra coordinates prediction poses
complexity due to their global attention mechanisms,
which must consider all regions of an image simul-
taneously. As observed in a study on license plate
corner prediction (Jun, 2023), ViT-based methods can
face challenges in regression tasks, often yielding
comparable or lower performance than CNN archi-
tectures (e.g., ResNet, MobileNet).
7 CONCLUSIONS
We presented an integrated framework for Beetle Ely-
tra Size Prediction, combining object detection with
elytra coordinate estimation. By comparing multiple
models, we identified YOLOv8s (Reis et al., 2023)
for object detection and EfficientNetV2 (Tan and Le,
2021) for accurate elytra measurement, supported by
ablation studies demonstrating the efficacy of a batch
size of 32, SSD loss, and an input size of 224 × 224
pixels. Our best-performing model achieved an elytra
coordinate prediction error of approximately 0.1 cm.
To address susceptibility to domain shifts, future work
will explore advanced detection strategies (e.g., zero-
shot) and foundation models, aiming to further reduce
manual annotation and facilitate large-scale ecologi-
cal research.
ACKNOWLEDGEMENTS
This work was supported by the NSF OAC
2118240 Imageomics Institute award and was ini-
tiated at Beetlepalooza 2024. More details about
Beetlepalooza can be found on https://github.com/
Imageomics/BeetlePalooza-2024.
REFERENCES
Beutel, R. G. and Leschen, R. A. (2016). Coleoptera, bee-
tles. Morphology and systematics. Walter de Gruyter
GmbH & Co KG.
Dosovitskiy, A. (2020). An image is worth 16x16 words:
Transformers for image recognition at scale. arXiv
preprint arXiv:2010.11929.
Ernst, C. M. and Buddle, C. M. (2015). Drivers and patterns
of ground-dwelling beetle biodiversity across northern
canada. PLoS One, 10(4):e0122163.
VISAPP 2025 - 20th International Conference on Computer Vision Theory and Applications
940

Fluck, I. E., Baiser, B., Wolcheski, R., Chinniah, I., and
Record, S. (2024). 2018 neon ethanol-preserved
ground beetles.
Gibb, H., Johansson, T., Stenbacka, F., and Hj
¨
alt
´
en, J.
(2013). Functional roles affect diversity-succession
relationships for boreal beetles. PLoS One,
8(8):e72764.
Girshick, R. (2015). Fast r-cnn. arXiv preprint
arXiv:1504.08083.
Girshick, R., Donahue, J., Darrell, T., and Malik, J. (2014).
Rich feature hierarchies for accurate object detec-
tion and semantic segmentation. In Proceedings of
the IEEE conference on computer vision and pattern
recognition, pages 580–587.
Goczał, J. (2023). Captain america without the shield: ely-
tra loss and the evolution of alternative defence strate-
gies in beetles. Zoomorphology, 142(2):131–136.
Goczał, J. and Beutel, R. G. (2023). Beetle elytra: evolu-
tion, modifications and biological functions. Biology
Letters, 19(3):20220559.
He, K., Zhang, X., Ren, S., and Sun, J. (2016). Deep resid-
ual learning for image recognition. In Proceedings of
the IEEE conference on computer vision and pattern
recognition, pages 770–778.
Howard, A., Sandler, M., Chu, G., Chen, L.-C., Chen, B.,
Tan, M., Wang, W., Zhu, Y., Pang, R., Vasudevan, V.,
et al. (2019). Searching for mobilenetv3. In Pro-
ceedings of the IEEE/CVF international conference
on computer vision, pages 1314–1324.
Jun, K. (2023). Is vehicle plate corner prediction by vision
transformer better than cnns? Scientific Programming,
2023(1):4301632.
Kirillov, A., Mintun, E., Ravi, N., Mao, H., Rolland, C.,
Gustafson, L., Xiao, T., Whitehead, S., Berg, A. C.,
Lo, W.-Y., et al. (2023). Segment anything. In Pro-
ceedings of the IEEE/CVF International Conference
on Computer Vision, pages 4015–4026.
Krizhevsky, A., Sutskever, I., and Hinton, G. E. (2012). Im-
agenet classification with deep convolutional neural
networks. Advances in neural information processing
systems, 25.
Langhans, S. D. and Tockner, K. (2014). Edge effects are
important in supporting beetle biodiversity in a gravel-
bed river floodplain. PloS one, 9(12):e114415.
Law, H. and Deng, J. (2018). Cornernet: Detecting objects
as paired keypoints. In Proceedings of the European
conference on computer vision (ECCV), pages 734–
750.
Le, V.-L., Beurton-Aimar, M., Zemmari, A., Marie, A.,
and Parisey, N. (2020). Automated landmarking for
insects morphometric analysis using deep neural net-
works. Ecological Informatics, 60:101175.
LeCun, Y., Bottou, L., Bengio, Y., and Haffner, P. (1998).
Gradient-based learning applied to document recogni-
tion. Proceedings of the IEEE, 86(11):2278–2324.
Lin, T.-Y., Maire, M., Belongie, S., Hays, J., Perona, P.,
Ramanan, D., Doll
´
ar, P., and Zitnick, C. L. (2014).
Microsoft coco: Common objects in context. In Com-
puter Vision–ECCV 2014: 13th European Confer-
ence, Zurich, Switzerland, September 6-12, 2014, Pro-
ceedings, Part V 13, pages 740–755. Springer.
Litjens, G., Kooi, T., Bejnordi, B. E., Setio, A. A. A.,
Ciompi, F., Ghafoorian, M., Van Der Laak, J. A.,
Van Ginneken, B., and S
´
anchez, C. I. (2017). A survey
on deep learning in medical image analysis. Medical
image analysis, 42:60–88.
Liu, Z., Lin, Y., Cao, Y., Hu, H., Wei, Y., Zhang, Z., Lin,
S., and Guo, B. (2021). Swin transformer: Hierar-
chical vision transformer using shifted windows. In
Proceedings of the IEEE/CVF international confer-
ence on computer vision, pages 10012–10022.
Ramirez, M. and Campolongo, E. G. (2024). 2018 NEON
Ethanol-preserved Ground Beetles Processing.
Redmon, J. (2016). You only look once: Unified, real-time
object detection. In Proceedings of the IEEE confer-
ence on computer vision and pattern recognition.
Reis, D., Kupec, J., Hong, J., and Daoudi, A. (2023).
Real-time flying object detection with yolov8. arXiv
preprint arXiv:2305.09972.
Ren, S., He, K., Girshick, R., and Sun, J. (2016). Faster
r-cnn: Towards real-time object detection with re-
gion proposal networks. IEEE transactions on pattern
analysis and machine intelligence, 39(6):1137–1149.
Schroff, F., Kalenichenko, D., and Philbin, J. (2015).
Facenet: A unified embedding for face recognition
and clustering. In Proceedings of the IEEE conference
on computer vision and pattern recognition, pages
815–823.
Simonyan, K. and Zisserman, A. (2014). Very deep con-
volutional networks for large-scale image recognition.
arXiv preprint arXiv:1409.1556.
Szegedy, C., Liu, W., Jia, Y., Sermanet, P., Reed, S.,
Anguelov, D., Erhan, D., Vanhoucke, V., and Rabi-
novich, A. (2015). Going deeper with convolutions.
In Proceedings of the IEEE conference on computer
vision and pattern recognition, pages 1–9.
Taigman, Y., Yang, M., Ranzato, M., and Wolf, L. (2014).
Deepface: Closing the gap to human-level perfor-
mance in face verification. In Proceedings of the IEEE
conference on computer vision and pattern recogni-
tion, pages 1701–1708.
Tan, M. and Le, Q. (2021). Efficientnetv2: Smaller mod-
els and faster training. In International conference on
machine learning, pages 10096–10106. PMLR.
Yoo, H. and Jun, K. (2020). Deep homography for license
plate detection. Information, 11(4):221.
Yoo, H. and Jun, K. (2021). Deep corner prediction to rec-
tify tilted license plate images. Multimedia Systems,
27(4):779–786.
Zhao, X., Yu, Y., Clapham, M. E., Yan, E., Chen, J., Jarzem-
bowski, E. A., Zhao, X., and Wang, B. (2021). Early
evolution of beetles regulated by the end-permian de-
forestation. Elife, 10:e72692.
Efficient CNN-Based System for Automated Beetle Elytra Coordinates Prediction
941
