
Vision-Language Models for E-commerce: Detecting Non-Compliant
Product Images in Online Catalogs
Maciej Niemir
a
, Dominika Grajewska
b
and Bartłomiej Nito
´
n
c
Łukasiewicz Research Network, Poznan Institute of Technology, Poznan, 6 Ewarysta Estkowskiego St., Poznan, Poland
Keywords:
Vision-Language Models, Product Image Validation, Image Quality, Product Data Validation, Automated
Validation, Image Classification, Digital Catalog, Product Data Quality, Data Consistency, Online Retail,
Data Management.
Abstract:
This study explores the use of vision-language models (VLMs) for automated validation of product images in
e-commerce, aiming to ensure visual consistency and accuracy without the need for extensive data annotation
and specialized training. We evaluated two VLMs, LLaVA and Moondream2, to determine their effective-
ness in classifying images based on suitability for online display, focusing on aspects such as visibility and
representational clarity. Each model was tested with varying textual prompts to assess the impact of query
phrasing on predictive accuracy. Moondream2 outperformed LLaVA in both precision and processing speed,
making it a more practical solution for large-scale e-Commerce applications. Its high specificity and negative
predictive value (NPV) highlight its effectiveness in identifying non-compliant images. Our results suggest
that VLMs like Moondream2 provide a viable approach to visual validation in e-Commerce, offering benefits
in scalability and implementation efficiency, particularly where a rapid and reliable assessment of product
imagery is critical. This research demonstrates the potential of VLMs as effective alternatives to traditional
image validation methods, underscoring their role in enhancing the quality of the digital catalog.
1 INTRODUCTION
In today’s digital era, the global e-commerce market
is experiencing rapid expansion, making the exchange
of digital information an essential component of mod-
ern trade. Scholars and industry professionals alike
recognize that maintaining high quality data is a key
challenge for organizations, and poor data quality can
have potentially significant negative effects on busi-
ness operations (Wang and Strong, 1996; Ballou et al.,
2004; Haug et al., 2011). Quality of product data
refers primarily to attributes such as accuracy, com-
pleteness, timeliness, and consistency of information
in online catalogs (Wang and Strong, 1996). Ensur-
ing data quality has become a critical determinant of
success or failure for many enterprises, directly in-
fluencing the efficiency of business transactions (Cao
and Zhang, 2011; Hole et al., 2018).
Product images play one of the most important
roles in ensuring high-quality product data in e-
a
https://orcid.org/0000-0002-1054-4285
b
https://orcid.org/0009-0000-1234-6728
c
https://orcid.org/0000-0003-3306-7650
commerce. Since consumers cannot physically ex-
amine products, they rely heavily on the images pro-
vided, making these visuals a crucial factor in the
decision-making process. However, image quality
issues, such as the use of logos instead of prod-
uct images or product images placed against inap-
propriate backgrounds, can severely undermine cus-
tomer satisfaction and trust, leading to lost sales and
tarnished reputations (Di et al., 2014; Qalati et al.,
2021). Poor image management can also increase
operational costs (Appelbaum et al., 2017; Biryukov,
2020), while the lack of automated solutions to man-
age this process has become increasingly problematic
(Russom, 2011).
The advent of vision language models (VLMs),
such as Moondream2 and LLaVA, offers promis-
ing new tools to address these issues by automating
the detection of inappropriate product images in e-
Commerce platforms. These models are capable of
interpreting both visual and textual prompts, enabling
them to identify instances where product images do
not meet predefined standards. For example, VLMs
can be trained to detect whether an image contains
a company logo instead of the actual product, or if
1116
Niemir, M., Grajewska, D. and Nito
´
n, B.
Vision-Language Models for E-commerce: Detecting Non-Compliant Product Images in Online Catalogs.
DOI: 10.5220/0013265000003890
In Proceedings of the 17th International Conference on Agents and Artificial Intelligence (ICAART 2025) - Volume 3, pages 1116-1123
ISBN: 978-989-758-737-5; ISSN: 2184-433X
Copyright © 2025 by Paper published under CC license (CC BY-NC-ND 4.0)

the product is depicted against a background that de-
viates from the commonly accepted white or neutral
backdrop.
This paper explores the potential of using VLMs
to enhance the quality of product data by ensur-
ing visual consistency across e-commerce platforms.
Specifically, it investigates the capabilities of Moon-
dream2
1
and LLaVA (Liu et al., 2023) to detect and
classify non-compliant images, addressing challenges
related to manual data entry and the maintenance of
image quality across various online marketplaces. Us-
ing AI-driven solutions, this research aims to pro-
pose a scalable approach to improving product data
quality, contributing to the broader goal of optimizing
e-commerce platforms for both businesses and con-
sumers.
We begin by presenting an overview of the current
landscape of e-commerce and the critical role of data
quality in product imagery validation. In the Method-
ology section, we outline our approach to evaluat-
ing two specific VLMs, detailing the model setup,
prompt design, and evaluation metrics used to mea-
sure performance. The Experiments and Results sec-
tion discusses the practical tests conducted with each
model on various prompts, providing a detailed com-
parison based on accuracy, precision, and processing
efficiency. Finally, in the Conclusion, we summarize
our findings, discuss the implications of VLMs in e-
Commerce validation, and propose directions for fu-
ture research aimed at enhancing image compliance
accuracy in large-scale online catalogs.
2 RELATED WORK
Recent research emphasizes the critical role of high-
quality product images in e-Commerce, especially as
visual consistency and precision become essential to
foster consumer trust and engagement. Niemir and
Mrugalska (2022) observe that, unlike physical stores,
e-commerce relies on images to convey product at-
tributes, necessitating standards for clarity, resolution,
and object visibility across all product categories.
Muszy
´
nski et al. (2022) highlight the importance of
data quality in high-safety industries such as food and
cosmetics, advocating for the use of artificial intelli-
gence in validating both visual and textual attributes.
Their work underscores the need for automated solu-
tions that not only categorize images but also ensure
visual compliance with established e-commerce stan-
dards, suggesting that automated validation and AI
support can significantly enhance industry standards,
1
https://www.moondream.ai/
such as the Global Data Model, while also facilitating
large-scale data management.
Michalski (2020) examines consumer perception,
demonstrating how the shapes of digital packaging
influence purchase intent. The study indicates that
ergonomic, standard packaging shapes increase cus-
tomer preference, underscoring the need for visually
appealing and consistent presentations to foster posi-
tive shopping experiences. These findings align with
the need for automated quality checks to effectively
manage visual presentation in extensive product cata-
logs.
Ouni et al. (2022) introduced a method of se-
mantic image quality assessment based on Convolu-
tional Neural Networks (CNN) to analyze product im-
ages within the e-commerce context. Their approach,
based on perceptual models, detects common visual
issues, such as poor lighting, color distortions, and
low sharpness, without the need for a reference im-
age. This method, known as Semantic Image Qual-
ity Assessment (SIQA), enables a detailed analysis
of features such as naturalness, readability, and color
consistency—critical to the visual quality of online
products. SIQA focuses primarily on perceptual im-
age quality rather than on verifying conformity with
product-specific category data.
Szymkowski and Niemir (2024) investigated the
use of CNNs and Visual Transformers (VTs) in au-
tomatic classification of products according to GS1
GPC codes, indirectly assessing the degree to which
an image’s depicted object aligns with the expected
category.
While these studies provide valuable insights, a
universal and comprehensive solution for image qual-
ity assessment in e-commerce—encompassing vari-
ous quality issues and offering guidance on the types
of errors encountered—remains lacking. Vision lan-
guage models (VLM), such as those described by
Zhang et al. (2024), have significant potential to fill
this gap. These models employ contrastive learning
to pair images with textual descriptions, enabling pre-
cise categorization even in novel product contexts.
Although current VLM implementations are primar-
ily focused on categorization rather than on detailed
quality control tailored to specific e-commerce stan-
dards, our research demonstrates their potential ap-
plication as image validators.
Vision-Language Models for E-commerce: Detecting Non-Compliant Product Images in Online Catalogs
1117

3 METHODOLOGY
3.1 Our Approach
In response to the limitations of existing Vision-
Language Models (VLMs) that are primarily opti-
mized for categorization rather than comprehensive
quality control, our research takes a more generalized
approach. Rather than relying on highly specific crite-
ria tied to e-commerce standards, we explore the util-
ity of Moondream2 and LLaVA in a flexible valida-
tion framework, focusing on whether an image could
reasonably represent a product suitable for an online
marketplace.
Moondream2 and LLaVA each contribute unique
strengths to this general approach. Moondream2 ex-
cels in object recognition and classification, making it
well-suited for straightforward validation tasks where
accurate identification of a product in the image is es-
sential. LLaVA, meanwhile, provides contextual de-
scriptions and interpretative feedback, supporting sce-
narios where qualitative judgment is needed to deter-
mine if an image’s composition aligns with typical e-
commerce product photos.
In our experiments, we focused on broad prompts
that ask each model to identify whether the content
in a given image could plausibly be used as a prod-
uct image. It is important to emphasize that the in-
put to the models consisted solely of product images
and predefined textual prompts. No additional meta-
data, such as product names or attributes, were uti-
lized during the evaluation. This approach empha-
sizes generalizability and flexibility, enabling us to
evaluate whether an image depicts a product in a way
that aligns with the expectations for online retail with-
out strictly adhering to platform-specific quality stan-
dards.
For our evaluation, we developed and tested sev-
eral dozen prompts for both models. From this set,
we selected six prompts—three for Moondream2 and
three for LLaVA—designed to assess the models’
ability to provide basic yet meaningful information
about image suitability. This approach allowed us to
analyze their effectiveness in general product image
validation. A detailed description of these prompts
and the corresponding results is presented in Section
5, where we evaluate each model’s potential to facil-
itate a generalized, adaptive approach to image val-
idation in e-Commerce. We acknowledge that the
selected prompts are not identical for both models;
however, they were chosen to best reflect the objec-
tive function. The aim was not to compare the models
based on identical prompts but to evaluate their ef-
fectiveness in the process of image validation. This
approach allowed us to focus on the practical utility
of each model in addressing validation tasks.
3.2 Setup
To simulate the computing power available to a
medium-sized company that does not necessarily spe-
cialize in providing AI solutions, we assumed that
the maximum computing power we could use in our
experiments was two NVIDIA GeForce RTX 3090
graphics cards.
The Moondream2 and LLaVA:34b-v1.6 models
were inferenced directly after downloading from the
HuggingFace
2
server. Furthermore, it is important to
note that the LLaVA model was used in the quan-
tized Q4 version, balancing performance with preci-
sion (Gholami et al., 2022).
3.3 Evaluation Method
To evaluate our models, we used standard metrics
such as accuracy, precision, recall, and F1 (Powers,
2011). Accuracy allowed us to measure the overall
correctness of classification, indicating the percent-
age of cases where the model correctly identified both
suitable and unsuitable images. Precision referred to
the proportion of images classified by the model as
suitable that genuinely met quality requirements—the
higher the precision, the fewer cases where the model
incorrectly identified low-quality images as suitable.
Recall expressed the model’s ability to correctly iden-
tify all images that were indeed suitable—a higher
recall indicated that the model rarely missed images
meeting quality criteria. The F1 score combined pre-
cision and recall, enabling us to assess the models in
a more balanced manner, particularly when these two
metrics varied.
To further assess the models’ performance in de-
tecting unsuitable images, we incorporated specificity
and Negative Predictive Value (NVP). Specificity
(Altman and Bland, 1994a) measured the model’s
ability to correctly reject images that were indeed un-
suitable - the higher the specificity, the more effec-
tively the model identified low-quality images. Neg-
ative Predictive Value (NVP) (Altman and Bland,
1994b) indicated the percentage of images classified
as unsuitable that truly did not meet quality standards;
a higher NVP denoted greater confidence that images
labeled as unsuitable indeed failed to meet the crite-
ria.
Our primary objective was to achieve the highest
possible precision, with acceptable levels of NVP and
2
https://huggingface.co/
ICAART 2025 - 17th International Conference on Agents and Artificial Intelligence
1118

specificity. This approach minimized the number of
false positive classifications of low-quality images as
suitable, while simultaneously reducing the risk of in-
correctly rejecting suitable images.
4 DATASETS
The test dataset was sourced from a product catalog
created by the producers of these items (over 60,000
companies). The catalog covers a wide range of prod-
uct categories available online. The data entry process
in the catalog is not centrally supervised, leading to
various types of errors stemming from lack of knowl-
edge or random mistakes, making it an ideal source
for testing data improvement capabilities. Among
the analyzed categories were food products, clothing,
automotive items, consumer electronics, DIY equip-
ment, household chemicals, medical supplies, sta-
tionery, handicrafts, and furniture. From the avail-
able 1.2 million images, a preliminary filtering pro-
cess was applied to ensure they met essential techni-
cal standards, including appropriate size, background
brightness, and background uniformity. Additional
criteria involved assessing the proportion of back-
ground coverage in the image. This was determined
by analyzing the ratio of the product object to the
overall image area. Images where the background oc-
cupied more than 80% of the total area were excluded.
These measures aimed to eliminate images with ex-
cessive background dominance or insufficient focus
on the product, resulting in a more consistent set of
images that better aligned with the visual standards in
e-commerce. Subsequently, using a perceptual hash
algorithm, images significantly different from each
other were randomly selected.
Manual annotation of image accuracy was con-
ducted by a trained annotator with experience in e-
commerce product data validation. The annotator fol-
lowed standardized guidelines, including detailed ex-
amples of correct and incorrect product images, to
ensure consistency and reliability across evaluations.
Ambiguous cases were evaluated through consulta-
tion to minimize potential biases. The criteria used
for annotation included factors such as readability of
information, visibility of the main product object, ap-
propriate presentation form, and background neutral-
ity (Niemir and Mrugalska, 2022).
A total of 1,663 unique images were annotated
and assigned to random product categories. Among
them, 174 images were assessed as incorrect and
1,489 as correct. The assessment process focused on
eliminating images that deviated significantly from
online product presentation standards, such as miss-
ing images, substitute packaging (e.g., box graphics),
company logos instead of actual product images, out-
door photos, product presentation suggestions, or la-
bels. Notably, the analysis excluded verifying the
consistency of the product name and category with
its visualization in the image, as the objective was to
conduct a general evaluation of image quality.
During the analysis, certain product categories
whose specific presentation style hindered effective
verification based on the packaging form were nec-
essary to be excluded. In particular, this applied to
categories where the image depicted the product with
a dominant pattern or texture element, which often led
to incorrect interpretation by the model. Problematic
categories included:
• Books, magazines, CDs, DVDs, vinyl records -
images are usually only accompanied by covers or
labels, making it difficult to assess the full presen-
tation of the product.
• Wall coverings, carpets – images focused on tex-
tures or patterns, preventing the identification of
the entire product.
• Decorative magnets, stickers, paintings,
posters – products were often presented on
surfaces or in contexts that could confuse the
models.
• Live plants – photos often taken outdoors did not
meet the standard requirements for presentation
on a neutral background.
• Services – images related to services, such as lo-
gos or graphic elements, did not meet the typical
criteria for physical products.
These categories required different visual analysis
strategies to avoid classification errors and improve
the accuracy of evaluating image suitability in the
e-commerce context; therefore, they were excluded
from the study. For apparel products, several presen-
tation methods are commonly accepted in online re-
tail. Clothing can be displayed against a white back-
ground, as is typical for other products, hung on a
hanger, or shown on a person, similar to images in
advertising brochures of marketplaces. This practice
is generally permitted as long as the image focuses
on the product, ensuring that the presentation empha-
sizes the clothing item without distracting elements.
However, some e-commerce platforms enforce addi-
tional restrictions on specific clothing categories, par-
ticularly children’s apparel. These restrictions may
include limitations on the use of human models or
stricter requirements for presentation neutrality. As
a result, including apparel products in the validation
pipeline necessitates additional verification steps to
Vision-Language Models for E-commerce: Detecting Non-Compliant Product Images in Online Catalogs
1119

ensure compliance with platform-specific standards.
This becomes especially relevant when contextually
validating the chosen form of presentation. Neverthe-
less, this study employed a simplified validation ap-
proach, prioritizing general usability criteria without
addressing these more detailed considerations.
5 EXPERIMENTS AND RESULTS
The evaluation focused on the capabilities of two AI
vision-language models (VLMs), LLaVA and Moon-
dream2, in classifying product images for their suit-
ability in e-commerce applications. Each model was
tested with three distinct text prompts to examine how
variations in query phrasing influence model predic-
tions. The list of prompts is as follows:
• LLaVA - prompt 1 (llava 1): Can it be a photo for
online sales? The product packaging picture does
not have to be detailed. It is important that the
product or its packaging is visible. The composi-
tion of the product does not have to be visible, the
photo does not have to be sharp. Return answer
in JSON format: {’answer’: [YES/NO], ’expla-
nation’: string}
• LLaVA - prompt 2 (llava 2): Is it a product
on a photo? Return answer in JSON format:
{’answer’: [YES/NO], ’explanation’: string}
• LLaVA - prompt 3 (llava 3): Verify whether a
buyer will understand what they are purchasing
based on the provided product name, considering
the following assumptions: 1. The buyer is a na-
tive Polish speaker. 2. During the shopping pro-
cess, the buyer only sees the product name. 3. The
buyer shops at a store within a specific industry, so
they are familiar with industry-specific terms and
phrases. 4. The product name may include brand
names and manufacturer codes. 5. The product
does not necessarily need to have description on
it. Return answer in JSON format: {’answer’:
[YES/NO], ’explanation’: string}
• Moondream2 - prompt 1 (moondream 1): Does
the photo show the product? Answer yes or no.
• Moondream2 - prompt 2 (moondream 2): Is it a
photo that shows a product for online sales? An-
swer yes or no.
• Moondream2 - prompt 3 (moondream 3):Can
provided image be a an image for an online auc-
tion? Answer yes or no.
For both models, the input consisted exclusively
of a product image and a corresponding predefined
textual query. No metadata, such as product names
or descriptive attributes, were included in the experi-
ments. This approach ensured that the evaluation fo-
cused solely on the models’ ability to process visual
and prompt-based inputs without additional contex-
tual information. The Moondream2 model required
a two-step query process: first, to obtain a ”yes” or
”no” answer, and second, to provide an explanation
if the initial response was ”no”, due to limitations in
handling both response types within a single prompt.
A comprehensive comparison of key metrics such as
accuracy, precision, and recall is presented in Table 1.
Table 1: Performance metrics for different prompts. Own
work.
Model Accuracy Precision Recall F-1
llava 1 0.90 0.90 0.99 0.94
llava 2 0.54 0.91 0.53 0.67
llava 3 0.23 0.93 0.15 0.26
moon 1 0.92 0.95 0.97 0.96
moon 2 0.75 0.92 0.79 0.85
moon 3 0.50 0.92 0.49 0.64
The best prompt for each model was selected
based on a combination of accuracy and F1 score, as
these metrics provide a balanced view of the model’s
capability to correctly classify suitable images while
minimizing both false positives and false negatives.
In this table, the results indicate that Moon-
dream2 achieved consistently higher accuracy and F1
scores compared to LLaVA, particularly with prompt
”moon 1,” which yielded an accuracy of 0.92 and an
F1 score of 0.96. This prompt demonstrated Moon-
dream2’s strength in maintaining a high level of pre-
cision (0.95) and recall (0.97), making it the most ef-
fective prompt for this model. For LLaVA, ”llava 1”
was identified as the best prompt, with an accuracy of
0.90 and an F1 score of 0.94, showing strong recall
(0.99) and balanced precision (0.90).
By selecting the prompt with the highest com-
bined accuracy and F1 score for each model, we es-
tablished a basis for more in-depth analysis. The sub-
sequent evaluation, which included NPV and speci-
ficity metrics, further refined our understanding of
each model’s ability to correctly reject non-compliant
images, as detailed in Table 2. and represented in the
confusion matrices in Figures 1 and 2.
The confusion matrices presented above illustrate
the performance of the LLaVA and Moondream2
models in classifying product images for e-commerce
suitability, with the best-performing prompt for each
model. In these matrices, the ”True” labels represent
the actual classifications (1 for suitable and 0 for un-
suitable images), while the ”Predicted” labels show
the model’s classification outcomes.
ICAART 2025 - 17th International Conference on Agents and Artificial Intelligence
1120
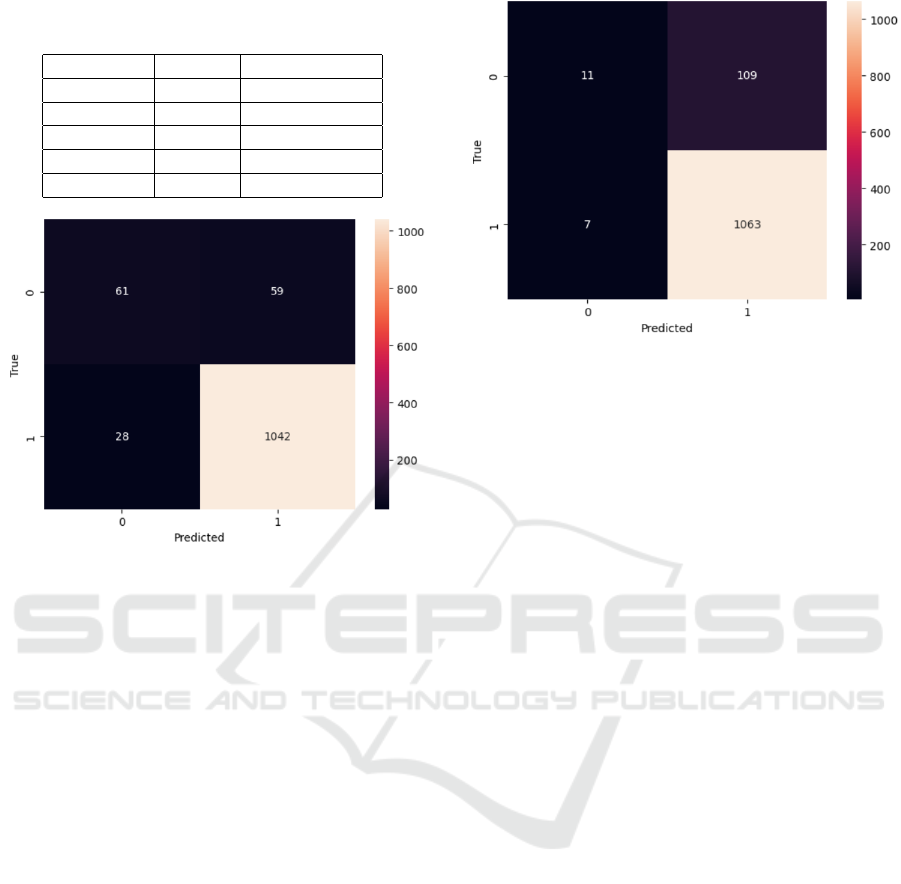
Table 2: Performance metrics for different models. Own
work.
LLaVA MoonDream2
Accuracy 89.84% 93.87%
Precision 90.34% 95.06%
Recall 99.26% 98.25%
NPV 59.26% 79.03%
Specificity 9.20% 56.32%
Figure 1: Confusion matrix for the MoonDream2 model
and the best-performing prompt (Prompt 1). Own work.
In the confusion matrix of the LLaVA model,
we observe relatively high false positives, where un-
suitable images are classified as suitable. Mean-
while, Moondream2 demonstrates a better balance,
with fewer false positives and a higher true negative
count, reflecting better specificity and Negative Pre-
dictive Value (NPV).
A critical aspect of data validation is the ability
to provide a clear explanation of why an image has
been flagged as non-compliant. Both models eval-
uated in this study — Moondream2 and LLaVA —
are capable of generating comprehensive assessments
of the images, explaining the reasons for their suit-
ability or unsuitability for e-commerce use. Table
3 presents examples of such responses generated by
the Moondream2 model. Due to space limitations in
this publication, we have included only the responses
from Moondream2. LLaVA’s evaluations were sub-
stantively similar in content but tended to be more de-
tailed and linguistically refined.
Each entry in the Table 3 includes an image and
a brief explanation generated by the model, clarify-
ing why the image may not meet e-commerce stan-
dards. For example, the first image shows a sym-
bolic graphic rather than an actual product, which
Moondream2 notes as lacking the necessary detail
to represent a sellable item. Similarly, other exam-
ples highlight issues such as inadequate color repre-
Figure 2: Confusion matrix for the LLaVa model and the
best-performing prompt (Prompt 1). Own work.
sentation, absence of the product itself, or an overly
distracting background. These explanations demon-
strate Moondream2’s ability to provide nuanced as-
sessments, focusing on factors such as visibility, color
accuracy, and background relevance, which are essen-
tial for high-quality product representation in online
catalogs.
In addition to examining the models’ capabilities
for data validation, we evaluated the response time
of each model by calculating the average process-
ing time for 1,000 samples. For scalable solutions
managing large product catalogs, processing speed is
critical, especially in a dynamic e-commerce environ-
ment.
Table 4 presents the average response times for
both models, with Moondream2 achieving a signifi-
cantly faster processing time of 0.34 seconds per im-
age compared to LLaVA’s 3.37 seconds. This dis-
parity in response times highlights Moondream2’s
efficiency, making it better suited for large-scale e-
commerce applications where rapid processing of ex-
tensive product catalogs is necessary to maintain op-
erational effectiveness and user experience.
6 CONCLUSIONS
The results of the conducted study demonstrated that
Vision-Language Models (VLMs) can serve as effec-
tive tools for supporting additional validation of prod-
uct images in terms of their suitability. This repre-
sents an innovative approach that has not been achiev-
able with traditional validation methods. Notably,
these models do not require fine-tuning to achieve
satisfactory results, which significantly reduces costs
and implementation time. Another advantage lies
in the universality of image validation, meaning that
Vision-Language Models for E-commerce: Detecting Non-Compliant Product Images in Online Catalogs
1121
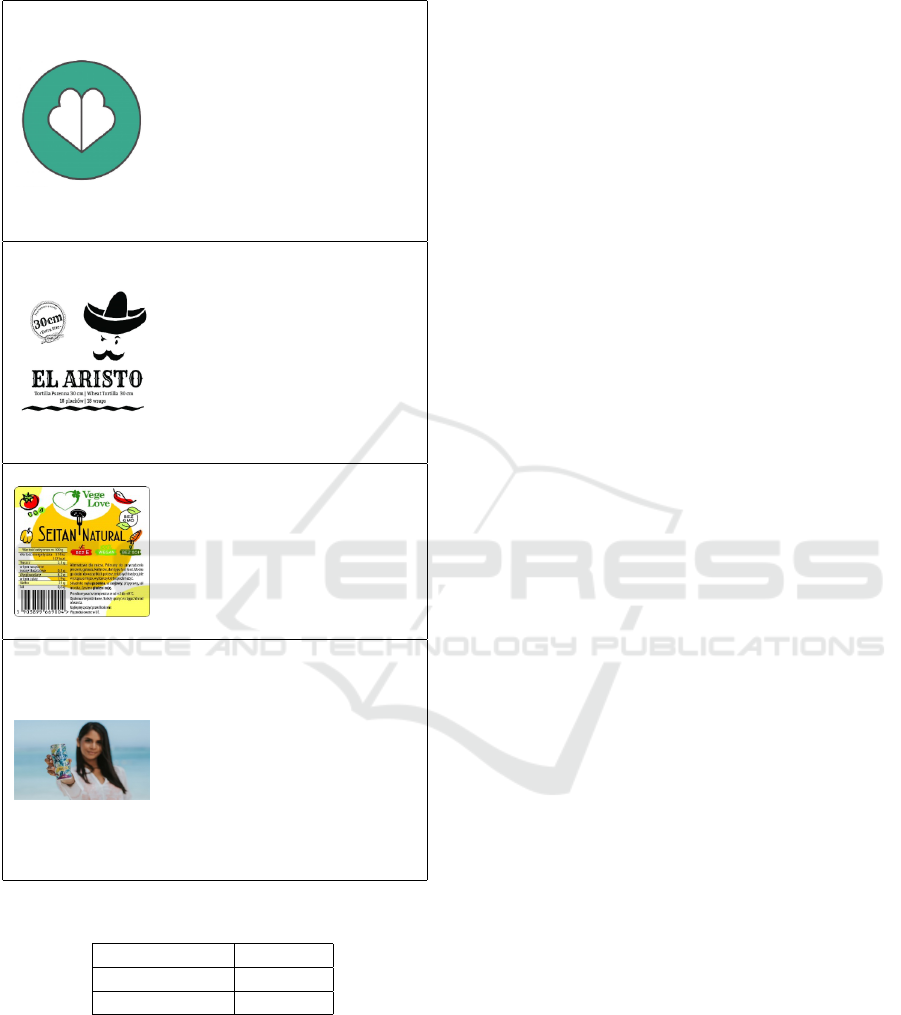
Table 3: Descriptions generated by the Moondream2 model.
Own work.
The photo does not showcase the
product, but rather a minimalist
symbol – a green circle with a
white heart in the center, sym-
bolizing love, care, and affection.
The absence of additional details
allows the focus to be on the sym-
bolic meaning of the heart, often
used in marketing materials and
visual communication.
The image does not effectively
depict the product as it is in black
and white, making it difficult to
convey colors and details accu-
rately. In this case, the tortilla
and wheat tortilla are key ele-
ments, and a color photograph
would better represent their ap-
pearance.
The photo does not depict the
product, as it only shows its label,
focusing on information about in-
gredients, nutritional values, and
key characteristics. The lack of an
actual image of the product means
it is not visible in the photo.
The product is not visible in
the image because the woman is
holding it in front of her face,
making her and her actions the
main focus of the picture. The
background, which shows the
ocean, adds an aesthetic value to
the image, but it is not essen-
tial for showcasing the product,
which is the KABISA tea.
Table 4: Performance time for different models. Own work.
Model Avg time
LLaVA 3,37 s
MoonDream2 0,34 s
building a validator does not necessitate referencing
specific products within particular categories.
Although the primary goal of this study was not to
benchmark the models, the results further indicated
that the smaller Moondream2 model outperformed
LLaVA in both validation accuracy and operational
efficiency. Moondream2 achieved higher scores in
key metrics, such as NPV and specificity, highlighting
its greater effectiveness in identifying non-compliant
product images for this task. Despite LLaVA’s ad-
vanced language capabilities and ability to generate
detailed descriptions, it proved less efficient in tasks
focused on visual validation in the e-commerce con-
text. The findings thus indicate that employing large
multimodal models is not necessary to achieve satis-
factory results. Moreover, the analysis conducted on
a dedicated infrastructure showed that Moondream2
processes queries more than ten times faster than its
larger counterpart, making it a more efficient solution
for large product catalogs.
6.1 Future Work
This study did not incorporate metadata, such as prod-
uct names, unit counts, packaging types, and other
attributes, which could enable significantly more de-
tailed validation of image content. In future research,
we plan to integrate such data, allowing for the val-
idation of consistency between attributes and more
precise visual assessment of image compliance with
requirements.
Further efforts will also focus on expanding the
variety of prompts tailored to specific product cate-
gories. A comprehensive query system is planned,
where appropriate prompts will be assigned to in-
dividual nodes or branches of a product category
graph. This approach could significantly enhance
validation effectiveness, particularly for product cat-
egories with specific graphical presentation require-
ments (e.g., clothing, media with covers, wall cov-
erings, magnets, stickers, posters, graphics, pho-
tographs, services, live plants).
Another direction of development involves divid-
ing image validation into separate problem categories.
Individual validation stages could include analyzing
background quality (uniformity, brightness, and the
ratio of the background to the area occupied by the
product), detecting the presence of company logos
only, verifying the number of products in an image,
and assessing proper product presentation, especially
in the clothing category.
Additionally, we consider incorporating alterna-
tive models such as BLIP, CLIP, and GPT to com-
pare their effectiveness through benchmarking. We
also plan to develop a dedicated multimodal model
specialized in product data validation, including eval-
uating the accuracy of product images. This solu-
tion could leverage methods and mechanisms used in
training the LLaVA model, allowing for a tailored ap-
proach to the specific requirements of e-commerce.
ICAART 2025 - 17th International Conference on Agents and Artificial Intelligence
1122

6.2 Limitations
The conducted research highlights the promising po-
tential of Vision-Language Models (VLMs) for au-
tomating image validation in e-commerce. However,
certain limitations of this approach should be ac-
knowledged.
One limitation is the accuracy of the validation it-
self, which is not error-free. Consequently, the valida-
tor may work well as a module for suggesting qual-
ity improvements and flagging image defects for cat-
alog administrators, but its use for definitively reject-
ing defective images requires detailed testing before
implementation in a specific catalog. Similarly, any
update to the model version in a production environ-
ment should also be preceded by prior research, as
results may vary.
Additionally, VLMs have significant computa-
tional requirements, which may pose a barrier for
smaller enterprises. Further extensions of these mod-
els to accommodate industry-specific requirements
could negatively affect their performance unless they
are optimized for computational load and infrastruc-
ture accessibility.
REFERENCES
Altman, D. G. and Bland, J. M. (1994a). Statistics notes:
Diagnostic tests 1: sensitivity and specificity. BMJ,
308(6943):1552.
Altman, D. G. and Bland, J. M. (1994b). Statistics notes:
Diagnostic tests 2: predictive values. BMJ, 309:102.
Appelbaum, D., Kogan, A., Vasarhelyi, M., and Yan,
Z. (2017). Impact of business analytics and enter-
prise systems on managerial accounting. Interna-
tional Journal of Accounting Information Systems,
25:29–44.
Ballou, D. P., Madnick, S. E., and Wang, R. Y. (2004). Spe-
cial section: Assuring information quality. J. Manag.
Inf. Syst., 20:9–11.
Biryukov, A. (2020). Data quality as a service. Journal Of
Applied Informatics, 15:120–132.
Cao, M. and Zhang, Q. (2011). Supply chain collabo-
ration: Impact on collaborative advantage and firm
performance. Journal of operations management,
29(3):163–180.
Di, W., Sundaresan, N., Piramuthu, R., and Bhardwaj, A.
(2014). Is a picture really worth a thousand words?
- on the role of images in e-commerce. In Proceed-
ings of the 7th ACM international conference on Web
search and data mining, WSDM ’14, page 633–642,
New York, NY, USA. Association for Computing Ma-
chinery.
Gholami, A., Kim, S., Dong, Z., Yao, Z., Mahoney, M. W.,
and Keutzer, K. (2022). A Survey of Quantiza-
tion Methods for Efficient Neural Network Inference,
pages 291–326. Chapman and Hall/CRC.
Haug, A., Zachariassen, F., and Van Liempd, D. (2011).
The costs of poor data quality. Journal of Industrial
Engineering and Management, page 168–193.
Hole, Y., Pawar, S., and Bhaskar, M. P. (2018). Service
marketing and quality strategies. Periodicals of Engi-
neering and Natural Sciences (PEN), 6(1):182–196.
Liu, H., Li, C., Wu, Q., and Lee, Y. J. (2023). Visual in-
struction tuning. ArXiv, abs/2304.08485.
Michalski, R. (2020). The role of virtual package shapes in
digital product presentation. In Rebelo, F. and Soares,
M., editors, Advances in Ergonomics in Design, page
24–30, Cham. Springer International Publishing.
Muszy
´
nski, K., Niemir, M., and Skwarek, S. (2022).
Searching for ai solutions to improve the quality of
master data affecting consumer safety. In Business
Logistics in Modern Management, page 121–140, Os-
ijek, Croatia. Faculty of Economics in Osijek.
Niemir, M. and Mrugalska, B. (2022). Product data quality
in e-commerce: Key success factors and challenges.
In Production Management and Process Control.
Ouni, S., Kamoun, K., and AlAttas, M. (2022). Se-
mantic Image Quality Assessment Using Conventional
Neural Network for E-Commerce Catalogue Manage-
ment, page 89–113. Springer International Publishing,
Cham.
Powers, D. M. W. (2011). Evaluation: from precision, recall
and f-measure to roc, informedness, markedness and
correlation. ArXiv, abs/2010.16061.
Qalati, S. A., Vela, E. G., Li, W., Dakhan, S. A., Hong Thuy,
T. T., and Merani, S. H. (2021). Effects of perceived
service quality, website quality, and reputation on pur-
chase intention: The mediating and moderating roles
of trust and perceived risk in online shopping. Cogent
Business & Management, 8(1):1869363.
Russom, P. (2011). Big data analytics. TDWI best practices
report, fourth quarter, 19(4):1–34.
Szymkowski, M. and Niemir, M. (2024). Convolutional
neural networks and vision transformers in product
gs1 gpc brick code recognition. In Sheng, B., Bi,
L., Kim, J., Magnenat-Thalmann, N., and Thalmann,
D., editors, Advances in Computer Graphics, Lecture
Notes in Computer Science, page 440–450, Cham.
Springer Nature Switzerland.
Wang, R. Y. and Strong, D. (1996). Beyond accuracy: What
data quality means to data consumers. Journal of
Management Information Systems, 12(4):5–33.
Zhang, J., Huang, J., Jin, S., and Lu, S. (2024).
Vision-language models for vision tasks: A survey.
arXiv:2304.00685.
Vision-Language Models for E-commerce: Detecting Non-Compliant Product Images in Online Catalogs
1123
