
Effects of Class Imbalance in Unsupervised Human Activity Recognition
for Office Work Task Characterization
Sara Santos, Phillip Probst
a
, Lu
´
ıs Silva
b
and Hugo Gamboa
c
LIBPhys (Laboratory for Instrumentation, Biomedical Engineering and Radiation Physics),
NOVA School of Science and Technology, NOVA University of Lisbon, Caparica, Portugal
{slm.santos, p.probst}@campus.fct.unl.pt, {lmd.silva, h.gamboa}@fct.unl.pt
Keywords:
Unsupervised Learning, Human Activity Recognition, Data Imbalance, Occupational Health.
Abstract:
Office workers spend most of their time sitting, often with rigid postures, for prolonged periods of time. This
has been recognized by the European Union as a risk factor for work-related musculoskeletal disorders. To
study work activities and their distribution over time, Human Activity Recognition (HAR) techniques need
to be implemented. Since supervised learning techniques require labeled data and large datasets for training,
unsupervised learning is a viable alternative for HAR. However, these models may be affected by the highly
imbalanced distribution of activities typically observed in office workers. Considering this, this work studied
the impact of data imbalance on clustering performance when the dataset is comprised of 33 %, 50 %, 70 %,
and 90 % of sitting activity. Office activities were collected from 19 subjects and three traditional cluster-
ing models were employed. KMeans and Gaussian Mixture Model were more affected than Agglomerative
Clustering, which seems to be more robust to data imbalance. With 90 % of sitting time, all three models
performed poorly, which emphasizes the need for clustering models that can handle highly imbalanced data.
1 INTRODUCTION
Since the early 2000s, the number of people employed
in computer-based office work has been steadily in-
creasing across the European Union (EU). Specifi-
cally, from 2000 to 2015, the percentage of work-
ers who spent at least a quarter of their workday do-
ing computer work increased from 47 % to 58 %
(European Agency for Safety and Health at Work
et al., 2019). Office work predominantly consists of
low variance activities such as sitting for long pe-
riods of time, often with rigid postures (Zerguine
et al., 2023), (European Agency for Safety and Health
at Work et al., 2017), (Srinivasan and Mathiassen,
2012). This has been linked to musculoskeletal pain,
particularly in the lower back, neck, shoulders, and
knees (Owen et al., 2020). Additionally, office work-
ers are often confronted with high job demands,
while being limited by low job resources (Bakker
and de Vries, 2021). A combination of these factors
contributes to the development of work-related mus-
culoskeletal disorders (WRMDs), stress, depression,
and anxiety-related problems, which are a significant
a
https://orcid.org/0000-0003-3239-9813
b
https://orcid.org/0000-0001-9811-0571
c
https://orcid.org/0000-0002-4022-7424
health concern for 7.4 % of European workers (Eu-
ropean Agency for Safety and Health at Work et al.,
2017). WRMDs are associated with loss of produc-
tivity and increased absenteeism, resulting in medi-
cal burden and increased economic costs for organi-
zations (European Agency for Safety and Health at
Work et al., 2019), (Punnett and Wegman, 2004). This
problem has been recognized by the EU, which is ac-
tively funding initiatives under the 2021-2024 Hori-
zon Europe program, particularly within Cluster 1, to
promote healthier living and working environments
(European Commission and Directorate-General for
Research and Innovation, 2021). Implementing more
active work practices that reduce sitting time and en-
courage more walking and standing, is crucial for oc-
cupational health and has shown positive health out-
comes (Owen et al., 2020), (Park et al., 2020).
To address some of the above-mentioned issues,
the PrevOccupAI (Prevention of Occupational Disor-
ders in Public Administrations based on Artificial In-
telligence) was carried out with the objective of eval-
uating occupational risk factors for WRMDs in of-
fice workers (Oliosi et al., 2023). Biosignals were
acquired with the purpose of studying workers’ pos-
tures during their workday. As subjects were not ob-
served during work, the resulting dataset is unlabeled.
988
Santos, S., Probst, P., Silva, L. and Gamboa, H.
Effects of Class Imbalance in Unsupervised Human Activity Recognition for Office Work Task Characterization.
DOI: 10.5220/0013266300003911
Paper published under CC license (CC BY-NC-ND 4.0)
In Proceedings of the 18th International Joint Conference on Biomedical Engineering Systems and Technologies (BIOSTEC 2025) - Volume 1, pages 988-995
ISBN: 978-989-758-731-3; ISSN: 2184-4305
Proceedings Copyright © 2025 by SCITEPRESS – Science and Technology Publications, Lda.

While PrevOccupAI focused on postural information,
the dataset also allows for the study of human activ-
ities and their distribution over time, using Human
Activity Recognition (HAR) techniques. Supervised
learning is often preferred for HAR, since classifi-
cation techniques usually produce state-of-the-art re-
sults. However, unsupervised learning has been in-
creasingly explored as an alternative, since training
supervised learning models requires large amounts of
data and label annotation, which is costly and time-
consuming (Ige and Mohd Noor, 2022).
As mentioned above, office work is highly imbal-
anced with regards to the activities performed. Al-
though sitting, standing, and walking, are commonly
studied activities in the literature (Ige and Mohd
Noor, 2022), the datasets used for model training
are usually balanced, since supervised learning re-
quires it. However, if dealing with completely un-
labeled data, it can not be assumed that classes are
balanced, as there is no information about them. This
data imbalance must be taken into consideration when
employing unsupervised learning models for HAR.
Therefore, the impact of data imbalance on clustering
performance should be studied.
2 RELATED WORK
HAR is a prominent research area, due to advances
in sensor technology and increased computational
power (Jobanputra et al., 2019). Basic activities
are the most common activities studied, which typ-
ically involve low-variability movements with clear
and repetitive patterns (Dentamaro et al., 2024). The
studies by Machado et al. (Machado. et al., 2014) and
Kwon et al. (Kwon et al., 2014) focus on lab-collected
basic activities like standing, sitting, walking, run-
ning, and lying down. Machado et al. used data
from eight subjects collected via a waist-mounted tri-
axial accelerometer (ACC), while Kwon et al. col-
lected tri-axial ACC and gyroscope (GYR) data from
a single subject using a smartphone in a trouser front
pocket. Publicly available datasets such as UCI-HAR
(Anguita et al., 2013a), HHAR (Stisen et al., 2015),
and MHEALTH (Banos et al., 2014) also focus on
basic activities. UCI-HAR includes data from 30
subjects performing six activities (standing, sitting,
lying down, walking, and climbing stairs) using a
waist-mounted smartphone with ACC and GYR sen-
sors. HHAR features the same activities as UCI-
HAR, with addition of biking and running, performed
by nine subjects, using ACC and GYR sensors from
eight smartphones placed on the waist and four smart-
watches on the wrists. MHEALTH includes similar
activities with additional movements like waist bend-
ing, crouching, and arm raises, performed by ten sub-
jects, using ACC, GYR, and magnetometer (MAG)
sensors on the chest, wrist, and ankle (Banos et al.,
2014).
The above-mentioned datasets were utilized for
unsupervised HAR. In (Machado. et al., 2014), mul-
tiple statistical, temporal, and spectral features were
extracted from the sensor data and used for cluster-
ing. KMeans was applied, achieving 99.3 % Adjusted
Rand Index (ARI) in a subject-specific approach,
and 88.6 % in a subject-independent approach. In
(Kwon et al., 2014), the mean and standard devia-
tion (SD) were extracted from the time and frequency
domains of the sensor data for clustering. When the
number of clusters (k) is known, KMeans, Gaussian
Mixture Model (GMM), and Agglomerative Cluster-
ing (AGG), achieving ARIs of 72.0 %, 100 %, and
80.0 %, respectively. To simulate an unknown k,
values between two and 50 were tested. The high-
est accuracy obtained with KMeans and AGG was
close to 80.0 %, while GMM maintained 100 %. DB-
SCAN was also employed in this scenario, reaching a
90.0 % ARI. Similar experimental setups were used in
(Mejia-Ricart et al., 2017) an additional smartwatch
and pedometer readings were incorporated. The clus-
tering models used included KMeans, Spectral Clus-
tering, AGG (average and Ward linkage), DBSCAN,
and Mean Shift. KMeans was the best-performing
model, followed by AGG with Ward’s method and
Spectral Clustering. No clustering metrics were pro-
vided in this study.
The works mentioned above achieve high per-
formance in clustering basic activities using tradi-
tional models. However, the data used, whether lab-
collected or publicly available, is balanced, meaning
all activities have the same duration. Since this bal-
anced scenario doesn’t reflect real-world office en-
vironments, traditional clustering models should be
tested on data where some activities have longer du-
rations than others.
3 METHODS
The following sections present the proposed frame-
work for studying the effects of data imbalance in un-
supervised HAR within office environments. It begins
with the description of the labeled dataset, which con-
sists of office tasks performed by 19 subjects. Next,
the signal pre-processing and feature extraction meth-
ods are outlined, followed by the explanation of the
selected unsupervised models and feature selection
approach. Finally, the imbalanced datasets are cre-
Effects of Class Imbalance in Unsupervised Human Activity Recognition for Office Work Task Characterization
989

Figure 1: Sensor placement adapted from (Oliosi et al., 2023).
ated, with the sitting activity comprising 33 % (bal-
anced), 50 %, 70 %, and 90 % of the dataset, to as-
sess the impact of data imbalance on clustering per-
formance
1
.
3.1 Experimental Setup and Placement
A labeled dataset comprised of office work activities
was collected to study the impact of data imbalance
on clustering models. The acquisitions were con-
ducted in an office environment with a group of 19
healthy volunteers, comprising 14 women and 6 men,
aged between 19 and 54 years (age: 26.0 ± 8.3 years).
The purpose of the study and the acquisition proto-
col were thoroughly explained to the participants, and
each were provided with an informed consent form.
The same setup as the PrevOccupAI project was uti-
lized which was approved by the Universidade Nova
de Lisboa Ethics Committee and conducted in accor-
dance with the Declaration of Helsinki (Oliosi et al.,
2023).
The sensors used and correspondent placement, as
shown in Figure 1, include a Xiaomi Redmi Note 9
smartphone on the subject’s chest, an OPPO 41 mm
smartwatch on the non-dominant wrist, and two mus-
cleBANs (PLUX Wireless Biosignals) on the left and
right Trapezius. The smartphone and the smartwatch
run the Android operating system and were used to
acquire tri-axial ACC, GYR, and MAG data. ACC
and GYR were acquired at 100 Hz and MAG at 50 Hz
(restricted by the operating system). The muscle-
BAN contains an EMG sensor and a tri-axial ACC
and MAG, acquiring at 1000 Hz. The muscleBAN
was placed in accordance with the SENIAM guide-
lines (Hermens et al., 2000).
1
The presented work is available on GitHub: https://gi
thub.com/SaraLMS/Unsupervised-HAR-Models-for-Cha
racterizing-Office-Tasks.
3.2 Acquisition Protocol
At the start of each acquisition, subjects stood straight
with arms parallel to the body, followed by ten short,
vertical jumps, to allow for synchronising the sig-
nals from the different devices. A total of 15, 20,
and 30 minutes were acquired for sub-activities that
can be associated with sitting, walking, and stand-
ing, respectively. To facilitate the data acquisitions,
sub-activities more similar in nature were performed
within the same recording with ten-second stop se-
quences (with a jump in the middle for standing ac-
tivities) in between, except for the sitting acquisition,
which was done continuously. Thus, five acquisition
sessions were devised. The first session involved sub-
jects walking at their slow, medium, and fast speeds,
with five minutes per speed (15 minutes total). The
second session included stair climbing, alternating
between going up and down for four segments of one
minute and 15 seconds each (five minutes total). The
third session involved two tasks with a duration of
seven minutes and 30 seconds each (totaling 15 min-
utes) using a tall cabinet: preparing and drinking tea
or coffee and organizing items within the cabinet. The
fourth session consisted of standing still and standing
while conversing for seven minutes and 30 seconds
each (15 minutes total). The fifth session involved
sitting at a desk and working on a computer for 15
minutes.
3.3 Signal Pre-Processing
Given that the focus of this work is on the impact
of data imbalance on the clustering, only the sim-
plest scenario, comprising only smartphone sensors
and three sub-activities, will be used. The selected
sub-activities are standing still, walking at a medium
speed, and sitting, as they represent the most basic
forms of standing, walking, and sitting. The pre-
processing steps for the ACC, GYR, and MAG sig-
nals from the smartphone are as follows: resampling
BIOSIGNALS 2025 - 18th International Conference on Bio-inspired Systems and Signal Processing
990

and alignment of the signals, task segmentation, and
filtering.
3.3.1 Alignment and Resampling
The Android operating system is not optimized for
continuous data acquisition, leading to issues like
variable sampling rates and sensors not starting or
stopping simultaneously. To address this, signals
were cropped based on the timestamp of the last
sensor to start and the first to stop acquiring data.
Additionally, to ensure uniform sampling for the
smartphone and smartwatch sensors (ACC, GYR,
and MAG), signals were up-sampled to 100 Hz us-
ing quadratic interpolation, ensuring consistent data
across all sensors within the same device.
3.3.2 Task Segmentation
An onset-based segmentation approach was em-
ployed to extract the walking at a medium speed from
the recording containing the walking patterns. First,
the absolute value of the signal was computed, fol-
lowed by the application of a root-mean-square filter
with a window length of 100 samples to obtain the
signal’s envelope. The signal was then binarized, set-
ting values above 0.01 m/s
2
to one and values below
to zero. The first order discrete difference was calcu-
lated to identify the start points (where the difference
is one) and stop points (where the difference is mi-
nus one). These values were subsequently validated
to remove any incorrect detections, primarily caused
by the synchronisation jumps.
To extract the standing still activity from the
recording that also contains standing while convers-
ing, and to isolate the sitting activity, a peak-based
segmentation approach was developed. The findpeaks
function from SciPy was applied with a peak height
of 7 m/s
2
and a minimum distance of 15 000 sam-
ples for standing still, conversing, and sitting, and
40 000 samples for the other standing sub-activities.
Due to subject-to-subject differences in jumping ve-
locity, the above-mentioned threshold were slightly
adapted for some subjects. This function detected the
peaks from the synchronization jumps and the jumps
in the middle of the stop segments. Since these peaks
are roughly centered within the ten-second stop seg-
ments, the start and stop points were set five seconds
before and after each peak. For the first peak, which
pertains to the synchronisation jumps, the start was set
to 15 seconds after the peak. For the sitting activity,
where there were no separation segments, this method
was used solely to remove synchronisation jumps.
3.3.3 Filtering
After extracting sitting, walking medium, and stand-
ing still from the remaining activities, these signals
were filtered to prepare it for feature extraction. The
filtering pipeline designed by (Anguita et al., 2013b)
was used for the smartphone’s ACC, GYR, and MAG
signals. Since human activities are mostly of low
frequency, a median filter with a window length of
eleven samples was applied, followed by a Butter-
worth low-pass filter with a cutoff frequency of 20 Hz.
To isolate the gravitational component, another But-
terworth low-pass filter with a 0.3 Hz cutoff frequency
was applied. This component was then subtracted
from the signal.
3.4 Unsupervised Models
To study the impact of class imbalance on the ARI,
three traditional clustering models were selected:
KMeans, AGG Ward’s linkage, and GMM. These
models are commonly used for HAR and allow for
the specification of the number of clusters, which was
set to three, as the objective is to cluster the three dif-
ferent activities.
KMeans is the most widely used clustering model.
The KMeans algorithm works in two steps: first,
data points are assigned to the closest cluster cen-
ter based on a distance metric, usually euclidean dis-
tance. Next, the cluster centers are updated by com-
puting the mean of the data points within each clus-
ter, shifting the centers to the new average position
(Badillo et al., 2020). The GMM algorithm assumes
that all data points are generated by a mixture of a fi-
nite number of Gaussian distributions, each with its
own mean and covariance matrix (Biernacki et al.,
2000). This model allows for oval-shaped clusters
that may be more robust than KMeans, which as-
sumes only spherical clusters. The AGG algorithm
starts by treating each data point as its own clus-
ter (Aghabozorgi et al., 2015) and with each itera-
tion, pairs of close clusters are merged (Kaufman and
Rousseeuw, 1990), based on the chosen linkage crite-
rion. AGG may handle imbalanced data to some ex-
tent, as it is not constrained by specific cluster shapes
or centroids.
3.5 Feature Engineering
In a completely unsupervised scenario, it is not possi-
ble to optimize a feature set for each subject. There-
fore, a common feature set for all subjects must be
obtained to cluster the three activities. For this, a two-
stage feature selection method was implemented. The
Effects of Class Imbalance in Unsupervised Human Activity Recognition for Office Work Task Characterization
991

first stage involved finding the best feature sets for
each subject. The second stage comprised of identi-
fying the most common features across all subjects to
obtain the final feature set. These feature sets were
then used to cluster each subject individually.
The TSFEL package (version 0.1.7) (Barandas
et al., 2020) was used for feature extraction. Different
window sizes were tested, but it was experimentally
found that 1.5 seconds, approximately one walking
cycle, with 50 % overlap performed the best. In the
time domain, the following statistical features were
extracted: maximum, minimum, mean, median, vari-
ance, SD, and Interquartile range. From the frequency
domain, the median frequency, spectral centroid, and
spectral entropy were also obtained.
The initial step in this feature selection process
involves normalization (between zero and one) and
elimination of features with low variance and high
correlation. The variance and correlation thresholds
were set to 5 % and 99 %, respectively. The re-
maining features underwent a forward feature selec-
tion approach. Features were initially shuffled and
then added iteratively to a sub-dataset that was then
passed to the model for clustering. If the addition of
a feature did not improve the ARI, it was removed.
This procedure was repeated ten times to account for
the randomness introduced by the shuffling, thereby
ensuring that various combinations of features were
tested. From the subject-specific feature sets, the n
most common features across all subjects were se-
lected to form a final feature set. Figure 2 illus-
trates the two-stage feature selection process for find-
ing the three most common features (orange, yellow,
and green) across all subjects. To determine the most
suitable number of features for the final feature set,
values of n = 4, 5, 6, 7, 8 were tested. For the particu-
lar scenario of the three basic sub-activities with only
smartphone sensors, the best feature sets obtained
were as follows: for KMeans — xMAG maximum,
yACC interquartile range, zMAG maximum, xACC
minimum, yACC minimum; for AGG — yACC max-
imum, zACC interquartile range, zMAG maximum,
yMAG maximum; and for GMM — xMAG max-
Figure 2: Second step of the two-stage feature selection
scheme.
imum, yACC maximum, zMAG maximum, yACC
minimum, and yGYR standard deviation.
3.6 Creation of Imbalanced Datasets
For the data imbalance experiment, four scenarios
were tested, with sitting comprising 33 % (balanced
dataset), 50 %, 70 %, and 90 % of the dataset. Fig-
ure 3 illustrates the process of creating the imbalanced
datasets. In the balanced case, all instances of sit-
ting, standing still, and walking medium speed are in-
cluded, resulting in a single dataset. For imbalanced
scenarios, all available sitting instances were used,
with standing and walking instances added to achieve
final sitting proportions of 50 %, 70 %, and 90 %. The
standing and walking classes then represented 25 %,
15 %, and 5 % of the imbalanced dataset, respectively.
Since only a portion of the total instances is included,
multiple chunks of the original standing and walking
instances were selected, in order to test all available
data. The size of each chunk (CS) and the step size be-
tween consecutive chunks (SS) is defined as follows:
CS =
a
b
− a
2
(1)
SS =
a −CS
n − 1
(2)
Where a is the number of sitting instances, b is the
sitting proportion (0.5, 0.7 or 0.9), and n is the num-
ber of chunks. The number of chunks was determined
based on the percentage of the sitting class and the
chunk size, ensuring overlap between the chunks. At
50 % of sitting, four chunks were used, therefore cov-
ering the entire walking and standing instances with
overlap. As the sitting proportion increased, the re-
quired number of chunks also increased, with seven
chunks at 70 % and 20 chunks at 90 %. For each im-
balanced scenario, the clustering results for each sub-
ject is the mean ARI over all chunks. The final results
correspond to the mean ARI over all subjects.
4 RESULTS
The influence of data imbalance on the ARI for the
three clustering models is shown in Figure 4. In this
plot, the points were slightly displaced horizontally to
facilitate the analysis of the error bars of each model.
Both KMeans and GMM show lower performance on
imbalanced datasets. With a balanced dataset, these
models reach 92.5 % and 89.9 % mean ARI, respec-
tively. Compared to the balanced scenario, at 50 % of
sitting activity, KMeans and GMM dropped 39.6 %
and 39.0 %, and at 70 % dropped 25.4 % and 25.1 %,
respectively. At 90 % of sitting, KMeans achieved
63.8 % and GMM reached 62.9 %. AGG behaved
BIOSIGNALS 2025 - 18th International Conference on Bio-inspired Systems and Signal Processing
992
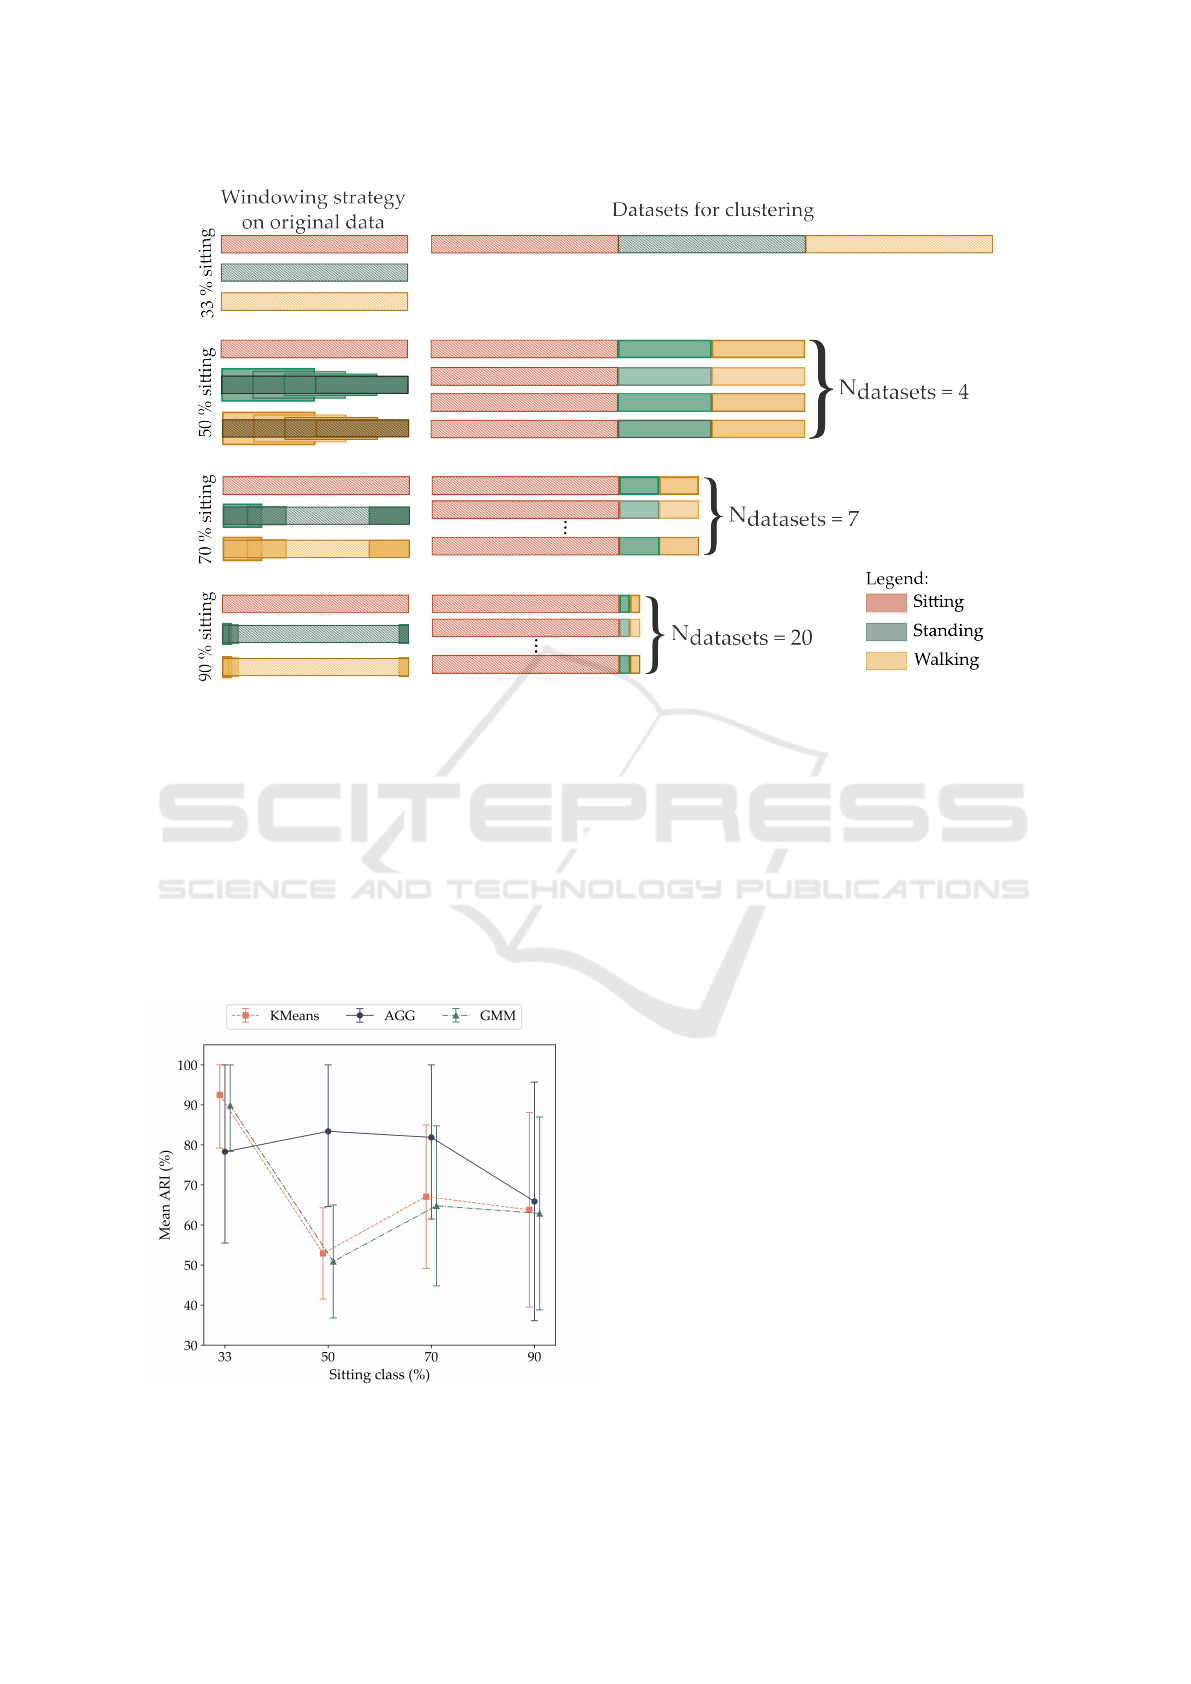
Figure 3: Representation of the imbalanced datasets. For balanced classes, only one dataset is needed to include all available
instances. When the sitting class comprises 50 % of the dataset, four different chunks of standing and walking were used. At
70 % sitting, seven chunks were used, and at 90 %, 20 chunks.
differently, starting with 78.3 % mean ARI with a
balanced dataset and increasing 5.1 % and 3.6 % at
50 % and 70 % of sitting class, respectively. Similar
to the previous two models, at 90 %, AGG obtained
65.9 % mean ARI. The SDs for each clustering model
are generally high, with the highest being 29.8 % for
AGG at 90 % sitting class and the lowest at 11.4 %
for KMeans at 50 % sitting class. When the sitting
class reaches 90 %, SDs are particularly high, with
Figure 4: Influence of data imbalance on the performance
of KMeans, AGG, and GMM.
values of 24.3 %, 29.8 %, and 24.1 % for KMeans,
AGG, and GMM, respectively. Overall, the SD tends
to increase with a higher class imbalance.
5 DISCUSSION
As seen from the results in Figure 4, overall, the
datasets with imbalanced classes perform worse than
the balanced datasets, with performance decreasing
as the imbalance increases. However, there are no-
table exceptions. AGG shows an improvement in ARI
when the dataset consists of 50 % sitting class, while
KMeans and GMM improve from 50 % to 70 % sit-
ting class. This can be attributed to the fact that,
to achieve the remaining proportions for the stand-
ing still and walking medium, majority of these in-
stances are removed. As described previously, this
was done in subsets, meaning that different portions
of the standing still and walking medium clusters
were tested. If some of these instances were origi-
nally (with a balanced dataset) overlapping in the fea-
ture space, by removing them, it can actually enhance
clustering results. Nevertheless, this improvement is
limited. With increasing imbalance, the sitting cluster
becomes dominant in terms of size and amount of data
points. When imbalance reaches 90 % sitting class,
some underrepresented instances, if close to it, may
be incorrectly assigned to the larger sitting cluster.
Effects of Class Imbalance in Unsupervised Human Activity Recognition for Office Work Task Characterization
993

AGG tends to be more robust to data imbalance than
KMeans and GMM. This robustness probably arises
since AGG does not assume specific cluster shapes or
rely on centroids, making it more flexible in identi-
fying smaller, irregularly shaped clusters that can ap-
pear when samples are removed to create the imbal-
anced datasets. However, at 90 % imbalance, the three
clustering models obtain a similar ARI, showing that,
with higher imbalance, the advantages of linkage di-
minish.
The results also show high SDs for the three clus-
tering models. This happens not only on the imbal-
anced datasets, but also in the balanced scenario. This
could be due to subjects showing different behaviours
even when performing basic activities such as sitting,
standing still, and walking at a medium speed. More
static subjects are probably easier to cluster than more
active ones. Active subjects have more variability in
their movements, which can result in a more spread
out feature space and, therefore, overlapping clus-
ters. For these subjects, the imbalanced scenarios can
further emphasize this overlap, resulting in an even
poorer performance. Static subjects with completely
separated clusters can still cluster well with imbal-
anced datasets, as seen from the high SDs despite the
low mean ARI.
This experiment indicates that class imbalance has
a major impact on clustering performance. Thus,
when designing unsupervised HAR systems, class
imbalance has to be considered and models that ro-
bustly handle these imbalances have to be explored.
A potential model that could be explored in the fu-
ture is the recently published Equilibrium KMeans,
which was designed to handle imbalanced data (He,
2024). This adaptation of the traditional KMeans
model introduces a mechanism that repels centroids,
with larger clusters experiencing stronger repulsion.
This approach overcomes the ”uniform effect” of tra-
ditional KMeans, which tends to form clusters of sim-
ilar sizes, even when the input data contains groups of
varying sizes. This could be useful for highly imbal-
anced scenarios such as real-world office work.
6 CONCLUSIONS
Computerized office work is often sedentary, with
workers exhibiting low levels of activity for extended
periods and across consecutive days. This can lead
to workers experiencing WRMDs, stress, depression,
and anxiety-related issues. Since occupation health
is a significant concern for European workers, HAR
techniques can be useful in studying workers’ activ-
ities and their durations. Although HAR is a promi-
nent area of research, studies typically use balanced,
lab-collected, or publicly available datasets to train
machine learning models. However, this approach
does not accurately represent real office environments
where workers spend most of their time sitting rather
than standing or walking. This leads to data imbal-
ance that can affect clustering performance. To study
this, data was collected from 19 subjects perform-
ing nine different office tasks. Standing still, walking
medium speed, and sitting while working on a com-
puter were chosen for this experiment. Four differ-
ent scenarios were tested where the dataset was com-
prised of 33 % (balanced), 50 %, 70 %, and 90 %
of sitting activity. Imbalanced datasets were created
by including all available sitting instances and adjust-
ing the standing and walking instances to achieve the
desired final proportions. To ensure all standing and
walking instances were used, different subsets of the
available instances were applied. Traditional clus-
tering models, including KMeans, AGG, and GMM,
were used to cluster the imbalanced datasets. Results
indicate that all three clustering models are affected
by data imbalance, with an overall decrease in ac-
curacy as imbalance increases. AGG appears to be
more robust to data imbalance, as it does not assume
specific cluster shapes, allowing it greater flexibility
in identifying smaller, irregular-shaped clusters. With
90 % sitting activity, all three models perform poorly,
highlighting the need for clustering models that can
effectively handle highly imbalanced datasets.
ACKNOWLEDGMENTS
This research was partly supported by the Science and
Technology Foundation (FCT) under the project PRE-
VOCUPAI (DSAIPA/AI/0105/2019). P. Probst was
supported by the doctoral grant RT/BD/152843/2021
financed by the Portuguese Foundation for Science
and Technology (FCT), and with funds from State
Budget, under the MIT Portugal Program.
REFERENCES
Aghabozorgi, S., Seyed Shirkhorshidi, A., and Ying Wah,
T. (2015). Time-series clustering – a decade review.
Information Systems, 53:16–38.
Anguita, D., Ghio, A., Oneto, L., Parra, X., and Reyes-
Ortiz, J. L. (2013a). A public domain dataset for hu-
man activity recognition using smartphones. In The
European Symposium on Artificial Neural Networks.
Anguita, D., Ghio, A., Oneto, L., Parra, X., and Reyes-
Ortiz, J. L. (2013b). A public domain dataset
for human activity recognition using smartphones.
BIOSIGNALS 2025 - 18th International Conference on Bio-inspired Systems and Signal Processing
994

In ESANN 2013 proceedings, European Symposium
on Artificial Neural Networks, Computational Intel-
ligence and Machine Learning. Bruges (Belgium).
i6doc.com.
Badillo, S., Banfai, B., Birzele, F., Davydov, I. I., Hutchin-
son, L., Kam-Thong, T., Siebourg-Polster, J., Steiert,
B., and Zhang, J. D. (2020). An introduction to ma-
chine learning. Clinical Pharmacology & Therapeu-
tics, 107(4):871–885.
Bakker, A. B. and de Vries, J. D. (2021). Job de-
mands–resources theory and self-regulation: new ex-
planations and remedies for job burnout. Anxiety,
Stress, & Coping, 34(1):1–21.
Banos, O., Garcia, R., Holgado-Terriza, J. A., Damas, M.,
Pomares, H., Rojas, I., Saez, A., and Villalonga, C.
(2014). mhealthdroid: A novel framework for agile
development of mobile health applications. In Ambi-
ent Assisted Living and Daily Activities, pages 91–98.
Springer International Publishing.
Barandas, M., Folgado, D., Fernandes, L., Santos, S.,
Abreu, M., Bota, P., Liu, H., Schultz, T., and Gam-
boa, H. (2020). Tsfel: Time series feature extraction
library. SoftwareX, 11.
Biernacki, C., Celeux, G., and Govaert, G. (2000). Assess-
ing a mixture model for clustering with the integrated
completed likelihood. IEEE Transactions on Pattern
Analysis and Machine Intelligence, 22(7):719–725.
Dentamaro, V., Gattulli, V., Impedovo, D., and Manca, F.
(2024). Human activity recognition with smartphone-
integrated sensors: A survey. Expert Systems with Ap-
plications, 246.
European Agency for Safety and Health at Work, Kok, J.,
Vroonhof, P., Snijders, J., Roullis, G., Clarke, M.,
Peereboom, K., Dorst, P., and Isusi, I. (2019). Work-
related musculoskeletal disorders – Prevalence, costs
and demographics in the EU. Publications Office.
European Agency for Safety and Health at Work, Zwaan,
L., Oldenburg, C., Emmerik, M., Eekhout, I., Heuvel,
S., Janowsk, P., Dam, L., Oude-Hengel, K., Br
¨
uck,
C., and Wilhelm, C. (2017). Estimating the cost of
work-related accidents and ill-health – An analysis of
European data sources. Publications Office.
European Commission and Directorate-General for Re-
search and Innovation (2021). Horizon Europe strate-
gic plan 2021-2024. Publications Office of the Euro-
pean Union.
He, Y. (2024). Imbalanced data clustering using equilibrium
k-means. arXiv preprint arXiv:2402.14490.
Hermens, H. J., Freriks, B., Disselhorst-Klug, C., and Rau,
G. (2000). Development of recommendations for
semg sensors and sensor placement procedures. Jour-
nal of Electromyography and Kinesiology, 10(5):361–
374.
Ige, A. O. and Mohd Noor, M. H. (2022). A survey on un-
supervised learning for wearable sensor-based activity
recognition. Applied Soft Computing, 127.
Jobanputra, C., Bavishi, J., and Doshi, N. (2019). Human
activity recognition: A survey. Procedia Computer
Science, 155:698–703.
Kaufman, L. and Rousseeuw, P. (1990). Finding Groups in
Data: An Introduction To Cluster Analysis.
Kwon, Y., Kang, K., and Bae, C. (2014). Unsupervised
learning for human activity recognition using smart-
phone sensors. Expert Systems with Applications,
41(14):6067–6074.
Machado., I., Gomes., R., Gamboa., H., and Paix
˜
ao.,
V. (2014). Human activity recognition from triax-
ial accelerometer data - feature extraction and selec-
tion methods for clustering of physical activities. In
Proceedings of the International Conference on Bio-
inspired Systems and Signal Processing (BIOSTEC
2014) - BIOSIGNALS, pages 155–162. INSTICC,
SciTePress.
Mejia-Ricart, L. F., Helling, P., and Olmsted, A. (2017).
Evaluate action primitives for human activity recog-
nition using unsupervised learning approach. In 2017
12th International Conference for Internet Technology
and Secured Transactions (ICITST), pages 186–188.
Oliosi, E., Probst, P., Rodrigues, J., Silva, L., Zagalo, D.,
Cepeda, C., and Gamboa, H. (2023). Week-long mul-
timodal data acquisition of occupational risk factors
in public administration workers. In 2023 19th Inter-
national Conference on Intelligent Environments, IE
2023 - Proceedings. IEEE.
Owen, N., Healy, G. N., Dempsey, P. C., Salmon, J., Tim-
perio, A., Clark, B. K., Goode, A. D., Koorts, H.,
Ridgers, N. D., Hadgraft, N. T., Lambert, G., Eakin,
E. G., Kingwell, B. A., and Dunstan, D. W. (2020).
Sedentary behavior and public health: Integrating the
evidence and identifying potential solutions. Annual
Review of Public Health, 41:265–287.
Park, J., Moon, J., Kim, H., Kong, M., and Oh, Y. (2020).
Sedentary lifestyle: Overview of updated evidence
of potential health risks. Korean Journal of Family
Medicine, 41:365–373.
Punnett, L. and Wegman, D. H. (2004). Work-related mus-
culoskeletal disorders: the epidemiologic evidence
and the debate. Journal of Electromyography and Ki-
nesiology, 14(1):13–23.
Srinivasan, D. and Mathiassen, S. E. (2012). Motor vari-
ability - an important issue in occupational life. In
Work, volume 41, pages 2527–2534.
Stisen, A., Blunck, H., Bhattacharya, S., Prentow, T. S.,
Kjærgaard, M. B., Dey, A., Sonne, T., and Jensen,
M. M. (2015). Smart devices are different: Assess-
ing and mitigatingmobile sensing heterogeneities for
activity recognition. In Proceedings of the 13th ACM
Conference on Embedded Networked Sensor Systems,
page 127–140. Association for Computing Machin-
ery.
Zerguine, H., Healy, G. N., Goode, A. D., Zischke, J., Ab-
bott, A., Gunning, L., and Johnston, V. (2023). On-
line office ergonomics training programs: A scoping
review examining design and user-related outcomes.
Safety Science, 158.
Effects of Class Imbalance in Unsupervised Human Activity Recognition for Office Work Task Characterization
995
