
Unveiling Insights from Hematobiometry Data: A Data Science
Approach Using Data from a Quito Clinical Laboratory
Miguel Ortiz
1
, Pa
´
ul Campa
˜
na
1
, Jhonny Pincay
1,2 a
and Dora Rosero
3
1
Pontificia Universidad Cat
´
olica del Ecuador, Avenida 12 de Octubre 1076 y Roca, Quito, Ecuador
2
Lucerne University of Applied Sciences and Arts, Werftestrasse 4, Lucerne, Switzerland
3
Investigadora Independiente, Laboratorio Cl
´
ınico Pura Vida, Quito, Ecuador
Keywords:
Hematobiometry, Anemia Diagnosis, Decision Tree Learning, Data Science, Data-Driven Healthcare, Clinical
Laboratory Data Analysis.
Abstract:
In this applied research study, a data science approach is employed to analyze anonymized hematological
data obtained from a clinical laboratory located in Quito, Ecuador. The analysis aims to examine machine
learning models that could potentially be used to aid in early anemia and polycythemia detection, ultimately
contributing to improved healthcare decision-making. A rigorous MLOps-driven methodology is employed,
and well-established techniques such as clustering, decision trees, and neural networks are applied. These
methods are evaluated to identify the most suitable approach for the specific characteristics of the data. The
findings showed that clustering methods were not advisable for the type of data used for the exploration and
no significative results could be obtained. However, decision trees and neural networks demonstrated superior
performance in predicting the presence of these blood disorders. Additionally, the outcomes of this research
have the potential to be particularly significant for Ecuador, a nation facing challenges in healthcare access
and malnutrition, where early anemia detection could be highly impactful.
1 INTRODUCTION
Modern medicine stands at the forefront of a rapidly
accelerating transformation, driven by the develop-
ment and deployment of technology-based tools, most
notably artificial intelligence (AI). One area where
this impact is most pronounced is in outpatient care,
specifically in the early diagnosis of diseases and
in the interpretation and analysis of laboratory tests
(Deo, 2015; Ahsan et al., 2022). Besides, informa-
tion technology has enabled healthcare professionals
to gain a more detailed and accurate understanding of
patients’ health, facilitating the diagnosis and moni-
toring of various medical conditions.
In particular, laboratory tests, such as complete
blood counts, have proven essential in understanding
the internal functioning of the human body and de-
tecting disorders (Alsheref and Gomaa, 2019; Gun
ˇ
car
et al., 2018). However, this information can quickly
grow in volume and complexity. On the other hand,
technological advancements have led to increasingly
sophisticated analytical solutions capable of process-
a
https://orcid.org/0000-0003-2045-8820
ing and analyzing large volumes of data efficiently
and systematically. Furthermore, current tools and
techniques enable the storage and processing of these
data, providing invaluable support to medical profes-
sionals in decision-making. This progress not only
optimizes diagnosis but also enhances the monitoring
and treatment of patients.
This initiative aims to investigate the impact of
data analysis and machine learning tools applied to
the results of complete blood count tests. A primary
goal is to support medical staff in diagnostic decision-
making by identifying trends and applying appropri-
ate analytical methodologies. However, the analysis
of data from laboratory tests presents several chal-
lenges. The complexity of blood data, which includes
a wide variety of parameters, can complicate classifi-
cation and interpretation. Additionally, individual pa-
tient variability, influenced by factors such as age and
gender, adds another layer of complexity to the anal-
ysis. These factors highlight the importance of apply-
ing data analytics techniques capable of handling this
diversity and improving diagnostic accuracy.
In this research, the operational databases of a
clinical laboratory located in Quito, Ecuador, were
224
Ortiz, M., Campaña, P., Pincay, J. and Rosero, D.
Unveiling Insights from Hematobiometry Data: A Data Science Approach Using Data from a Quito Clinical Laboratory.
DOI: 10.5220/0013272100003938
In Proceedings of the 11th International Conference on Information and Communication Technologies for Ageing Well and e-Health (ICT4AWE 2025), pages 224-232
ISBN: 978-989-758-743-6; ISSN: 2184-4984
Copyright © 2025 by Paper published under CC license (CC BY-NC-ND 4.0)

analyzed. Data science techniques and MLOps
methodology were applied with two objectives: to
implement data analysis models that are better suited
to the dataset and to provide intelligent information
in diagnosing diseases that can be identified through
blood tests, such as anemia and polycythemia.
The article is structured as follows: Section 2 in-
troduces the concepts and related works that support
this initiative. Next, Section 3 describes the methods
used to design a solution. Section 4 presents the re-
sults of the project implementation. Finally, Section 5
offers a comprehensive analysis of the results, a sum-
mary, and final observations.
2 THEORETICAL BACKGROUND
AND RELATED WORK
This section presents the theories studied and applied
in the development of this project, along with similar
work in the field of hematological data analysis.
2.1 Clustering Algorithms
Clustering models aim to group datasets based on
similar characteristics, dividing the data into distinct
clusters, each defined by the behavior of its features’
values (Kesavaraj and Sukumaran, 2013). Below, we
outline the general principles of several key concepts
and methods applied in this study.
2.1.1 K-Means
The K-Means algorithm is widely used for data clus-
tering. According to (Pascual et al., 2007), its main
idea is to define k centroids representing different
clusters. The process begins by assigning each data
point to the nearest centroid, followed by recalculat-
ing the centroids and redistributing the points. This
cycle repeats until there are no significant changes in
the clusters. The centroids, which can be adjusted
by the user, are crucial for determining the optimal
number of clusters needed for accurate and meaning-
ful classification.
2.1.2 DBSCAN
DBSCAN is a density-based clustering algorithm.
According to (Pascual et al., 2007), it relies on the
concepts of core points, border points, and noise. A
core point is defined as one that has a specified min-
imum number of neighboring points within a defined
radius. The algorithm begins by arbitrarily selecting
a point p. If p is a core point, a cluster is formed by
including all objects that are density-reachable from
p. If p is not a core point, the algorithm moves to
the next object. This process repeats until all objects
have been processed. Points that are not assigned to
any cluster are considered noise, while points that are
neither noise nor core points are designated as border
points.
DBSCAN generates clusters based on point den-
sity, offering significant flexibility in data group-
ing and ensuring thorough, accurate classification by
evaluating all points.
2.2 Classification Algorithms
Classification models are essential for organizing and
analyzing large volumes of information. These mod-
els assign an instance with an unknown class to a
specific class within a predefined set, dividing data
records into distinct classes based on the values and
relationships among variables (Kesavaraj and Suku-
maran, 2013).
Among classification algorithms, decision trees
are widely used. These predictive models are based
on inductive learning from observations and logical
structures, using training data to gradually learn pat-
terns that connect variables (Mart
´
ınez et al., 2009).
Building a decision tree involves iteratively divid-
ing the dataset into smaller subsets. At each step,
the variable that best separates the data into distinct
classes is chosen, using impurity measures such as
entropy or the Gini index. This approach allows the
tree to capture the underlying structure of the data,
facilitating the identification of complex patterns and
relationships.
2.3 Neural Networks
Artificial Neural Networks (ANNs), or simply neu-
ral networks, are inspired by the functioning of the
human brain. They consist of a large number of in-
terconnected neurons that process information (Wang,
2003). Their value lies in their ability to make infer-
ences based on learning from previous data. They are
part of several methods depicted under the concept of
computational intelligence (Pincay, 2022).
Today, neural networks are widely applied to solve
problems such as pattern recognition, image segmen-
tation, and facial recognition, among others.
2.4 Related Work
This section reviews existing research that contributes
to the objectives of this initiative.
Unveiling Insights from Hematobiometry Data: A Data Science Approach Using Data from a Quito Clinical Laboratory
225
In the work of (Meena et al., 2019a) , the authors
investigated childhood anemia and the relationship
between maternal health and diet during pregnancy
with the child’s anemic status. They compared two
techniques—decision trees and association rules—to
determine the most suitable approach and proposed a
model to reduce anemia risk in healthcare. The re-
sults are presented as rules, along with recommenda-
tions for doctors, parents, and governments to reduce
the risk of childhood anemia.
In a similar study (Noor et al., 2019), a non-
invasive method was proposed for detecting anemia
using images of the palpebral conjunctiva. By ana-
lyzing photographs of conjunctival color and applying
decision trees and Support Vector Machine (SVM)
algorithms, a rapid diagnosis was achieved with ap-
proximately 82% accuracy. However, the authors
noted limitations due to the dataset size and empha-
sized the need for more comprehensive testing.
Another initiative with significant findings was
presented by Mena et al. (Meena et al., 2019b). By
comparing decision trees and association rules, the
researchers proposed a model to reduce anemia risk
by identifying influential factors in child nutrition in
India. Factors such as location, state, and gender
were identified as influential in determining anemia
presence in children. Additionally, recommendations
were provided for doctors, parents, and the govern-
ment based on identified rules to help reduce the risk
of childhood anemia.
Other related works include (Schober and Vetter,
2021), (Mansoori et al., 2024), and (Parthvi et al.,
2020); all highlight the importance and feasibility of
applying data mining and data science in supporting
the diagnosis of hematological diseases.
In contrast to these related studies, to our knowl-
edge, no studies in this field have been conducted
in Ecuador that focus on blood test analysis. This
gap underscores the value and contribution of this re-
search initiative.
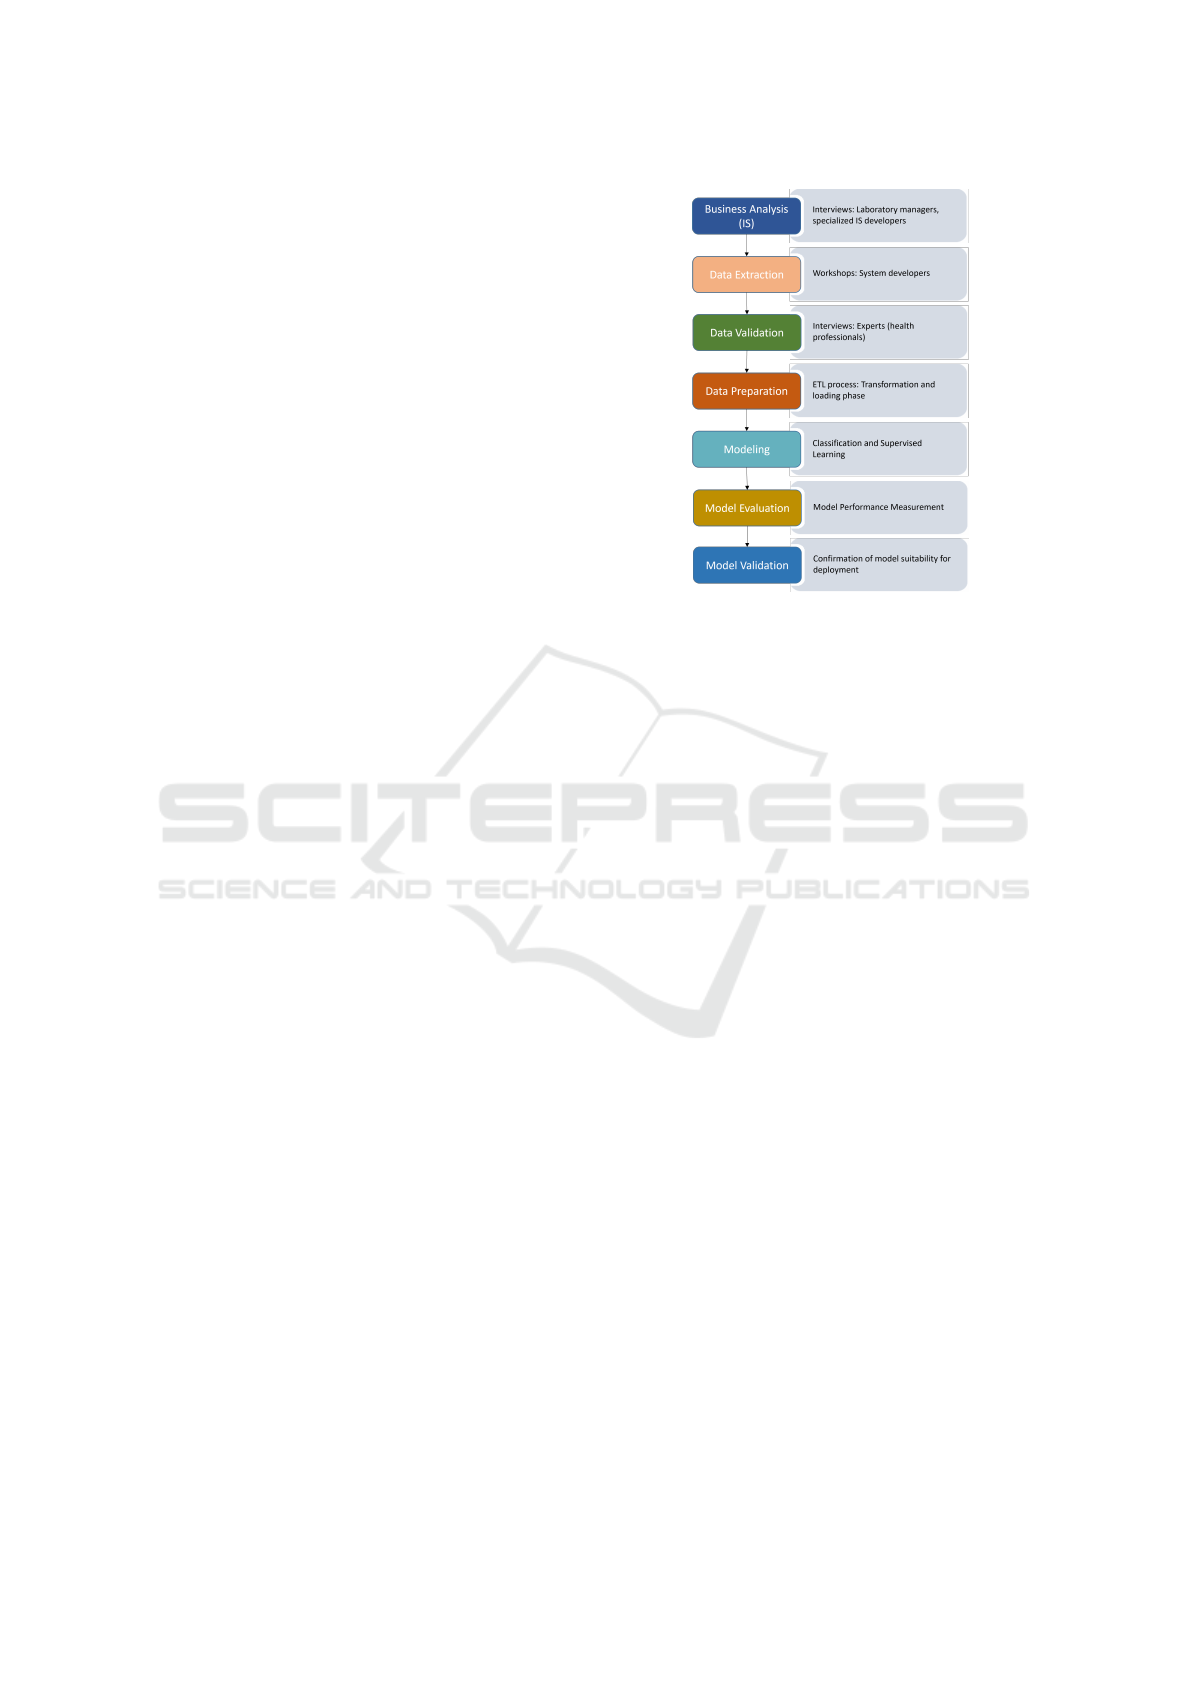
3 METHODOLOGY AND USE
CASE
For this study, the MLOps methodology was em-
ployed (Cloud, 2023). Based on this methodologi-
cal framework, the development of this research pro-
posal considered seven phases: i) business analysis
and assessment of its information system (IS) struc-
ture; ii) data extraction; iii) data validation; iv) data
preparation; v) modeling; vi) model evaluation; and,
for ML-related models, the additional step vii) model
validation. Figure 1 illustrates these phases and their
Figure 1: Depiction of the method followed in this study.
intermediate actions.
The data for this research consists of anonymized
clinical laboratory results from complete blood count
tests. Working with this data requires an understand-
ing of the business rules and the data’s significance,
as well as identifying models that support pattern
recognition and knowledge generation. In this regard,
MLOps proved to be the most suitable methodology
for this research.
3.1 Method
In the business analysis phase, interviews were con-
ducted with personnel responsible for sample pro-
cessing and result recording. During these interviews,
we identified the parameters evaluated in the complete
blood count (CBC) and the tolerance ranges for each
parameter across women, men, and children. Depend-
ing on the equipment, technique, and reagents used by
the clinical laboratory, the CBC test evaluates differ-
ent blood components crucial for diagnosing a variety
of medical conditions.
The objective of this initial phase was to under-
stand the business, its processes, and the context of
CBC testing in a clinical laboratory in Quito. It also
enabled the identification of the data’s complexity,
comprehensiveness, and quality.
In the data extraction phase, anonymized data was
obtained directly from the laboratory’s specialized
system, with assistance from laboratory staff and sys-
tem developers.
During the data validation phase, and based on
interviews and information gathered from health-
care experts, the resulting components or param-
eters from the CBC test were identified for this
ICT4AWE 2025 - 11th International Conference on Information and Communication Technologies for Ageing Well and e-Health
226
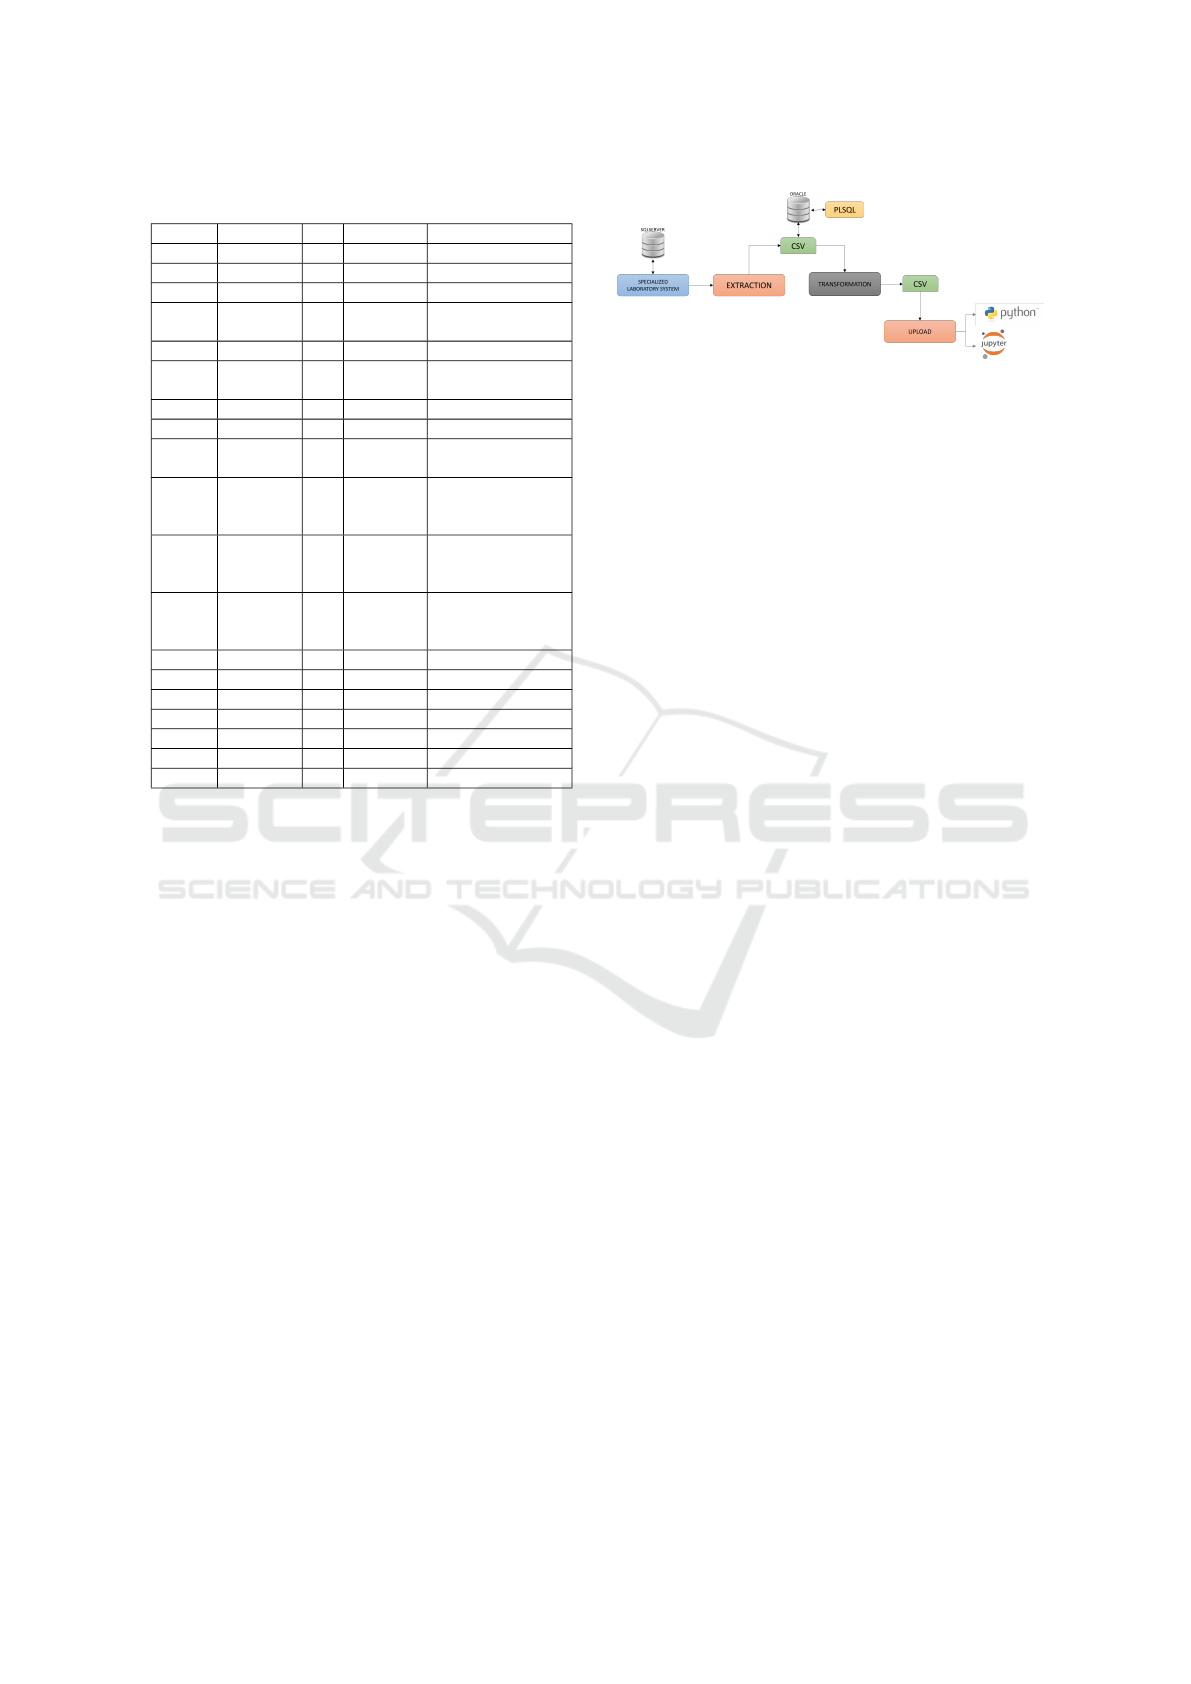
Table 1: Sample of the original data structure.
orderid age (years) sex date result
77871 43 M 02/01/2020 HEMATOCRIT: 53.5
77871 43 M 02/01/2020 HEMOGLOBIN: 17.3
77871 43 M 02/01/2020 PLATELETS: 259
77871 43 M 02/01/2020 WHITE BLOOD
CELLS: 8.57
77871 43 M 02/01/2020 NEUTROPHILS: 5.38
77871 43 M 02/01/2020 LYMPHOCYTES:
2.49
77871 43 M 02/01/2020 NEUTROPHILS
77871 43 M 02/01/2020 LYMPHOCYTES
77871 43 M 02/01/2020 RED BLOOD CELL
COUNT: 5.84
77871 43 M 02/01/2020 MEAN
CORPUSCULAR
VOLUME: 91.6
77871 43 M 02/01/2020 MEAN
CORPUSCULAR
HGB: 29.6
77871 43 M 02/01/2020 MEAN
CORPUSCULAR
HGB CONC.: 32.3
77871 43 M 02/01/2020 RDW CV: 12
77871 43 M 02/01/2020 MID
77871 43 M 02/01/2020 MID: 0.70
77871 43 M 02/01/2020 MPV: 10.2
77871 43 M 02/01/2020 PDW: 16.6
77871 43 M 02/01/2020 PCT: 0.265
77871 43 M 02/01/2020 RDW SD: 46.4
study. All variables (19 components) were ana-
lyzed and cross-referenced to identify those rele-
vant for diagnosing anemia and polycythemia (Med-
linePlus, 2022). Key components for these condi-
tions included Hematocrit, Hemoglobin, Red Blood
Cell Count, Mean Corpuscular Volume (MCV), Mean
Corpuscular Hemoglobin (MCH), and Mean Corpus-
cular Hemoglobin Concentration (MCHC) (Institute,
2024). The HDW CV (Red Cell Distribution Width -
Coefficient of Variation), representing the distribution
width of erythrocytes, was excluded. While HDW CV
supports anemia diagnosis and other medical condi-
tions, it does not contribute to polycythemia diagnosis
(Mansoori et al., 2024).
In the data preparation phase, the data was struc-
tured to represent one test per record, with each com-
ponent or parameter in a separate column. Table 1
presents the original data structure of a test, while
columns such as age, sex (1 = M, 0 = F), and result
were reorganized to facilitate analysis.
In the modeling phase, we aimed to identify clus-
tering conditions within the data. Models for K-
means and DBSCAN were developed, and with the
variables related to anemia and polycythemia esti-
mation, machine learning models such as neural net-
works and decision trees were created.
For the evaluation phase, we applied the scoring
function and the confusion matrix. In the validation
Figure 2: Applied ETL Process.
phase, we assessed whether the models met the de-
ployment requirements; this phase focused solely on
the machine learning models.
3.2 Case Study
Table 1 outlines the original structure of the data,
which served as the foundation for the transforma-
tion process. This transformation was conducted in
PLSQL on a virtual server running ORACLE LINUX
as the operating system and ORACLE-XE as the
database. In this environment, the table structures
were created, and the data was cleaned and trans-
formed to produce the final dataset. Anonymized data
from hematological biometric tests conducted on var-
ious regular patients of a laboratory in Quito from
2020 to 2023 was utilized. It is important to note that
these parameters may vary for patients residing in dif-
ferent regions and geographic conditions than those of
Quito.
Based on the aforementioned structure and the fi-
nal dataset, K-Means (Ahmed et al., 2020) and DB-
SCAN (Deng, 2020) clustering models were applied
to identify potential relationships among hematolog-
ical biometric parameters. Machine learning mod-
els, including neural networks (Alsheref and Gomaa,
2019) and decision trees (Noor et al., 2019), were also
employed to identify parameters that could support
the development of a diagnostic support system for
anemia and polycythemia in the future.
4 IMPLEMENTATION
All models were implemented using the Python pro-
gramming language (Bonaccorso, 2019). For clus-
tering models, the Pandas library was used, and for
machine learning, the Sklearn library (Raschka and
Mirjalili, 2019) was applied. Figure 2 shows the ETL
(Extract, Transform, Load) process followed in this
research proposal, as well as the various technologi-
cal resources applied in the process.
Unveiling Insights from Hematobiometry Data: A Data Science Approach Using Data from a Quito Clinical Laboratory
227
Figure 3: Components: Tolerance Values and Medical Con-
ditions for Hematological Biometrics.
4.1 Data Extraction and Analysis
The Data Extraction and Analysis phase in the
MLOps methodology defines two activities: 1) under-
standing the business context, and 2) extracting and
understanding the data.
4.1.1 Business Understanding
The laboratory under study has been legally estab-
lished since 2006 by Ecuadorian governmental regu-
latory organizations (ACESS, the Agency for Quality
Assurance of Health Services and Prepaid Medicine).
It is a medium-sized laboratory providing clinical lab-
oratory services, occupational health, and industrial
safety and hygiene services.
The laboratory has thousands of hematological
biometrics records. Its managers understand that this
information has not been fully utilized and consider it
important to identify trends or knowledge that could
support medical diagnoses.
4.1.2 Data Extraction and Understanding
The data extracted from the laboratory’s specialized
systems went through the ETL process defined in
Figure 2. The result column in the original dataset
(see Table 1) required transformation, generating 19
columns in the final dataset, each defining one of the
19 components or parameters reported by the hema-
tological biometric test, totaling 6551 records (tests
conducted between 2020 and 2023). For each of these
components, individual tolerance ranges were identi-
fied for women, men, and children, as well as asso-
ciated medical conditions if values fell outside these
ranges. Figure 3 illustrates the tolerance values and
medical conditions for each of these components.
Table 2: Sample of the final data structure.
ORDER 77871 77873
AGE 43 72
SEX 1 1
ADMISSION DATE 2/1/2020 2/1/2020
HEMATOCRIT 53.5 52.7
HEMOGLOBIN 17.3 15.8
PLATELETS 259 280
WHITE BLOOD CELLS 8.57 12.9
NEUTROPHILS 5.38 9.43
LYMPHOCYTES 2.49 2.28
NEUTROPHILS 62.8 73.1
LYMPHOCYTES 29 17.7
RED BLOOD CELLS 5.84 5.75
MEAN CORPUSCULAR VOLUME 91.6 91.6
MEAN CORPUSCULAR HGB 29.6 27.4
MEAN CORPUSCULAR HGB CONC. 32.3 30
RDW CV 12 18.2
MID 8.2 9.2
MID 0.7 1.19
MPV 10.2 7.9
PDW 16.6 15.9
PCT 0.265 0.22
RDW SD 46.4 70
SEDIMENTATION
ANEMIA 1 1
POLYCYTHEMIA 0 0
ANEMIA CONF LVL 1 2
POLYCYTHEMIA CONF LVL 0 0
4.2 Data Preparation
Based on the established ranges for each compo-
nent, each test was analyzed to define a variable in-
dicating whether the result suggests conditions of
anemia or polycythemia. A confidence level vari-
able was used (NIV CONF ANE, NIV CONF POL)
to measure the reliability of the pathology assigned
to each test. This variable increases based on the
number of parameters indicating either anemia or
polycythemia. An algorithm in PLSQL was de-
veloped to analyze the tolerance ranges for each
component across the 6551 tests, identifying the
results and recording the values in the variables
ANEMIA, POLYCYTHEMIA, ANEMIA CONFI-
DENCE LEVEL, and POLYCYTHEMIA CONFI-
DENCE LEVEL. Table 2 displays the final structure
of the dataset (the fieldnames have been translated to
the English language from Spanish).
4.3 Modeling
4.3.1 Decision Tree
A decision tree classification model was used. The
model structure has a depth of 5 levels for both
pathologies, as shown in Figures 4 and 6. This struc-
ICT4AWE 2025 - 11th International Conference on Information and Communication Technologies for Ageing Well and e-Health
228
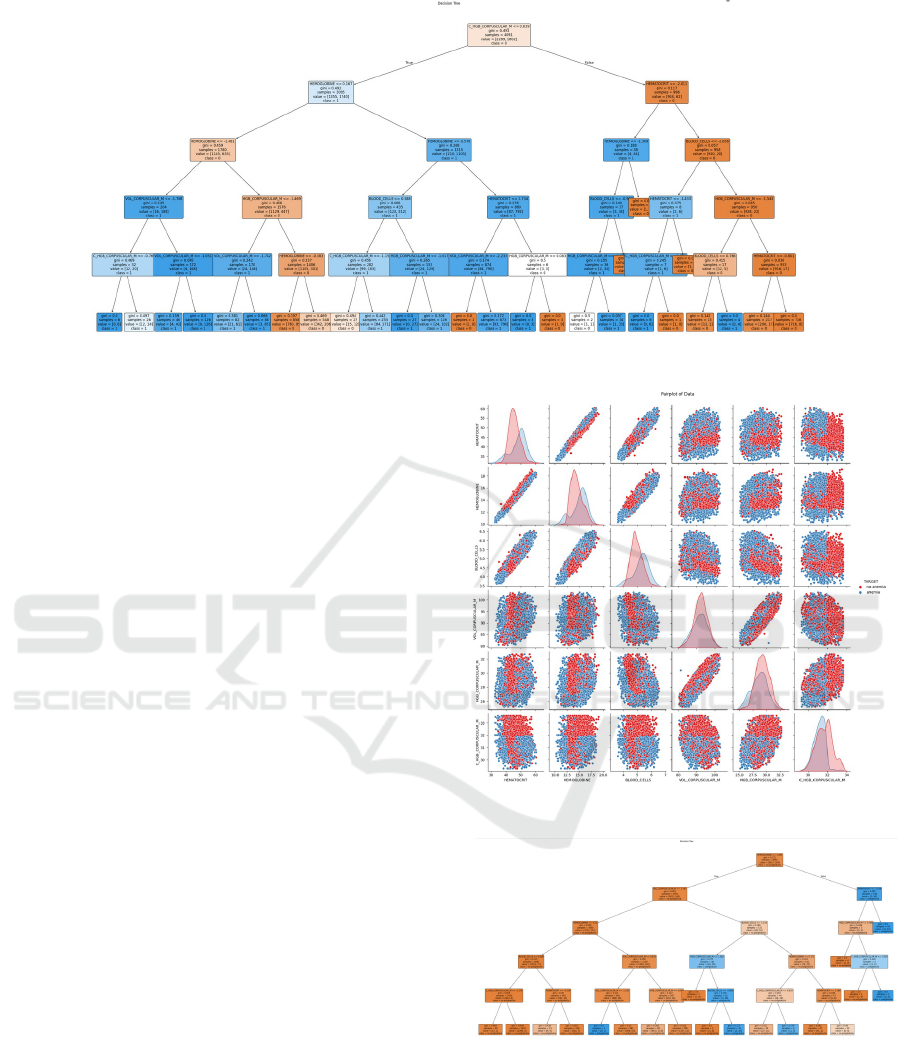
Figure 4: Anemia Decision Tree.
ture allows the model to successfully predict (Class 0
= NO ANEMIA, Class 1 = ANEMIA) without over-
fitting the data.
For the decision tree in anemia, it is observed that
the root node’s dominant variable is M CORPUSCU-
LAR HGB, with a Gini index of 0.493, indicating an
impurity or mixture of classes. In the following tree
levels, decisions are split between other characteris-
tics or components, suggesting that the decision for
anemia is not solely based on one parameter. How-
ever, based on the Gini index, it can be deduced that
hematocrits are more likely to lead to an anemia di-
agnosis. It is notable that most intermediate nodes
have low Gini values, indicating good class separa-
tion for prediction (ANEMIA, NO ANEMIA). The
tree leaves indicate that variations in HEMOGLOBIN
and HEMATOCRIT values affect M CORPUSCU-
LAR HGB and CORPUSCULAR HGB; as seen in
Figure 4.
As shown in Figure 5, in the univariate diagonal
comparison, the non-anemia values are higher than
the anemia values. On the other hand, in anemia
variables like HEMATOCRIT, HEMOGLOBIN, and
MEAN CORPUSCULAR HEMOGLOBIN CON-
CENTRATION, clear peaks denote bimodality and
suggest significant differences in the data.
In the bivariate comparison of HEMOGLOBIN,
HEMATOCRIT, RED BLOOD CELLS, MEAN
CORPUSCULAR HEMOGLOBIN CONCEN-
TRATION, and MEAN CORPUSCULAR
HEMOGLOBIN, a linear correlation is observed,
confirming a relationship among these variables.
Several points show clear class separation, suggesting
these variables may be good discriminators for the
target.
In Figure 6, the root node is HEMOGLOBIN, con-
sidered determinant due to its low Gini index; this tree
Figure 5: Anemia Multivariable Scatter Matrix.
Figure 6: Polycythemia Decision Tree.
shows a high probability of diagnosing polycythemia
based on M CORPUSCULAR VOL and HEMAT-
OCRIT.
In Figure 7, in the univariate diagonal comparison,
non-polycythemia diagnoses are more prevalent than
polycythemia. However, bimodality is less evident in
Unveiling Insights from Hematobiometry Data: A Data Science Approach Using Data from a Quito Clinical Laboratory
229
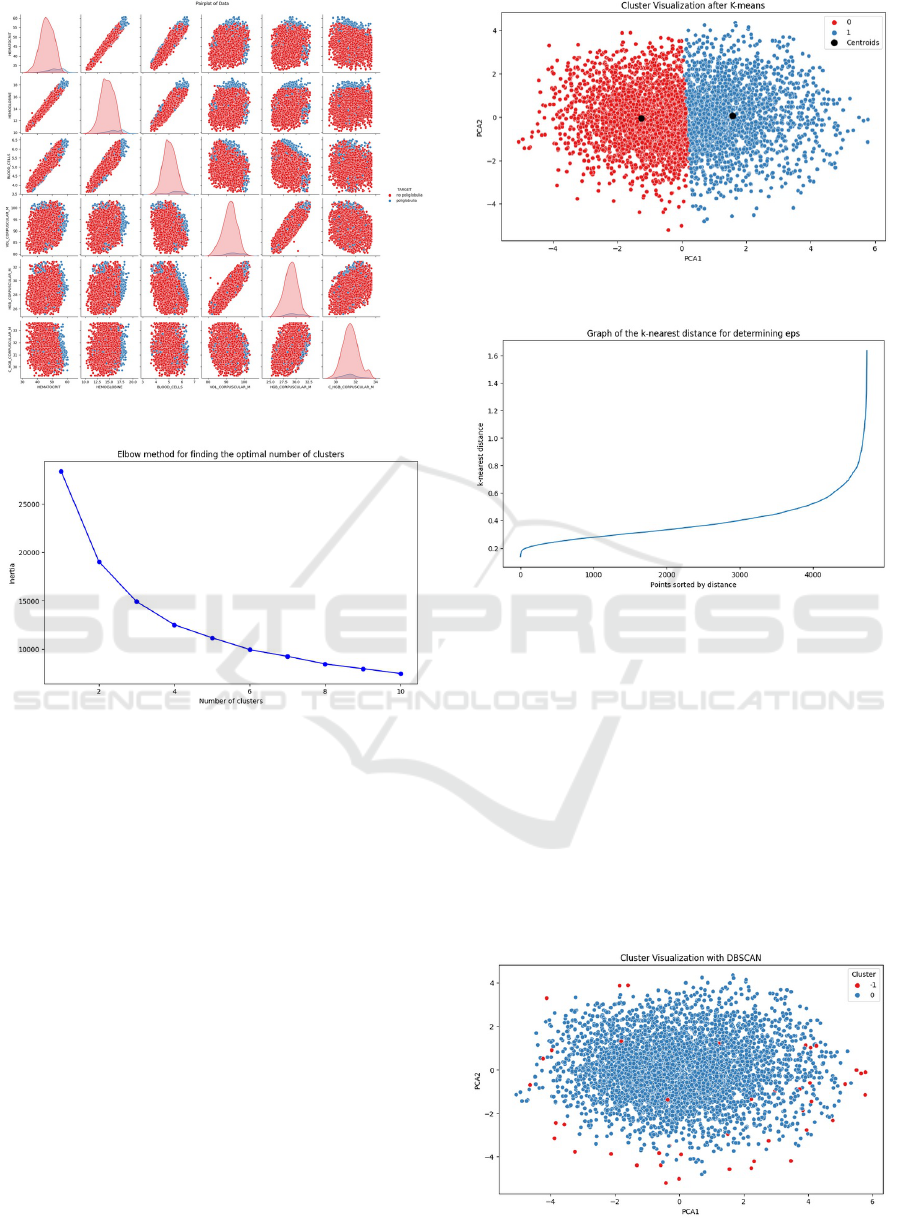
Figure 7: Polycythemia Multivariable Scatter Matrix.
Figure 8: Elbow Plot for Cluster Identification.
this diagnosis.
In the bivariate comparison of highly correlated
variables, the data maintain a linear dispersion pat-
tern.
4.3.2 K-Means
The optimal number of clusters was selected using the
elbow method, determining three clusters as optimal;
as shown in Figure 8.
In Figure 9, the centroids of the three clusters are
relatively close to each other, as variable values fall
within similar ranges due to normal patient condi-
tions. Those further from these centroids tend to have
anemia, polycythemia, or another medical condition.
4.3.3 DBSCAN
Figure 10 shows the k-nearest distance, with a value
of 0.6 applied in the model.
The data are grouped into three clusters, as shown
in Figure 11. The most prominent cluster (blue) repre-
Figure 9: K-Means Cluster Scatter Plot.
Figure 10: K-Nearest Distance Plot to Identify Eps Density.
sents patients with normal medical conditions, while
the additional two clusters (red and green) represent
patients with anemia and polycythemia, respectively.
4.3.4 Neural Networks
The network structure consists of an input layer, two
hidden layers with 50 neurons each, and an output
layer. This structure allows the model to capture im-
portant patterns in the data without overfitting.
Figure 12 shows two density curves. For non-
anemia patients (first curve), the model predicts val-
ues very close to actual values. In anemia patients
Figure 11: DBSCAN Cluster Scatter Plot.
ICT4AWE 2025 - 11th International Conference on Information and Communication Technologies for Ageing Well and e-Health
230
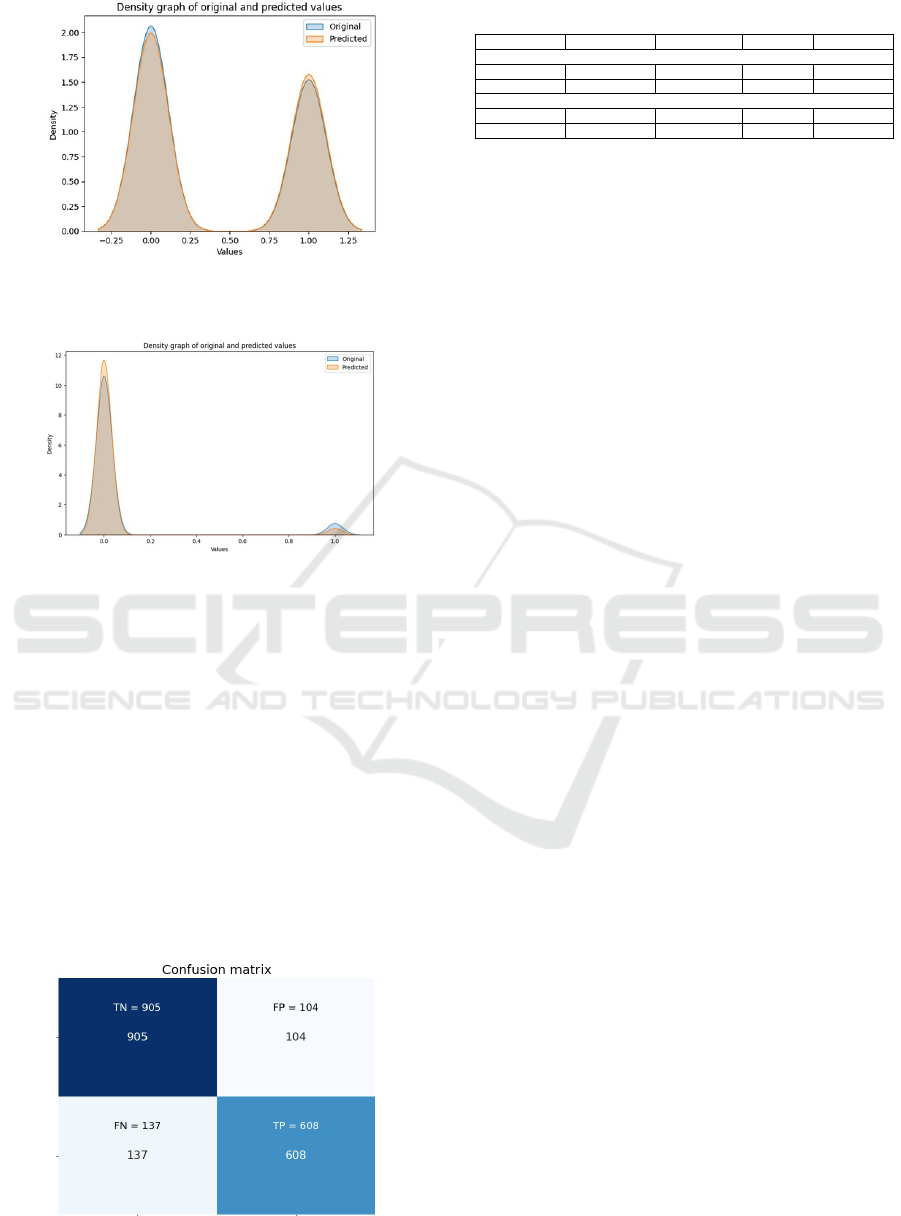
Figure 12: Density Plot for Real vs. Predicted Anemia Val-
ues.
Figure 13: Density Plot for Real vs. Predicted Poly-
cythemia Values.
(second curve), the model slightly overpredicts ane-
mia with a 0.7
In Figure 13, the density plot for polycythemia
cases shows real and predicted values. As the positive
values are few (6.6% of the population), the model is
less efficient, with a 3.4% false negative rate.
4.4 Model Evaluation and Validation
To evaluate and validate these models, a confusion
matrix was used, an example of which is shown in
Figure 14, corresponding to the anemia decision tree.
Accuracy, Precision, Recall, and F1-Score metrics
were also calculated. Table 3 presents the results for
Figure 14: Anemia Decision Tree Confusion Matrix.
Table 3: Evaluation and Validation Metrics.
MODEL ACCURACY PRECISION RECALL F1-SCORE
Decision Tree
Anemia 0.86 0.85 0.82 0.84
Polycythemia 0.95 0.89 0.42 0.57
Neural Networks
Anemia 0.85 0.81 0.84 0.83
Polycythemia 0.96 0.85 0.42 0.57
each model, showing that the sensitivity in predicting
positive cases is good and that predictions are cor-
rect a high percentage of the time, except for mod-
els applied to polycythemia. Although polycythemia
models have high accuracy and a high positive predic-
tion ratio, class imbalance is evident due to the limited
polycythemia cases identified.
5 CONCLUSIONS
This study presents a detailed analysis of using
anonymized hematological biometrics data to develop
models that facilitate the diagnosis of blood disorders,
such as anemia and polycythemia. The project fol-
lowed an MLOps methodology across seven phases:
business analysis, data extraction, data validation,
data preparation, modeling, evaluation, and model
validation. In the initial phase, an in-depth analy-
sis of the clinical laboratory context was conducted,
identifying relevant processes. This was followed by
the extraction and comprehension of available data,
which were prepared through an ETL process that en-
sured compliance with healthcare data protection reg-
ulations. Once the dataset was prepared, clustering
and classification techniques were applied, leading to
the evaluation and modeling of the resulting models.
The clustering analysis enabled the identification
of common characteristics among patients, though di-
agnostic accuracy posed challenges. To address this,
decision tree and neural network models were de-
veloped for the classification of anemia and poly-
cythemia. Both models exhibited similar performance
according to evaluation metrics, demonstrating strong
diagnostic capabilities for anemia. In terms of F1-
score, the models showed better performance in iden-
tifying anemia than polycythemia. Specifically, the
recall for polycythemia was 0.42, indicating lim-
ited capability in correctly identifying positive cases.
Conversely, both models showed an adequate capac-
ity to diagnose anemia cases accurately.
The results indicate that while the developed mod-
els are suitable for diagnosing anemia, they have limi-
tations in identifying polycythemia, suggesting a need
for dataset improvements to address these limitations.
Additionally, these models could be valuable in set-
tings with limited access to healthcare services, such
as certain regions in Ecuador.
Unveiling Insights from Hematobiometry Data: A Data Science Approach Using Data from a Quito Clinical Laboratory
231

In conclusion, the models developed are promis-
ing for anemia diagnosis but require further improve-
ment for precise detection of polycythemia.
Future work will focus on enriching the datasets
and extending the models to identify other diseases,
such as leukemia. Early diagnosis is critical to im-
proving recovery rates and preventing health deteri-
oration. This study lays the groundwork for imple-
menting automated diagnostic systems that could sig-
nificantly benefit populations with limited access to
healthcare services, contributing to enhanced man-
agement and treatment of hematological disorders.
REFERENCES
Ahmed, M., Seraj, R., and Islam, S. M. S. (2020). The
k-means algorithm: A comprehensive survey and per-
formance evaluation. Electronics, 9:1295.
Ahsan, M. M., Luna, S. A., and Siddique, Z. (2022).
Machine-learning-based disease diagnosis: A com-
prehensive review. In Healthcare, volume 10, page
541. MDPI.
Alsheref, F. K. and Gomaa, W. H. (2019). Blood diseases
detection using classical machine learning algorithms.
International Journal of Advanced Computer Science
and Applications, 10(7).
Bonaccorso, G. (2019). Hands-on unsupervised learning
with Python: implement machine learning and deep
learning models using Scikit-Learn, TensorFlow, and
more. books.google.com.
Cloud, G. (2023). Mlops: canalizaciones de automatizaci
´
on
y entrega continua en el aprendizaje autom
´
atico.
Deng, D. (2020). Dbscan clustering algorithm based on
density. 2020 7th international forum on electrical
. . . .
Deo, R. C. (2015). Machine learning in medicine. Circula-
tion, 132(20):1920–1930.
Gun
ˇ
car, G., Kukar, M., Notar, M., Brvar, M.,
ˇ
Cernel
ˇ
c, P.,
Notar, M., and Notar, M. (2018). An application of
machine learning to haematological diagnosis. Scien-
tific reports, 8(1):411.
Institute, N. H. G. R. (2024). Linfocito - glosario parlante
de t
´
erminos gen
´
omicos y gen
´
eticos. Accessed: 2024-
05-30.
Kesavaraj, G. and Sukumaran, S. (2013). A study on clas-
sification techniques in data mining. In 2013 fourth
international conference on computing, communica-
tions and networking technologies (ICCCNT), pages
1–7. IEEE.
Mansoori, A., Gohari, N. F., Etemad, L., and ... (2024).
White blood cell and platelet distribution widths
are associated with hypertension: data mining ap-
proaches. Hypertension . . . .
Mart
´
ınez, R. E. B., Ram
´
ırez, N. C., Mesa, H. G. A., Su
´
arez,
I. R., Trejo, M., Le
´
on, P. P., and Morales, S. L. B.
(2009).
´
Arboles de decisi
´
on como herramienta en el
diagn
´
ostico m
´
edico. Revista m
´
edica de la Universidad
Veracruzana, 9(2):19–24.
MedlinePlus (2022). Biblioteca nacional de medicina usa.
Consultado: 2024-05-30.
Meena, K., Tayal, D. K., Gupta, V., and Fatima, A. (2019a).
Using classification techniques for statistical analysis
of anemia. Artificial Intelligence in Medicine, 94:138–
152.
Meena, K., Tayal, D. K., Gupta, V., and Fatima, A. (2019b).
Using classification techniques for statistical analysis
of anemia. Artificial Intelligence in Medicine, 94:138–
152.
Noor, N. B., Anwar, M. S., and Dey, M. (2019). Compara-
tive study between decision tree, svm and knn to pre-
dict anaemic condition. In 2019 IEEE International
Conference on Biomedical Engineering, Computer
and Information Technology for Health (BECITH-
CON), pages 24–28.
Parthvi, A., Rawal, K., and Choubey, D. K. (2020). A
comparative study using machine learning and data
mining approach for leukemia. In 2020 International
Conference on Communication and Signal Processing
(ICCSP), pages 0672–0677.
Pascual, D., Pla, F., and S
´
anchez, S. (2007). Algoritmos
de agrupamiento. M
´
etodo Inform
´
aticos Avanzados,
pages 164–174.
Pincay, J. (2022). Computational Intelligence, pages 33–56.
Springer International Publishing, Cham.
Raschka, S. and Mirjalili, V. (2019). Python machine learn-
ing: Machine learning and deep learning with Python,
scikit-learn, and TensorFlow 2. books.google.com.
Schober, P. and Vetter, T. (2021). Logistic regression in
medical research. Anesthesia &Analgesia.
Wang, S.-C. (2003). Artificial Neural Network, pages 81–
100. Springer US, Boston, MA.
ICT4AWE 2025 - 11th International Conference on Information and Communication Technologies for Ageing Well and e-Health
232
