
A Simulator Study on Car User’s Perceptions in Interaction with
Autonomous Shuttles
Sagar Meda
1 a
, Mario Ilic
2 b
, Tanja Niels
2 c
and Eftychios Papapanagiotou
1 d
1
Professorship for Intelligent, Multimodal Transport Systems, UniBwM, Neubiberg, Germany
2
Chair of Traffic Engineering and Control, TUM, Munich, Germany
Keywords:
Autonomous Shuttles, Human Errors, Driving Behaviours, Perception, Safety, Stress, Driving Simulator,
Experimental Design, Qualitative Survey and Participants.
Abstract:
This study integrates a driving simulator and microscopic traffic simulation tool to evaluate the impact of
autonomous shuttles on driving behavior and safety in a university campus environment. Two scenarios were
developed: one featuring a conventional shuttle and another with an autonomous shuttle, allowing a direct
comparison of driver perceptions under identical conditions. Results show that perceived safety was higher
for conventional shuttles (Mean: 5.909) compared to autonomous shuttles (Mean: 2.818), while stress levels
remained consistent across both scenarios. These findings highlight critical human factors and challenges in
integrating autonomous shuttles, offering empirical insights into their behavioral and safety implications in
mixed-traffic environments.
1 INTRODUCTION
Technological advancements have significantly im-
proved road and vehicle safety systems in recent
decades, enhancing the overall safety and driving ex-
perience. However, human errors still hold a larger
share of the causes of an accident. Accidents caused
by human error continue to be a significant problem,
resulting in serious injuries, fatalities, and substantial
financial losses despite traffic laws and awareness ef-
forts. A study by National Highway Traffic Safety
Administration (2017) found that 94% to 96% of all
vehicle accidents are due to human errors.
Human errors can result from various factors, such
as driving while distracted or intoxicated, speeding,
acting recklessly, lack of awareness and traffic law vi-
olations. Accidents are more likely to occur when the
driver’s focus is distracted from the road by activi-
ties like eating, using in-car entertainment systems, or
talking on the phone. Similar to this, driving while in-
toxicated increases the likelihood of accidents by im-
pairing judgment, coordination, and response times.
Speeding is a common cause of accidents because it
impairs a driver’s capacity to react appropriately to
unforeseen circumstances. Lack of awareness and ed-
a
https://orcid.org/0009-0006-9227-8596
b
https://orcid.org/0000-0003-2457-698X
c
https://orcid.org/0000-0002-8530-0285
d
https://orcid.org/0000-0002-8538-0326
ucation due to the introduction of new mobility op-
tions such as Autonomous Vehicles (AVs) also raises
the risk and probability of accidents. A systemic ap-
proach is necessary for mitigating the issue of road
safety and accidents caused by human error. This en-
tails further research into the psychological and be-
havioural components of driving, improved educa-
tion and awareness campaigns, and enforcing stricter
regulations. Furthermore, by making up for human
error and limitations, technological developments in
vehicle technology, like advanced driver-assistance
systems (ADAS), detection sensors and autonomous
driving systems, can contribute to a safer driving en-
vironment, which potentially reduces road accidents
and their related external costs.
AVs are one such option; they have already been
driven on public roads. It has been observed that they
adhere to local laws and traffic restrictions. Moreover,
a study conducted by Bartneck et al. (2021) found
that although the average human driver was seen to
be driving at 70 Miles per hour (113 Kilometers per
hour) on the Atlanta freeway, autonomous cars were
found to be travelling below the posted limits. Thus
realizing the benefits hosted by such mobility options.
Further, the AVs possess superiority up to a certain ex-
tent based on the ability of the vehicle to perform any
task under varying conditions.
However, the emergence of AVs could compli-
cate the urban environment to an unprecedented de-
gree, presenting both advantages and challenges for
54
Meda, S., Ilic, M., Niels, T. and Papapanagiotou, E.
A Simulator Study on Car User’s Perceptions in Interaction with Autonomous Shuttles.
DOI: 10.5220/0013272700003941
In Proceedings of the 11th International Conference on Vehicle Technology and Intelligent Transport Systems (VEHITS 2025), pages 54-65
ISBN: 978-989-758-745-0; ISSN: 2184-495X
Copyright © 2025 by Paper published under CC license (CC BY-NC-ND 4.0)

the modern world. The interaction between an au-
tonomous vehicle and a conventional driver can be
uncertain at times, and this might have an impact on
driving dynamics and human perception abilities to a
certain degree. Therefore, the increasing number of
cities across the world should be innovative in the in-
tegration of intelligent mobility solutions into the ex-
isting urban traffic environment that would bgeable to
meet the population’s demands for efficient, safe, and
sustainable transportation.
The study area considered for this study is the
campus of the University of the Bundeswehr Mu-
nich (Universit
¨
at der Bundeswehr M
¨
unchen), situ-
ated in Neubiberg, Munich, Germany. It spans ap-
proximately 350 acres and plans to introduce an au-
tonomous shuttle into the campus mobility ecosys-
tem. While this initiative can significantly reduce en-
vironmental degradation, it also alters key behavioral,
psychological, and human factors of driving. These
factors include perceived safety, perceived stress, per-
ception of the driving environment, and driver con-
fidence, all of which are often challenging to con-
ventional drivers. Therefore, the research questions
of the paper are as follows: 1) To what extent does
the introduction of autonomous shuttles in the study
area impact human factors such as perceived safety,
stress, perception, and driver confidence? 2) What is
the quantitative relationship between perceived safety
and perceived stress, and how does perceived safety
influence driver stress levels?
This paper begins with a comprehensive literature
review, followed by a detailed methodology outlin-
ing the data collection, experimental design, simula-
tor setup, applied methods, and software used. The
results and discussion present key findings in relation
to the study’s objectives. Finally, the conclusion of-
fers an overall outlook and limitations of the study
and suggests potential areas for future research.
2 LITERATURE REVIEW
The following sections will introduce key topics rel-
evant to this study. The first sub-section introduces
road safety and the leading causes of traffic accidents
due to human errors. Further, the discussion will
delve into the influence of autonomous shuttles on
conventional driving behaviour and dynamics, with a
particular emphasis on how these shuttles affect car
driver’s perceptions of safety and stress. In the final
section, the use of driving simulators to study these
behavioural shifts will be explored.
2.1 Road Safety and Accidents
The awareness of the traffic environment is vital; hu-
man factors, such as general perception of the sur-
roundings, stress level, perception of safety, and con-
fidence have a critical influence on a safer driving
environment. Research by Sayed et al. (2022) em-
phasized the influence of environmental conditions
and the importance of education and training to attain
awareness. Study findings showed that a challenging
traffic environment induces high-stress levels and in-
creases driving errors. Further, points out that young
male drivers have a low perception of risk correlating
to accident rates.
Similarly, Xiao (2020) demonstrated that demo-
graphic factors, specifically age and gender, have a
crucial role in influencing accident rates, largely due
to differences in perception accuracy. Notably, Ta-
ble 1 depicts various human factors as a cause of ac-
cidents. 90% of road fatalities out of 1.19 million
incidents are seen in low and middle-income coun-
tries, primarily due to a lack of appropriate education,
training and awareness (World Health Organization,
2023a). Additionally, Lee and Winston (2016) under-
scored that drivers experience heightened stress levels
in situations where they feel a lack of control or low
perception of safety and also highlighted behavioural
implications, such as abrupt braking or quick lane
change in response to increased stress levels.
2.2 Autonomous Shuttles
Autonomous shuttles possess numerous advantages
in contrast to conventional buses, especially in
metropolitan areas. A study by Bucchiarone et al.
(2020) suggested that they could promote shared
and integrated transportation, improve tourism expe-
riences, and offer last-mile deliveries. In addition,
Giese and Klein (2005) illustrated that these shut-
tles are an integral part of Intelligent Transportation
Systems (ITS), which combines on-demand schedul-
ing, cost-effective techniques and efficient usage of
resources. Intelligent autonomous shuttles are able to
transport a small amount of goods or a small group of
passengers on their own. They can also independently
navigate a passive track system and make decentral-
ized operational decisions (Giese and Klein, 2005).
Further, Bucchiarone et al. (2020) emphasized
how autonomous shuttles, specifically when deployed
in designated lanes, have the potential to increase road
safety, decrease emissions, and improve traffic effi-
ciency. The case study results highlighted the poten-
tial of autonomous shuttles to serve hard-to-reach ar-
eas such as city centers, corporate headquarters, and
A Simulator Study on Car User’s Perceptions in Interaction with Autonomous Shuttles
55

Table 1: Global Road Accident Data by Human Error Factors.
Human Error Fac-
tor
Key Statistics Source
Limited Awareness Globally, road traffic fatalities reach approximately 1.19
million annually, with human error, mainly perception
and recognition failures, accounting for about 41% of in-
cidents.
(World Health Orga-
nization, 2023a)
Stress Level Limited perceived safety in environments with larger ve-
hicles, intersections, and close-following traffic can in-
crease stress, elevating heart rates and anxiety, which are
linked to error-prone driving behaviors.
(Maga
˜
na et al., 2020;
Tavakoli et al., 2023;
Lee and Winston,
2016)
Distracted Driving Distracted driving accounts for approximately 8-10% of
global road fatalities, with a high prevalence of mobile
phone use.
(World Health Orga-
nization, 2023a)
Speeding Nearly 30% of global traffic deaths are attributed to
speeding; each 1% speed increase raises fatality risk by
4%.
(World Health Orga-
nization, 2023c)
Fatigued Driving Fatigue-related crashes cause significant global fatalities;
fatigue equates to a 0.08% BAC impairment level.
(World Health Or-
ganization and Na-
tional Sleep Founda-
tion, 2023)
Impaired Driving
(Alcohol/Drugs)
Driving under influence increases crash fatality risk up to
5x; alcohol impairment is a factor in around 15-20% of
global fatalities.
(World Health Orga-
nization, 2023b)
hospitals, where traditional buses may face limita-
tions and the potential possibility that autonomous
shuttles will completely change urban transportation
(Bucchiarone et al., 2020). However, Iclodean et al.
(2020) pointed out the necessity to consider some
of the legal frameworks and social aspects following
the widespread use of autonomous driving as a pub-
lic transportation method associated with it (Iclodean
et al., 2020).
Nevertheless, there are still knowledge gaps about
the usage of such newer mobility options. The lack of
availability of a driver or an operator inside the vehi-
cle might raise trust-related questions and show a low
acceptance compared to conventional human-driven
vehicles. Research by Aramrattana et al. (2022)
found that when sharing the road with autonomous
shuttles, several notable adaptations have been ob-
served. First, drivers tend to adjust their following
distance, often reducing the time gap during on-ramp
scenarios but increasing it on highways when driv-
ing near autonomous vehicles (AVs). Furthermore,
lane-changing frequency decreases, suggesting that
conventional drivers become more conservative when
driving alongside AVs. Similarly, a reduction in over-
all speed has also been observed (Aramrattana et al.,
2022).
2.3 Simulator Studies
Driving simulators are crucial for many reasons, and
they have great significance in research, training, test-
ing, and decision-making concerning traffic actions.
Simulators help to build models closer to reality and
perform various experiments in a safe and controlled
manner. A key advantage of driving simulator stud-
ies lies in their cost-efficiency compared to real-world
vehicle testing. Physical vehicle testing often de-
mands substantial expenses, particularly as vehicles
may require tuning or modifications to suit each sce-
nario. Since research typically encompasses multi-
ple scenarios, incorporating various sets of test ve-
hicles for each is not cost-effective. Moreover, con-
ventional vehicles may not consistently perform as
intended within controlled conditions, adding fur-
ther complexity to accurate scenario-based testing.
Additionally, there is a possibility for unlimited it-
erations without damaging or disturbing infrastruc-
ture and traffic flow. Wang et al. (2007) reviewed
seven aspects in a study, which include driving be-
haviour studies, driver education and training, trans-
portation infrastructure, medicine and therapy, er-
gonomics, intelligent transportation system, and ad-
ministrative method and these aspects have been eval-
uated efficiently with the help of a driving simulator.
Additionally, in therapy and medicine, driving sim-
VEHITS 2025 - 11th International Conference on Vehicle Technology and Intelligent Transport Systems
56

ulators are used to evaluate and rehabilitate people
with driving-related disabilities (Wang et al., 2007).
Another study by Santiago-Chaparro et al. (2011) of-
fered valuable insights into road safety audits using
driving simulators. It proposes conceptual procedures
to speed up and enhance safety audits by introducing
programming and other software extensions that can
significantly reduce time. However, this cannot be ap-
plied globally due to a factor called simulator sickness
(Santiago-Chaparro et al., 2011).
Simulator sickness is an essential consideration
in any simulator study. Symptoms caused by mo-
tion sickness include nausea, dizziness, headache and
disorientation, which impact the participant’s health.
Ethical and legal considerations are necessary, and a
comfortable experimental design must be modelled to
minimize Simulator sickness. Numerous researchers
refer to simulator sickness with different terms. For
instance, Brown et al. (2022) calls it cybersickness,
and Kennedy et al. (1993) terms it simulator sickness.
Likewise, this study will make use of the term simula-
tor sickness. When participants feel unwell or uncom-
fortable during the study, they might choose to leave,
posing challenges in keeping them engaged for the
duration of the research. Additionally, such unpleas-
ant experiences can reduce their enthusiasm and will-
ingness to participate, impact travel behaviour signif-
icantly and engagement levels within the study, and
raise concerns about data quality and reliability. The
cause of simulator sickness is still debated, and many
hypotheses and theories have been discussed.
2.4 Research Gap and Contribution of
this Study
Evaluating changes in driving dynamics and
analysing the variations with human factors are piv-
otal for the integration of autonomous shuttles, which
host many advantages over conventional options in
the existing ecosystem. However, it is necessary to
understand its impact and the fundamental changes
required to accommodate such mobility options.
Garus et al. (2022) supports the fact that new mo-
bility solutions are transforming road transportation,
such as autonomous vehicles and have the potential to
impact travel behaviour significantly. The researcher
further points out that it is challenging to incorpo-
rate these changes into traditional models. The de-
gree to which behavioural changes are taken into ac-
count determines how well the existing models per-
form (Garus et al., 2022).
Additionally, the experimental design should be
optimized to eliminate any potential redundancy, en-
suring maximum efficiency and precision in the data
collection process. A study by Gold et al. (2018)
proposed a taxonomy for testing scenarios in human
factors research of Level 3 automated vehicles. Fur-
ther, a study by Calvi et al. (2022) highlighted how
spatial constraints, such as road layout, affect driv-
ing behaviour. For instance, in tighter spaces or ar-
eas with reduced lanes (e.g., from three lanes to one),
the driver’s behaviour shifts dramatically when fol-
lowing autonomous vehicles. Similarly, the study
emphasized that traffic volume and spatial conditions
are critical in the assessment of behavioural changes
(Calvi et al., 2022)
In summary, this paper attempts to critically ex-
amine the impact of autonomous shuttles on conven-
tional car drivers, considering human factors and their
psychological dimension along with identifying rela-
tive behavioural changes. Further, the research seeks
to have a closer view of some of these critical voids by
focusing specifically on driver’s perceptions concern-
ing the new mobility option in the study area, as this
will seemingly provide new knowledge and empirical
facts to the field of ITS.
3 METHODOLOGY
This section discusses the overall design of the exper-
iment. As mentioned earlier, the study aims to ex-
amine the impact of the introduction of autonomous
shuttles on the driving behaviours of conventional car
users in the study area. A static driving simulator and
a qualitative survey questionnaire have been incorpo-
rated to investigate changes in the psychological re-
sponses of conventional car drivers when verbally in-
formed about the presence of an autonomous shuttle
in one of the scenarios. The survey was designed to
comprehend traditional car driver’s perspectives and
readiness to drive with such mobility options. The
results obtained by the qualitative survey were statis-
tically analyzed to obtain cumulative and final results
from all the test subjects.
3.1 Study Procedure
In this subsection, specific hypotheses of interest will
be presented along with the design of the experiment
to validate or discard the presented hypotheses.
The first hypothesis (H1) states that the presence
of an autonomous shuttle in the study area environ-
ment will influence the physiological and behavioural
aspects of conventional car users. Similarly, the sec-
ond (H2) emphasises that perceived safety directly
contributes to the levels of perceived stress in drivers.
The design of the experiment integrated a static
A Simulator Study on Car User’s Perceptions in Interaction with Autonomous Shuttles
57

simulator into this study to provide an immersive driv-
ing experience as shown in Figure 1, portrays a vir-
tual environment of the study area that has been de-
signed and developed using OpenDrive (Association
for Standardization of Automation and Measuring
Systems (ASAM), 2024) data to build a transporta-
tion network and related infrastructure. This data was
gathered from an earlier survey conducted in 2015 by
a private surveyor named 3D Mapping Solutions.
Figure 1: Virtual Environment.
Similarly, traffic data has been collected and in-
corporated into the experimental design. The study
area includes a camera-based traffic data collection
system to collect and capture traffic statistics. Cam-
eras have been installed in various locations on the
campus to capture the movements of all vehicles and
traffic participants. These cameras are installed at ma-
jor intersections, entry-exit points, and other hot spots
on campus.
Further, Figure 2 depicts the simulation unit incor-
porated in the study and Figure 3 illustrates the differ-
ent software and tools employed in the design, such
as DYNA4; it provides a platform to handle, access,
modify and perform the experiment, further offers
model configuration and scenario management to cre-
ate, import or export models and attributes of Vehicle
under Test (VuT) (Vector Informatik GmbH, 2024b).
Similarly, CANoe is a versatile and essential soft-
ware interface; it provides a thorough framework for
creating, evaluating, and optimizing electronic con-
trol units (ECUs) and the complex network connec-
tions seen in automobiles. CANoe handles mechani-
cal aspects of the simulator, which includes collision
counter detection (Vector Informatik GmbH, 2024a).
Likewise, Matlab (The MathWorks, Inc., 2024a) and
Simulink (The MathWorks, Inc., 2024b) are core parts
of the simulation setup that support CANoe opera-
tions in the background. The block models required
to control the vehicle performance and simulator con-
figurations were provided and handled with Simulink.
Another powerful tool, SUMO, is a microscopic sim-
ulation tool that has been incorporated with the inter-
face of DYNA4 to enable and control traffic demand
in the virtual environment. Each of these applications
performs specific tasks, and its integration facilitates
a working simulator environment.
Figure 2: Simulator Setup - Hardware.
Considering the traffic volumes, road categories
and traffic regulations inside the campus, a route
has been selected from point A to Point B, which
includes different road categories (main street and
shared space) and traffic conditions and is also an im-
portant commuting route inside the study area. Fig-
ure 4 depicts the route selected along with camera
locations. The red arrow mark indicates the starting
point for the VuT. The total length of the route is 1.6
kilometres, including sections of the main street (red
line) and shared path (blue line). As the name sug-
gests, shared space can be used by all possible classes,
such as cars, trucks, bikes, motorbikes, e-scooters and
pedestrians. Vulnerable users hold the highest priority
on such roads. It also includes some major intersec-
tions and a low-speed zone in front of Kindergarten.
The simulation experiment includes two scenar-
ios: one with a conventional shuttle and another
with the same shuttle presented to participants as au-
tonomous. Both scenarios are otherwise identical,
allowing comparison of responses based on the per-
ceived automation level. Each of these scenarios has
been designed to study the interaction between VuT
and the respective shuttle. This study considered six
categories of vehicles for other road users: cars, bicy-
cles, e-scooters, motorbikes, pedestrians, and a bus,
often termed a shuttle as far as the study is concerned.
3.2 Participants and Experimental Task
The preliminary stage essentially includes a briefing
session of 15 minutes that lays out a general overview
of the experiment and essential tasks expected from
the participants. A total of 23 participants were in-
volved in the study: 10 female and 13 male candi-
VEHITS 2025 - 11th International Conference on Vehicle Technology and Intelligent Transport Systems
58
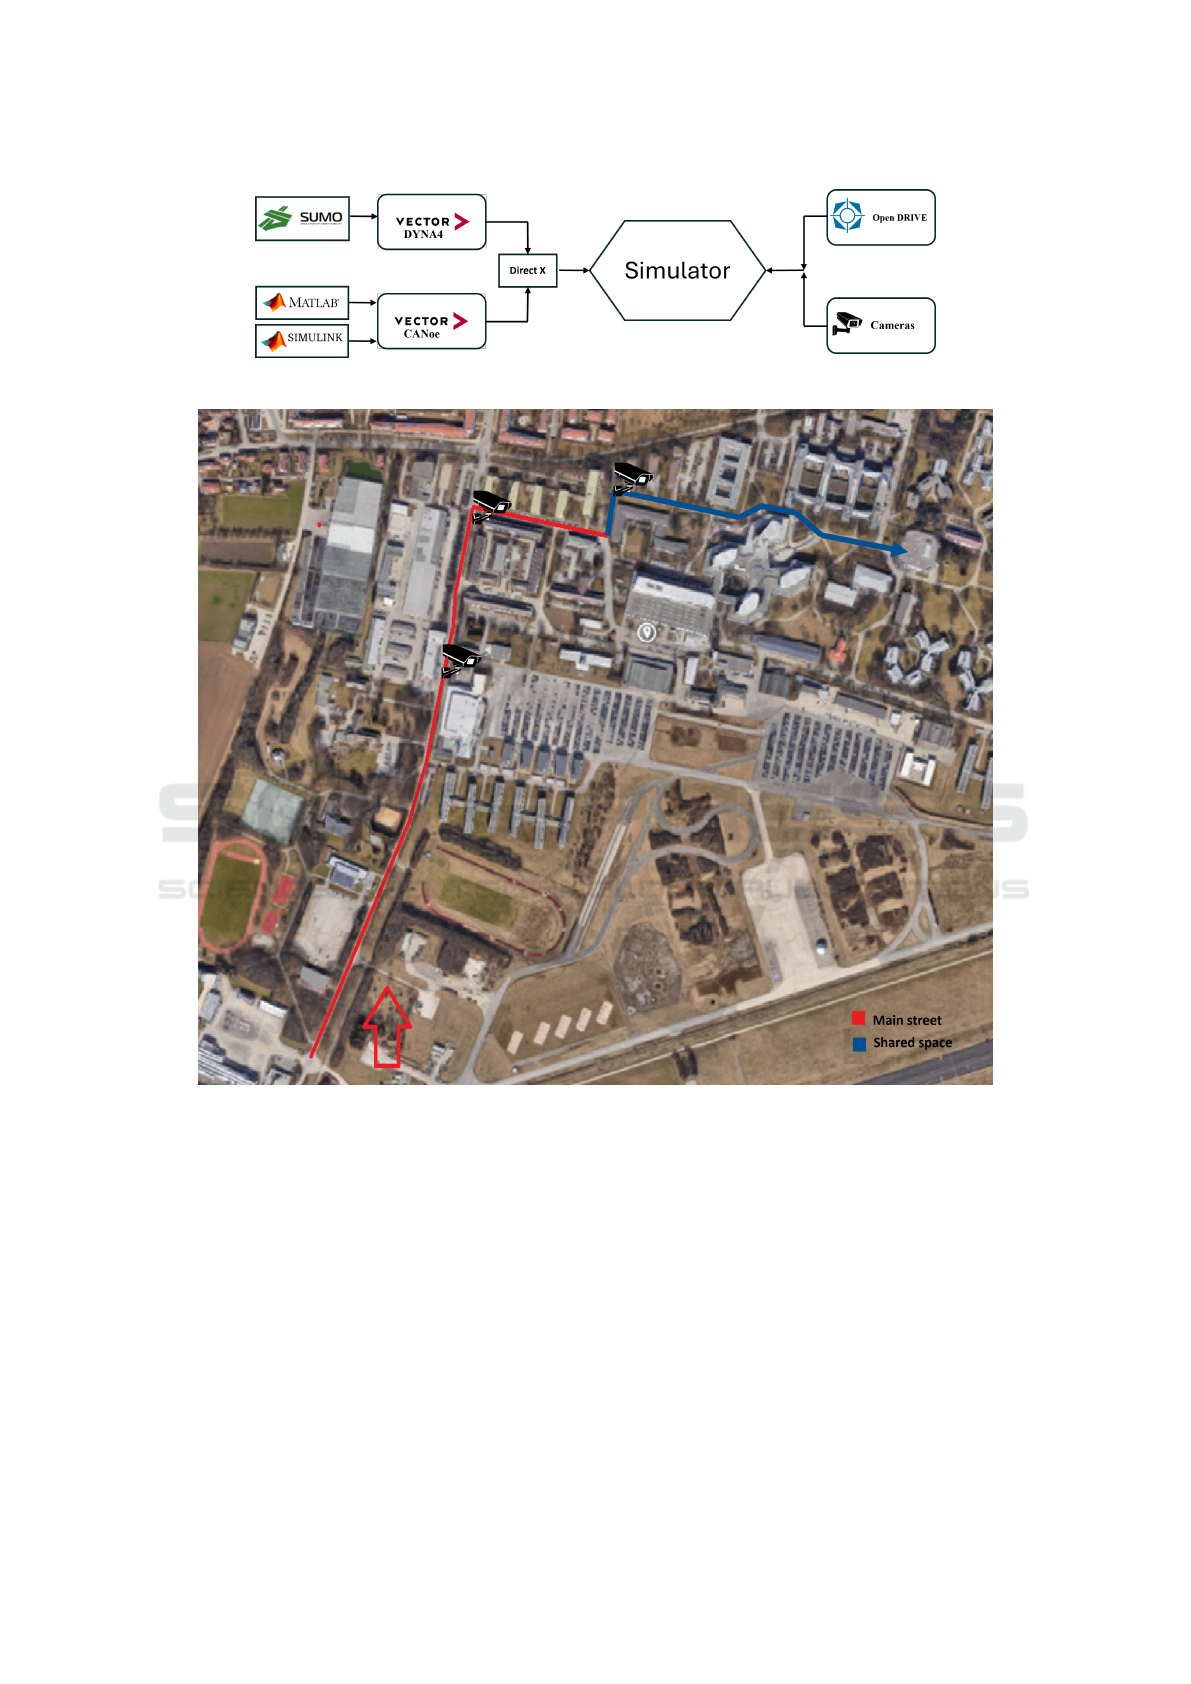
Figure 3: Simulator Setup - Data and Software Tool.
Figure 4: Route and Camera Location.
dates aged between 22 and 40 years with a mean driv-
ing experience of ten years (SD = 4.743). The pool of
participants had different demographic backgrounds,
consisting of nine nationalities, and everyone had at
least a bachelor’s degree.
Figure 5 narrates the procedures involved with the
experimental tasks. In the first step, demographic de-
tails of the participants were acquired through a set of
comprehensive demographic questionnaires. These
surveys will be answered via an online tool, SociSur-
vey. The survey includes a declaration of consent,
information about data protection, information about
the simulator, and tasks to be performed.
Further, each participant will be trained in a spe-
cific training scenario to get acquainted with the dy-
namics of the simulator, followed by a simulator sick-
ness questionnaire (SSQ) designed by Kennedy et al.
(1993). The SSQ results are pivotal in assessing the
participant’s condition in regard to simulator sickness.
Once the test participants felt comfortable with the
simulator, they were introduced to the testing scenar-
ios. As Figure 5 depicts, participants were let to drive
in Scenario 1 along with a conventional shuttle in the
scenario. Similarly, in Scenario 2, before initiating
Scenario 2, a piece of new information was given to
the participants verbally ’This scenario is with the
A Simulator Study on Car User’s Perceptions in Interaction with Autonomous Shuttles
59
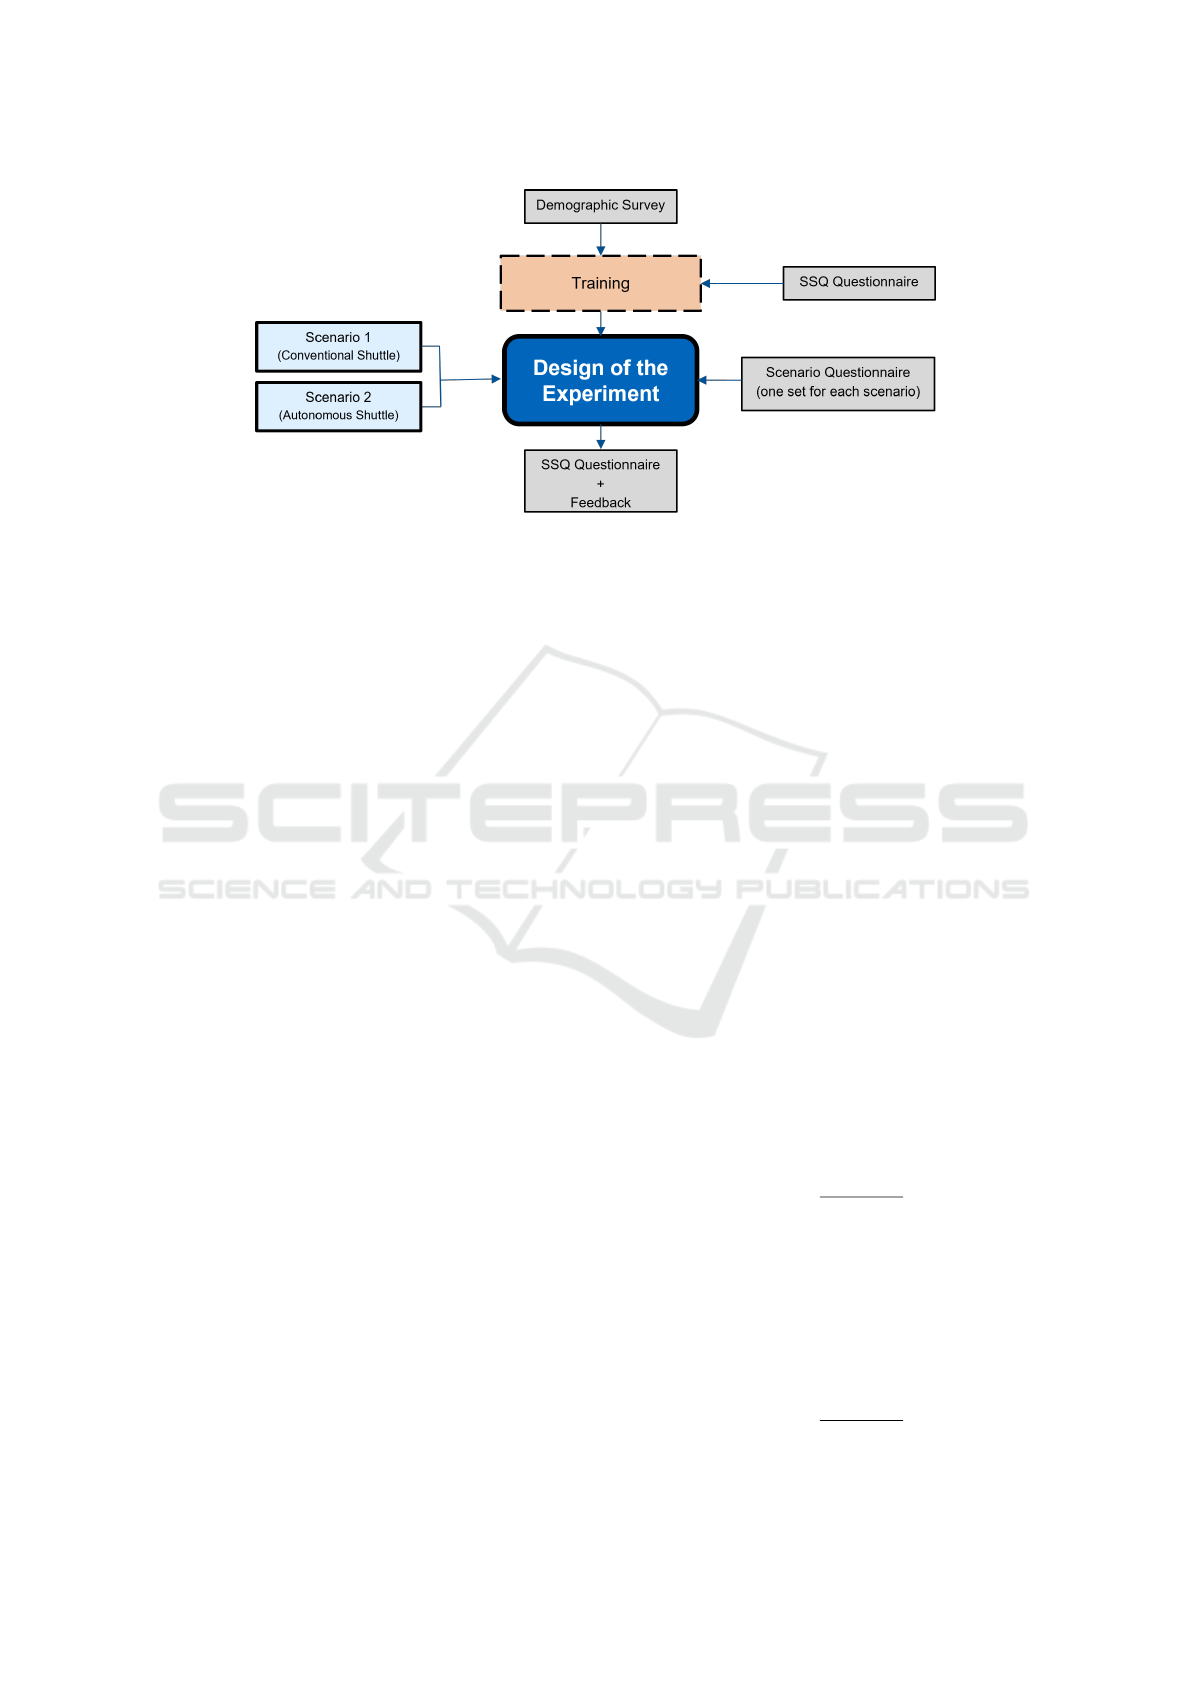
Figure 5: Flow Diagram - Experimental Phase.
Autonomous shuttle’. Additionally, participants an-
swered a qualitative survey after each scenario run.
The scenario questionnaire (qualitative) is a se-
ries of structured questions to collect the participant’s
opinions and perceptions about operating the driving
simulator in different scenarios. It had a particular
emphasis on interactions with autonomous shuttles.
Specific questions were designed to measure the per-
ceived safety, stress levels, and ability to predict the
behaviour of autonomous shuttles. In the end, SSQ
has been exercised again to examine the degree of
simulation sickness.
4 RESULTS AND DISCUSSIONS
This section presents the study outcome and data fil-
tering procedures. The results should support or con-
tradict the initial hypothesis on how the introduction
of autonomous shuttles affects the behaviour of car
drivers and safety. Further, to enhance the under-
standing of the results concerning both psychologi-
cal and behavioural aspects focused in this study, the
outcomes have been analysed and addressed in two
sections.
4.1 Outcome Filtering
A collision counter has been incorporated as an in-
dicator with a pre-defined reference limit; based on
the sample size of test subjects, a boundary limit is
assumed and defined. The assumptions were made
considering historical results and an iterative testing
procedure.
The collision counter is a simulator-inclusive sig-
nal that detects the number of collisions between VuT
and the rest of the traffic in each scenario. This data
is not hidden from participants. Any collisions be-
tween VuT and road users are instantly conveyed to
the driver via a vibration signal on the steering wheel.
The participants with more than two collisions per
scenario were excluded from the dataset. However,
only one participant was excluded from the results
dataset due to erratic driving and high collision en-
counters. The remaining 22 participants were seen
with zero or less than two collisions.
4.2 Statical Analysis of Qualitative
Results
Mann Whitney U test, also known as the Wilcoxon
rank-sum test, has been employed in the result anal-
ysis of this study. Mann-Whitney U test is a non-
parametric statistical test used to determine if there
are significant differences between two independent
groups. It is particularly useful when comparing two
groups with ordinal data or continuous data with a
small sample size test that does not require normal
distribution, making it appropriate for the study. Fur-
ther, Equation 1 and 2 present the mathematical for-
mulation of the Mann-Whitney U test, used to com-
pare the two independent groups based on their rank
sums.
U
1
= n
1
n
2
+
n
1
(n
1
+ 1)
2
− R
1
(1)
Where:
U
1
is the Mann-Whitney U statistic for the first group,
n
1
is the number of observations in the first group,
n
2
is the number of observations in the second group,
R
1
is the sum of the ranks for the observations in the
first group.
Similarly, for the second group, you can compute:
U
2
= n
1
n
2
+
n
2
(n
2
+ 1)
2
− R
2
(2)
VEHITS 2025 - 11th International Conference on Vehicle Technology and Intelligent Transport Systems
60
Where:
U
2
is the Mann-Whitney U statistic for the second
group,
R
2
is the sum of the ranks for the observations in the
second group.
As mentioned in the earlier section, this study em-
phasizes three key factors: perceived safety, perceived
stress, and perception of the driving environment in
regard to conventional car drivers in the study area.
These factors are discussed in detail in the following
subsections.
Perceived Safety
Safety corresponds to safety ratings opted by par-
ticipants in regard to interaction with the autonomous
or conventional shuttle, depending on the scenarios.
The participants conveyed their opinions using the
seven-star Likert scaling used in the scenario survey.
Seven corresponds to higher safety, and one is rela-
tively unsafe.
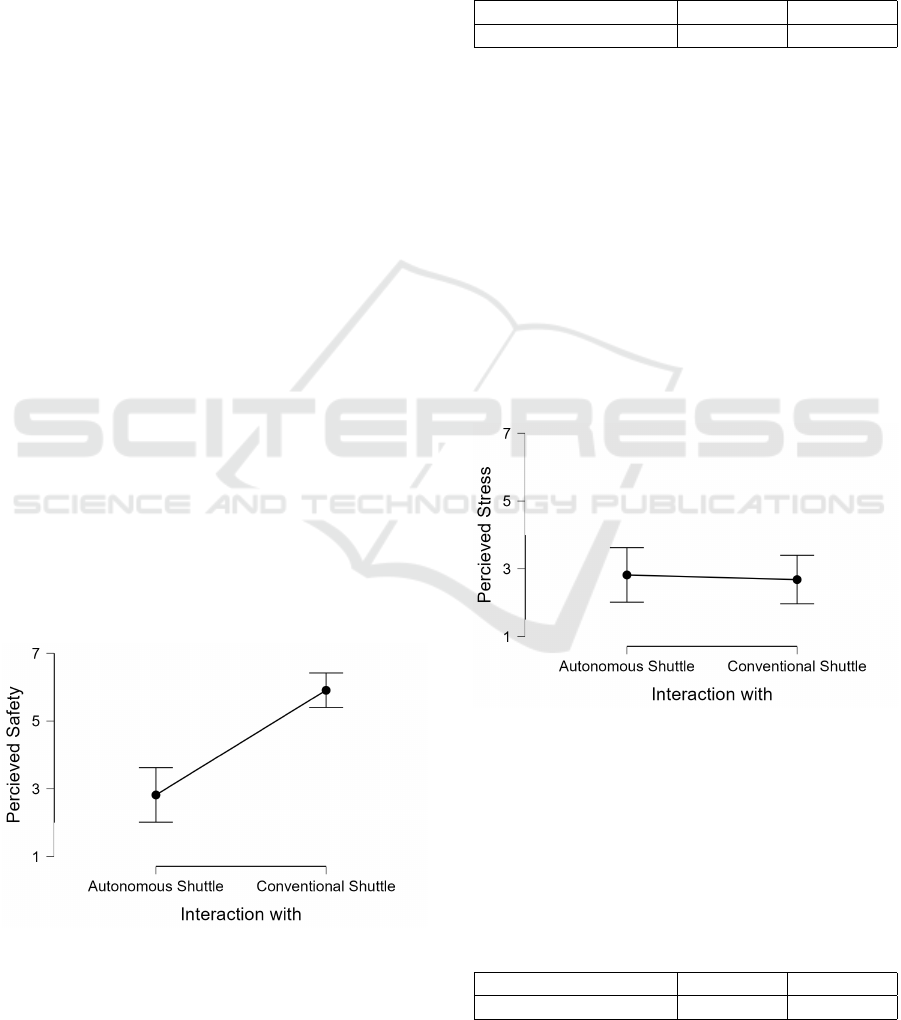
Figure 6 indicates that participants generally per-
ceive higher safety when interacting with conven-
tional shuttles compared to autonomous shuttles. The
mean value for perceived safety is higher for conven-
tional shuttles. Also, Table 4 indicates the descrip-
tive statistics of two scenarios across 22 participants
(N=22), suggesting the conventional car drivers felt
comparatively safer (Mean: M = 5.909, Standard De-
viation: SD = 1.151) while driving along with the
conventional shuttle rather than an autonomous shut-
tle (M = 2.818, SD = 1.816). Even though the driving
behaviour of the autonomous shuttle in the simula-
tion environment is identical to the driving behaviour
of the conventional shuttle. The only difference be-
tween the two scenarios is that the participants are in-
formed beforehand that the shuttle is autonomous or
conventional.
Figure 6: Perceived Safety of Conventional Car Drivers.
Table 2, displays U-statistics; It represents the sum
of ranks for one of the two groups compared in the test
and p-statistics; A p-value less than 0.001 indicates
strong evidence against the null hypothesis, suggest-
ing a statistically significant difference in perceived
safety between the two groups. Further, the Mann-
Whitney U test shows that the perceived safety is sig-
nificant (p = 0.001< 0.05). Therefore, this supports
the first hypothesis (H1) of the study.
Table 2: Independent Samples T-Test for Perceived Safety.
U p
Perceived Safety 49.000 < .001
Perceived Stress
Another indicator used in this study is stress,
which helps assess diverse study components. Per-
ceived stress serves as a multi-dimensional unit
influencing distinct aspects of transportation sys-
tems. Firstly, stress directly impacts driver behaviour.
Heightened stress levels can impair decision-making,
reaction times, and sustained attention, potentially
compromising driving safety.
As shown in Figure 7, stress perceived by con-
ventional users is similar in both scenarios. Further,
the stress scores indicated by descriptive details for
the scenario with the autonomous (M = 2.818, SD =
1.816) and conventional shuttles (M = 2.682, SD =
1.615) are relatively similar.
Figure 7: Perceived Stress of Conventional Car Drivers.
Additionally, in the Mann-Whitney U test, as
shown in Table 3, the perceived stress does not dif-
fer significantly (p = 0.981> 0.05) and also, perceived
stress seemed not to influence the perceived safety to
the same extent. Therefore, the hypothesis (H2) is
rejected based on the previously chosen confidence
level.
Table 3: Independent Samples T-Test for Perceived Stress.
U p
Perceived Stress 243.500 0.981
A Simulator Study on Car User’s Perceptions in Interaction with Autonomous Shuttles
61
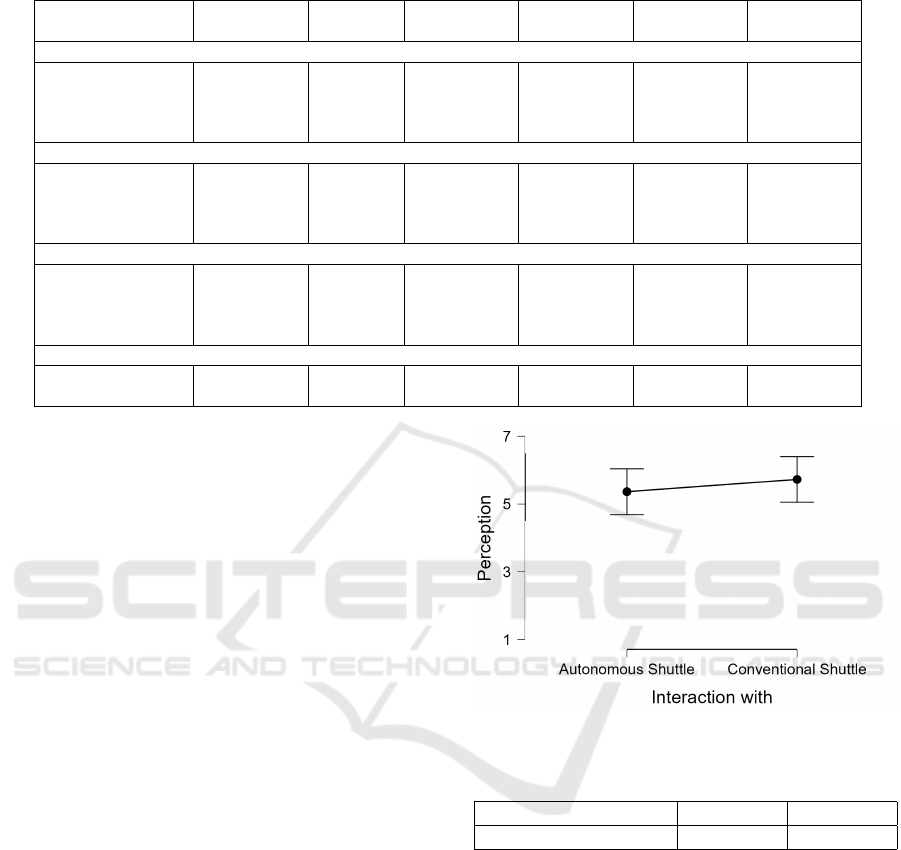
Table 4: Grouped Descriptive Values for Human Factors.
Group N Mean SD SE Coefficient
of variation
Perceived Safety
Autonomous
Shuttle
22 2.818 1.816 0.387 0.644
Conventional
Shuttle
22 5.909 1.151 0.245 0.195
Perceived Stress
Autonomous
Shuttle
22 2.818 1.816 0.387 0.644
Conventional
Shuttle
22 2.682 1.615 0.344 0.602
Perception
Autonomous
Shuttle
22 5.364 1.529 0.326 0.285
Conventional
Shuttle
22 5.727 1.518 0.324 0.265
Confidence of Driving with AVs
Male 13 4.462 0.519 0.144 0.116
Female 9 3.556 0.882 0.294 0.248
Even though the factor of stress perception is stat-
ically insignificant, overall mean values (see Table 4)
suggest a slight change in the behaviours of the car
drivers as they tend to perceive rather in a different
manner while interacting with the autonomous shut-
tle.
Perception
Perception corresponds to awareness of the sur-
rounding traffic environment, which is a vital indica-
tor of the psychological and behavioural aspects of
this study. The acceptance of new mobility options
and, therefore, the ability to understand the dynam-
ics of these mobilities become a meaningful part of
the campus transportation ecosystem is directly tied to
user acceptance. When individuals perceive such ve-
hicles and their operations as safe and reliable, adop-
tion increases, and the integration into the existing
transportation system proceeds smoothly.
As Figure 8 depicts, perceptions of both shuttle
options, autonomous and conventional shuttles, are
relatively similar. However, as shown by descriptive
statistics in Table 4, the autonomous shuttle tends to
be perceived slightly less (M = 5.364, SD = 1.529) by
the car drivers as compared to a conventional shuttle
(M = 5.727, SD = 1.518) within the exact same envi-
ronment.
Furthermore, as shown by Table 5, the Mann-
Whitney U test indicates that perception does not dif-
fer and is insignificant (p = 0.343> 0.05) with the
chosen confidence levels. Therefore, perception as
a factor leads to the rejection of the first hypothesis
(H1) in the study.
Additionally, the survey results highlight the con-
fidence levels of drivers when sharing the road with
Figure 8: Perception of Conventional Car Drivers.
Table 5: Independent Samples T-Test for Perception.
U p
Perception 202.500 0.343
AVs in an urban environment. The demographic
data of the participants provided valuable insights into
these perceptions. After the data filtering, the result
dataset contained 22 participants, consisting of nine
female and 13 male drivers, who shared their views
on driving alongside AVs.
Figure 9 illustrates that male drivers reported
higher confidence when interacting with AVs in an ur-
ban environment, with an average score of M = 4.462
(SD = 0.592). In contrast, female drivers expressed
lower confidence, resulting in a comparatively lower
average score of M = 3.556 (SD = 0.294) under the
same traffic conditions.
Further, Table 6 indicates the value from the
Mann-Whitney U test. The difference between the
VEHITS 2025 - 11th International Conference on Vehicle Technology and Intelligent Transport Systems
62

Figure 9: Confidence Levels of Conventional Car Drivers.
Table 6: Independent Samples T-Test for Confidence of
Driver Interacting with AVs.
U p
Confidence of Driving
with AVs
93.000 0.013
two groups is statically insignificant (p = 0.013>
0.05) given the confidence interval of 95%. Never-
theless, female participants expressed varied confi-
dence across the rating scale, wherein the male drivers
tended to report relatively higher confidence.
The findings of this research demonstrate, that
perceived safety emerged as a key metric, reflect-
ing the psychological and behavioral impacts of au-
tonomous shuttles on conventional car drivers. The
distinct differences in safety perceptions between au-
tonomous and conventional shuttles highlight its cen-
tral role in shaping driver interactions within mixed-
traffic environments. While perceived safety was a
primary focus, other interconnected factors, such as
stress levels, driver confidence, and the perception of
the driving environment, provided essential insights
that enriched the analysis. Collectively, these aspects
form a comprehensive framework for understanding
how emerging autonomous technologies affect human
factors, offering a foundation for a scalable frame-
work for assessing human factors in similar experi-
mental setups.
5 CONCLUSIONS AND FUTURE
WORK
Overall, the introduction of autonomous shuttles is
discussed, along with the crucial notion of integrating
emerging mobility solutions into the driving environ-
ment of the study area as an essential component of
the reshaping of mobility.
The study effectively demonstrates the influence
of autonomous shuttles on driving behaviours, per-
ceptions, and driver psychology. Findings revealed a
significant reduction in perceived safety levels when
drivers were informed verbally about the autonomous
shuttle’s presence, even though both scenarios were
otherwise identical to each other. It also highlights
that the perceived safety and perceived stress of a con-
ventional car driver are not directly related to interact-
ing with autonomous shuttles within the defined traf-
fic environment.
Similarly, the variations across different human
factors with different participants throughout the
study clearly point out that human perceptions sig-
nificantly impact driving, and deviations indicate the
degree of perception change in reference to aggre-
gated mean driving behaviours. Even though the re-
sult cannot be generalized to the whole driving com-
munity. The study, which was conducted effectively
with 22 participants, resulted in slightly varied per-
ceptions and lesser safety perception levels concern-
ing autonomous shuttles. Nevertheless, no large-scale
or fundamental issues have resulted in the introduc-
tion of autonomous shuttles on campus.
Though the study still has certain limitations,
these can be tackled in future research designs with
appropriate considerations. A much bigger sample
size with varied demographic backgrounds might help
in a deeper analysis of driving perceptions. Simi-
larly, consideration of other human and psychological
factors might provide a closer understanding of be-
havioural data. Detailed geometric data covering all
aspects of road infrastructure on the campus will en-
hance visualization of the interaction between traffic
and VuT. Further research direction includes the inte-
gration of vehicles-to-everything (V2X) communica-
tions units and connected simulators.
In conclusion, along with the results, the study of-
fers a framework to design, develop and perform an
experiment in regard to driving behaviours and sur-
vey procedures. The complete experiment is designed
from scratch to study the impact of autonomous shut-
tles on the campus. The same experimental design
can be adapted for further research with other vehi-
cle types as well, considering appropriate and cali-
brated driving models. Additionally, the procedure
discussed to carry out an experiment with participants
considering various aspects, the study had established
a comprehensive experiment design.
ACKNOWLEDGEMENTS
The research was carried out under the Munich
Mobility Research Campus (MORE) project with
A Simulator Study on Car User’s Perceptions in Interaction with Autonomous Shuttles
63

the financial support of the Deutsche Zentrum f
¨
ur
Digitalisierungs- und Technologieforschung der Bun-
deswehr (dtec.bw) under the funding of Europ
¨
aischen
Union – NextGenerationEU. We would like to express
our gratitude to Prof. Dr. Silja Hofmann for their sup-
port and insights throughout the experiment. AI tool
Chat GPT has been used to improve the legibility of
the text.
REFERENCES
Aramrattana, M., Fu, J., and Selpi (2022). Behavioral adap-
tation of drivers when driving among automated vehi-
cles. Journal of Intelligent and Connected Vehicles,
5(3):309–315.
Association for Standardization of Automation and Mea-
suring Systems (ASAM) (2024). ASAM Open-
DRIVE Standard. Available at: https://www.asam.net/
standards/detail/opendrive/.
Bartneck, C., L
¨
utge, C., Wagner, A., and Welsh, S. (2021).
Autonomous Vehicles, page 83–92. Dual Use Sci-
ence and Technology, Ethics and Weapons of Mass
Destruction.
Brown, P., Spronck, P., and Powell, W. (2022). The simu-
lator sickness questionnaire, and the erroneous zero
baseline assumption. Frontiers in Virtual Reality,
3:118.
Bucchiarone, A., Battisti, S., Marconi, A., Maldacea, R.,
and Ponce, D. C. (2020). Autonomous shuttle-as-a-
service (asaas): Challenges, opportunities, and social
implications. IEEE Transactions on Intelligent Trans-
portation Systems, 22(6):3790–3799.
Calvi, A., D’Amico, F., Ferrante, C., and Calcaterra, G.
(2022). A driving simulator study on the effects of
autonomous vehicles on drivers behaviour under car-
following conditions. Human Factors in Transporta-
tion, 60(60):10–54941.
Garus, A., Alonso, B., Alonso Raposo, M., Ciuffo, B., et al.
(2022). Impact of new mobility solutions on travel be-
haviour and its incorporation into travel demand mod-
els. Journal of Advanced Transportation, 2022.
Giese, H. and Klein, F. (2005). Autonomous shuttle system
case study. In Scenarios: Models, Transformations
and Tools: International Workshop, Dagstuhl Castle,
Germany, September 7-12, 2003, Revised Selected Pa-
pers, pages 90–94. Springer.
Gold, C., Naujoks, F., Radlmayr, J., Bellem, H., and
Jarosch, O. (2018). Testing scenarios for human fac-
tors research in level 3 automated vehicles. In Ad-
vances in Human Aspects of Transportation: Proceed-
ings of the AHFE 2017 International Conference on
Human Factors in Transportation, July 17- 21, 2017,
The Westin Bonaventure Hotel, Los Angeles, Califor-
nia, USA 8, pages 551–559. Springer.
Iclodean, C., Cordos, N., and Varga, B. O. (2020). Au-
tonomous shuttle bus for public transportation: A re-
view. Energies, 13(11):2917.
Kennedy, R. S., Lane, N. E., Berbaum, K. S., and Lilien-
thal, M. G. (1993). Simulator sickness questionnaire:
An enhanced method for quantifying simulator sick-
ness. The international journal of aviation psychol-
ogy, 3(3):203–220.
Lee, Y.-C. and Winston, F. (2016). Emotions & driving
in stressful traffic situations. Transportation Research
Part F: Psychology and Behavior, 42:215–226.
Maga
˜
na, V. C., Scherz, W. D., Seepold, R., Madrid, N. M.,
Pa
˜
neda, X. G., and Garcia, R. (2020). The effects of
the driver’s mental state and passenger compartment
conditions on driving performance and driving stress.
Sensors, 20(18):5274.
National Highway Traffic Safety Administration (2017).
Quick facts 2016. Technical Report DOT HS
812 456, U.S. Department of Transportation, Na-
tional Highway Traffic Safety Administration. Avail-
able at: https://crashstats.nhtsa.dot.gov/Api/Public/
Publication/812456.
Santiago-Chaparro, K., DeAmico, M., Bill, A., Chitturi, M.,
and Noyce, D. (2011). Virtual road safety audits using
driving simulators: A framework. In 3rd International
Conference on Road Safety and Simulation.
Sayed, I., Abdelgawad, H., and Said, D. (2022). Study-
ing driving behavior and risk perception: a road safety
perspective in egypt. Journal of Engineering and Ap-
plied Science, 69(1):22.
Tavakoli, A., Lai, N., Balali, V., and Heydarian, A. (2023).
How are drivers’ stress levels and emotions associated
with the driving context? a naturalistic study. Journal
of Transport & Health, 31:101649.
The MathWorks, Inc. (2024a). MATLAB Documenta-
tion. Available at: https://www.mathworks.com/help/
matlab/.
The MathWorks, Inc. (2024b). Simulink Documenta-
tion. Available at: https://www.mathworks.com/help/
simulink/.
Vector Informatik GmbH (2024a). CANoe4SW:
Software-in-the-Loop Testing Platform. Avail-
able at: https://www.vector.com/int/en/products/
products-a-z/software/canoe4sw/.
Vector Informatik GmbH (2024b). DYNA4: Simula-
tion and Virtual Testing Platform. Available at:
https://www.vector.com/int/en/products/products-a-z/
software/dyna4/.
Wang, Y., Zhang, W., Wu, S., and Guo, Y. (2007). Simula-
tors for driving safety study–a literature review. In Vir-
tual Reality: Second International Conference, ICVR
2007, Held as part of HCI International 2007, Bei-
jing, China, July 22-27, 2007. Proceedings 2, pages
584–593. Springer.
World Health Organization (2023a). Global status report on
road safety 2023. Available at: https://www.who.int/
publications/i/item/9789240086517.
World Health Organization (2023b). Global sta-
tus report on road safety 2023. Avail-
able at: https://www.who.int/teams/
social-determinants-of-health/safety-and-mobility/
global-status-report-on-road-safety-2023.
VEHITS 2025 - 11th International Conference on Vehicle Technology and Intelligent Transport Systems
64

World Health Organization (2023c). Speed management
report 2023. Available at: https://www.who.int/
news-room/fact-sheets/detail/road-traffic-injuries.
World Health Organization and National Sleep Foun-
dation (2023). Fatigue and road safety: A
global analysis. Global Studies on Fatigue in
Road Safety. Available at: https://www.thensf.org/
drowsy-driving-prevention/.
Xiao, Y. (2020). Analysis of the influencing factors of the
unsafe driving behaviors of online car-hailing drivers
in china. Plos one, 15(4):e0231175.
A Simulator Study on Car User’s Perceptions in Interaction with Autonomous Shuttles
65
