
Toward a More Realistic Energy Consumption Model for IoT Nodes in
Extreme-Edge Computing Environments
Hassan Hammoud
2,3
, Fr
´
ed
´
eric Weis
3
, Melen Leclerc
2
and Jean-Marie Bonnin
1
1
IRISA, IMT Atlantique, Rennes, France
2
IGEPP, INRAE, Le Rheu, France
3
IRISA, Rennes University, Rennes, France
Keywords:
IoT, Extreme-Edge Computing, Power Consumption, Energy Efficiency, Sensors, Memory Operations,
Low-Power Networks, Energy Model, Wireless Sensor Networks (WSNs).
Abstract:
As Internet of Things (IoT) networks grow, accurately modeling the energy consumption of individual IoT
nodes has become essential for understanding and managing energy use in diverse applications. In extreme-
edge computing scenarios, where processing is pushed as close to the device as possible to support local data
manipulation, memory operations play a substantial role in power consumption. However, existing models in
the literature primarily focus on communication, processing, and sensing, often overlooking the contribution
of memory operations to overall energy use. This paper presents an extended energy model for IoT nodes,
incorporating memory-related energy usage alongside traditional factors. Results show that addressing mem-
ory usage within the energy model provides a more comprehensive understanding of consumption patterns,
supporting more effective management strategies for IoT applications. Furthermore, we propose an approach
that optimizes power consumption by implementing data management techniques that efficiently handle data
retrieval and storage.
1 INTRODUCTION
IoT represents a transformative paradigm in modern
technology, characterized by the interconnection of
billions of devices that collect, share, and act on data
in real time (Rose et al., 2015). As these devices pro-
liferate, power consumption emerges as a critical con-
cern that influences the efficiency and sustainability
of IoT systems (Alsharif et al., 2024). Various de-
ployment strategies are considered for different IoT
applications, which exhibit different power consump-
tion patterns due to their unique operational behaviors
and architectural requirements. In traditional setups,
IoT systems continuously transmit data over wireless
communication networks to remote servers for pro-
cessing and analysis. This continuous data transmis-
sion leads to high power consumption at the nodes,
where data manipulation relies heavily on cloud re-
sources. In contrast, edge and fog computing shift
processing closer to the data source, often resulting
in reduced latency and improved energy efficiency
(De Donno et al., 2019). Moreover, extreme-edge
computing, which means manipulating data directly
at its source, leverages local processing capabilities.
It refers to highly constrained or remote environments
where devices perform tasks locally with limited re-
sources such as power, connectivity, or processing
capacity, thereby facilitating real-time data manipu-
lation directly on the device. However, even within
these frameworks, the specific energy requirements
can vary significantly based on the nature of the de-
ployed devices and their functions (Vasconcelos et al.,
2019).
To better understand the power consumption as-
sociated with these approaches, we investigated the
state of the art in IoT node power models. It shows
that node behavior, particularly involving local pro-
cessing, corresponds to different power models and
influences power consumption sources. Existing lit-
erature highlights significant advancements in power
consumption models for IoT nodes, covering system
operation, communication, sensing and processing.
However, when considering extensive local process-
ing that requires data to be stored for use in subse-
quent cycles, the power consumption associated with
this is non-negligible and often overlooked in current
studies. Especially when using low-power nodes and
extreme edge computing, managing energy consump-
Hammoud, H., Weis, F., Leclerc, M. and Bonnin, J.-M.
Toward a More Realistic Energy Consumption Model for IoT Nodes in Extreme-Edge Computing Environments.
DOI: 10.5220/0013273800003944
In Proceedings of the 10th International Conference on Internet of Things, Big Data and Security (IoTBDS 2025), pages 69-80
ISBN: 978-989-758-750-4; ISSN: 2184-4976
Copyright © 2025 by Paper published under CC license (CC BY-NC-ND 4.0)
69

tion presents a critical challenge if we aim to achieve
long-lasting operations with true (real) sensors. To
address this gap, we present an energy model that in-
tegrates memory-related power consumption along-
side existing factors and can be adapted for vari-
ous use cases. This model provides insights into the
unique energy demands of data storage and manipu-
lation directly on the device, thereby supporting more
sustainable IoT deployments in extreme-edge and lo-
cal processing scenarios.
The paper is structured as follows. We begin with
the related work section, which reviews existing lit-
erature on power and energy models in IoT systems
and highlights the gap that our research aims to ad-
dress in terms of the impact of memory operations.
Next, we present measurements conducted on our IoT
node to investigate the various sources of power con-
sumption, followed by an illustration of the relation-
ship between memory operations and data storage and
retrieval, highlighting their impact on overall power
consumption. We then describe our experimental re-
sults and analyze the simulations performed to com-
pare our findings with existing studies, demonstrating
the effectiveness of our approach. Finally, we con-
clude with a discussion of our results, and potential
directions for future research.
2 RELATED WORKS
The general formulas for power and energy
1
, which
are fundamental to understanding energy consump-
tion in wireless sensor networks, can be expressed in
eq. 1 and 2, as follows:
P = V · I (1)
ε
general
=
(
R
t
f
t
i
P(t)dt if power P(t) varies over time
P
constant
· ∆t if power is constant
(2)
where P represents the instantaneous power measured
in watts (W), V denotes the voltage across the device
measured in volts (V), I signifies the current flowing
through the device measured in amperes (A), and ε
indicates the energy consumed measured in joules (J).
These equations are well-supported in the litera-
ture. For instance, (You et al., 2021) discussed the
low-power strategies for wireless sensor networks and
emphasize the importance of accurately measuring
power consumption. Similarly, (Moschitta and Neri,
2014) assess the power consumption in various wire-
less sensor networks, providing insight into the ap-
plication of the power formula. Furthermore, (Sitta-
1
https://electronicsclub.info/power.htm
latchoumy et al., 2016) offer a detailed power anal-
ysis using simulation tools, reinforcing the relevance
of these formulas in practical scenarios.
The study in (Bouguera et al., 2018) introduces an
energy consumption model for communicating sen-
sors, where the total energy consumed ε
Total
during
one cycle is given by:
ε
Total
= ε
Sleep
+ ε
Active
(3)
where ε
Sleep
is the energy consumed in sleep mode
and ε
Active
is the energy consumed during active op-
eration.
The energy consumed in sleep mode is calculated
as:
ε
Sleep
= P
Sleep
· T
Sleep
(4)
where P
Sleep
is the power consumption in sleep mode
and T
Sleep
is the duration in sleep mode.
During active operation, the total energy con-
sumption ε
Active
is the sum of the energies consumed
by various components:
ε
Active
= ε
WU
+ ε
m
+ ε
proc
+ ε
Tr
+ ε
R
(5)
where ε
WU
is the energy consumed during the system
wake-up, ε
m
is the energy used for data measurement,
ε
proc
is the energy for processing, ε
Tr
is the energy for
transmission, ε
R
is the energy for reception.
Authors in (Sawaguchi et al., 2021; Jacob et al.,
2016) discuss the primary operational behaviors, such
as sleep and wake states presented in eq. 6, as these
significantly influence the overall power usage, as in
eq. 7.
T
cycle
= T
active
+ T
sleep
(6)
P
Cycle
= P
active
+ P
sleep
(7)
In the case of a server utilized in an IoT applica-
tion, according to (Lin et al., 2020), the main power-
consuming components are computational and stor-
age elements like the CPU, memory, disk and network
interface card (NIC). The representation of power
consumption for a server is shown in eq. 8.
P
server
= P
cpu
+ P
mem
+ P
disk
+ P
NIC
(8)
On the other side, IoT nodes different approaches
dominate discussions around power consumption.
Starting by the traditional approach, where nodes pri-
marily gather data and transmit it to a central server
for processing, which is energy-intensive due to the
high cost of communication. In this context, a com-
prehensive model presented in (Martinez et al., 2015)
that accounts for all energy costs including system
level (P
SYS
), communications (P
NET
), data acquisition
(P
ACQ
) and processing (P
PROC
) as depicted in eq. 9.
P
DEV
= P
NET
+ P
ACQ
+ P
PROC
+ P
SYS
(9)
IoTBDS 2025 - 10th International Conference on Internet of Things, Big Data and Security
70

However, an approach that is increasingly popu-
lar alternative involves local processing at the node
level (Li et al., 2023), where various specialized hard-
ware solutions are utilized to enhance this capability
(Merino et al., 2020). Here, instead of transmitting
all raw data to the server, nodes process data locally
and only transmit essential or aggregated information
when necessary. This approach reduces communica-
tion overhead and consequently the energy consump-
tion. Authors in (
¨
Ozkaya and
¨
Ors, 2021;
¨
Ozkaya and
¨
Ors, 2024) presents a model-based methodology for
estimating power consumption in IoT nodes, empha-
sizing local processing to improve energy efficiency.
It highlights how executing application-specific logic
locally reduces latency and energy use by minimizing
data transmission, considering the eq. 10 and eq. 11 :
ε
Dev
(0,t) = ε
Sens
(0,t) + ε
Act
(0,t) + ε
Proc
(0,t)
+ ε
Comm
(0,t) + ε
Sys
(0,t)
(10)
Z
t
τ=t
0
P
Dev
(τ)dτ = ε
Dev
(t
0
,t) (11)
where ε
Dev
(t
0
,t) is the energy consumption function
of the device within a time span from t
0
to t. The func-
tions ε
Sens
(t
0
,t), ε
Act
(t
0
,t), ε
Proc
(t
0
,t), ε
Comm
(t
0
,t),
and ε
Sys
(t
0
,t) represent the energy consumption for
processing, communication, actuation, sensing, and
other system activities, respectively, within the time
span from t
0
to t. These energy consumptions are ex-
pressed as:
ε
Sens
(t
0
,t) =
(
ε
Smpl
· N
s
(sync.)
ε
Smpl
· N
′
s
· P
r
(e) (async.)
(12)
ε
Act
(t
0
,t) =
(
ε
Smpl
· N
s
+ ε
Base
(t
0
,t) (sync.)
ε
Smpl
· N
′
s
· P
′
(e) +ε
Base
(t
0
,t) (async.)
(13)
ε
Proc
(t
0
,t) = I
Proc
(t) ·V
Dev
(t) · T
Calc
(14)
ε
Comm
(t
0
,t) =
N
Msg
∑
i=0
P
Msg
(t) · T
i
Msg
(15)
ε
Sys
(t
0
,t) = I
Sys
(t) ·V
Dev
(t) · T
Sys
(16)
While these studies have made significant con-
tributions to the understanding of power consump-
tion in IoT systems within different operational en-
vironments, there remains a critical gap in the lit-
erature regarding the energy used by memory op-
erations. This concern is particularly important in
extreme-edge computing, where extensive local pro-
cessing necessitates efficient data storage and retrieval
across cycles. Failing to consider memory operations
as a substantial source of power consumption could
lead to unrealistic expectations of energy efficiency
(Brayner and Menezes, 2007).
3 MEASUREMENTS OF IoT
NODE POWER CONSUMPTION
In the context of extreme-edge computing, we previ-
ously conducted an experiment over 7 days focused
on pushing data manipulation to the device as much
as possible (Hammoud et al., 2024). This experiment
was aimed at monitoring disease risks associated with
weather conditions in agriculture using a more effi-
cient and frugal approach, which focused on calculat-
ing the risk locally and retrieving only the events to
the server. An event refers to a potential disease risk,
where its occurrence is predicted based on weather
data and conditions that determine whether it quali-
fies as an event. Additionally, when favorable condi-
tions occurred, it was considered relevant to expand
surveillance to improve the spatial resolution of the
risk assessment. The experiment involved several IoT
nodes powered by RIOT OS (Baccelli et al., 2015),
which is an open-source and used to manage wireless
communications, sleep-wake cycles, sensor measure-
ments and local processing. In this setup, we utilize
real sensors, specifically temperature (Hygrovue10
2
)
and wetness (LWS
3
) sensors. These sensors provided
the input values that were essential for the infection
model we employed.
A main node was responsible for reading data
from sensors and processing it locally. It utilized
a mechanism to enroll neighboring nodes, which
helped expand the spatial resolution of monitoring.
Based on this analysis, it determined whether to ex-
tend tasks to collaborative nodes, which remained in
standby mode, waiting for instructions from the main
node. Upon receiving a request, these collaborative
nodes collected data from their sensors and performed
local analyses to contribute to the overall observa-
tion. Otherwise, they entered sleep mode. This ap-
proach tested the local analysis of environmental data
collected by a WSN. The data was stored locally for
reuse in subsequent cycles by the model implemented,
supporting long-term experimentation.
We implemented different behaviors across the
nodes. The observations revealed varying reductions
in battery levels. As shown in Fig. 1, the main node,
as previously described, coordinates the entire pro-
cess (presented in red). All collaborative nodes wait
for a request from the main node to collaborate, but
each follows one of the behaviors listed below:
• Sensors were activated only upon receiving a re-
quest from the main node (presented in grey).
2
https://s.campbellsci.com/documents/us/manuals/
hygrovue10.pdf
3
https://s.campbellsci.com/documents/us/manuals/lws.
pdf
Toward a More Realistic Energy Consumption Model for IoT Nodes in Extreme-Edge Computing Environments
71
• Sensors were activated every cycle, regardless
of the request from the main node (presented in
blue).
• No sensors (presented in green).
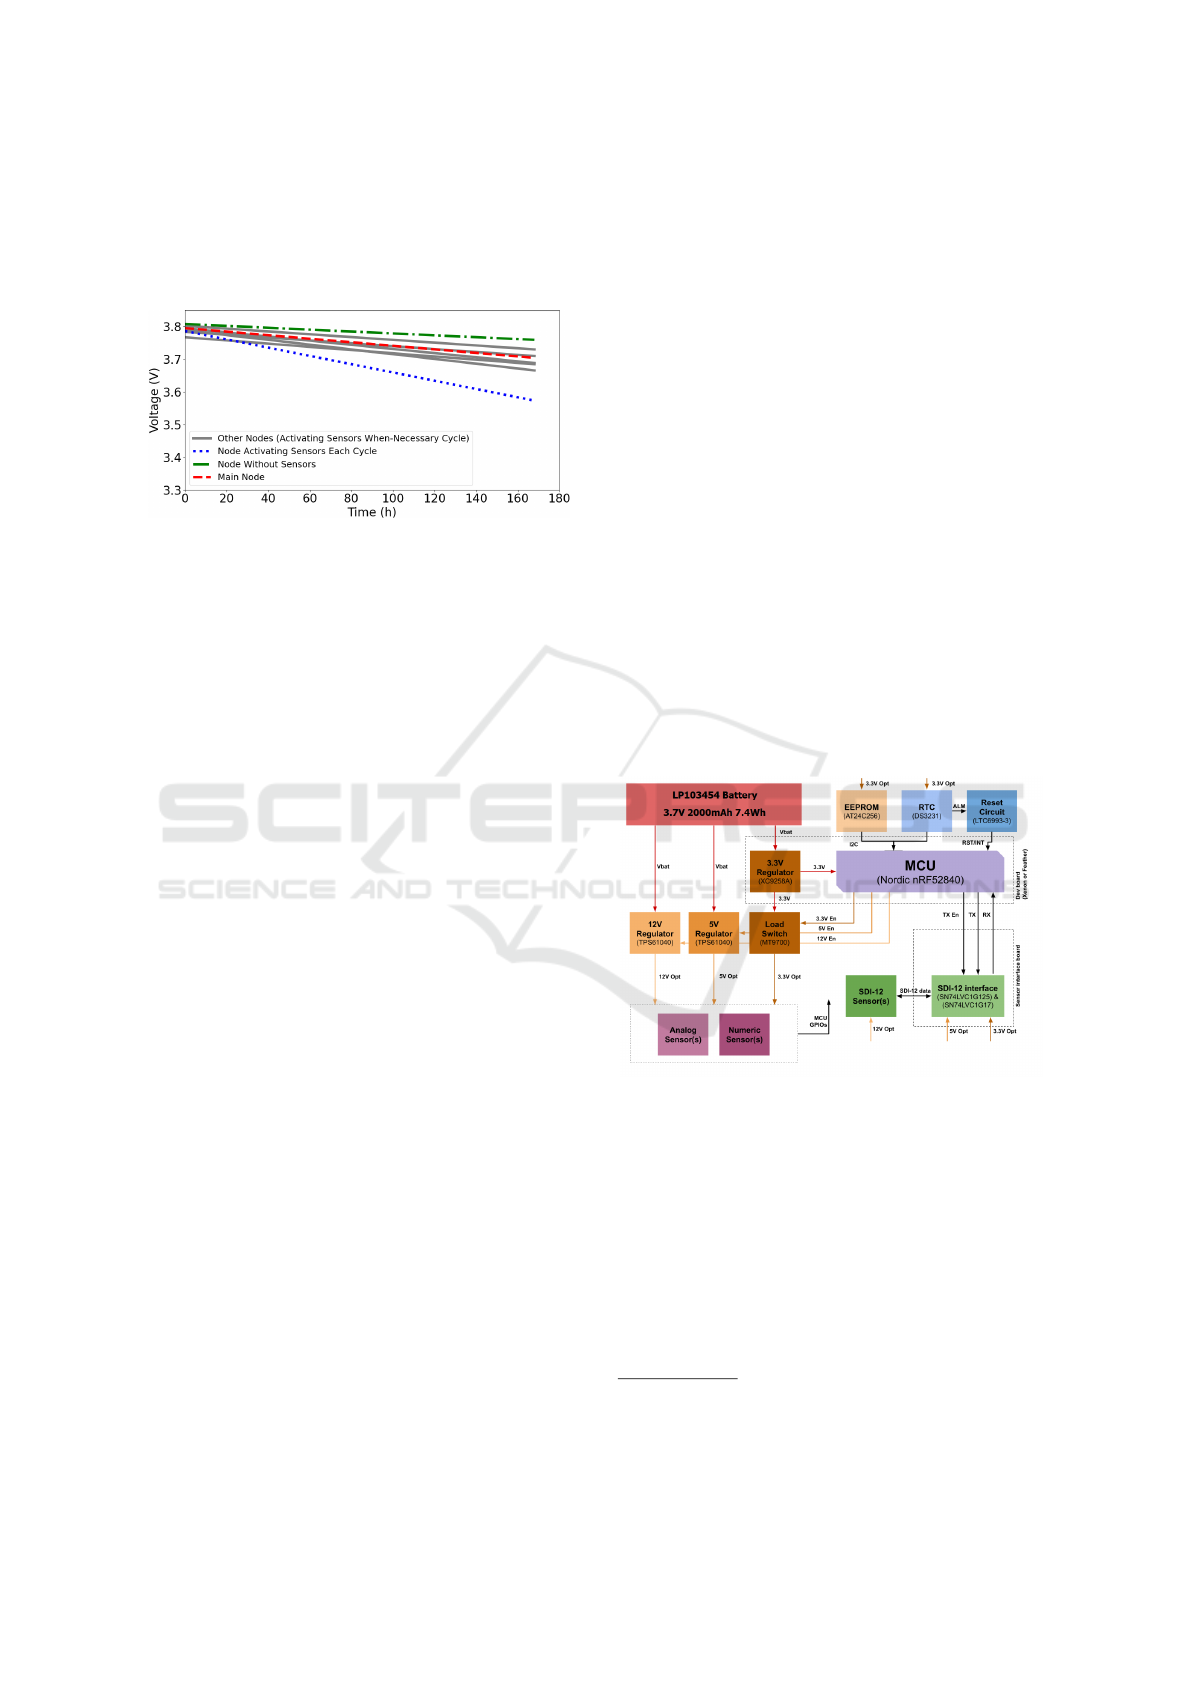
Figure 1: Voltage levels dropping difference between nodes
(Hammoud et al., 2024).
The observed results showed that the node with-
out sensors consumed the least power, as the absence
of sensors eliminated the power drain associated with
their activation and operation. Additionally, the col-
laborative node that activates sensors each cycle dis-
charged much faster than the main node. This differ-
ence is attributed to the waiting period for collabo-
ration requests, despite both nodes activating sensors
each cycle. Furthermore, the local computation of the
model used in the study had a negligible impact on
battery consumption, whereas sensor operation was
the primary driver of power consumption. This leads
us to conclude that the way IoT nodes are used for lo-
cal processing significantly influences overall power
consumption and is the key for determining energy
efficiency.
Building on this, to evaluate power consumption
across different components of the IoT node, we con-
ducted a series of measurements. Our aim is to de-
rive a deeper understanding of how various factors
contribute to energy usage, particularly in nodes with
extensive local processing in extreme-edge environ-
ments. This section examines the power consump-
tion components, describes our measurement setup
and highlight critical insights. These findings serve
as a basis for developing a model that more accurately
reflects the power needs of IoT nodes with extensive
local processing.
3.1 Power Consumption Components
The IoT node comprises several components that con-
tribute to its overall power consumption, including
processor/system, communication modules, memory
operations, sensors and peripherals. Each of these el-
ements plays a crucial role in the functionality of the
device and affects its energy efficiency. For the ex-
periment, we developed an additional board
4
, repre-
sented schematically in Fig. 2, that provides differ-
ent voltage levels and control mechanisms for various
types of sensors, with a focus on energy efficiency.
Using a complete operating system and advanced sen-
sors requires careful management to extend the bat-
tery life of the node. Therefore, the combination of
the micro-controller (MCU) and sensors should be
put into deep sleep mode as often as possible. In a
WSN monitoring crops, we can synchronize node op-
erations so that MCUs wake up together only during
brief observation and analysis periods. To facilitate
this effective duty cycle, we integrated a Real-Time
Clock (RTC) component into the additional board,
which keeps track of the current time independently
of the MCU. The RTC sends signal to a reset circuit,
which wakes the MCU and initiate its operation and
also manage interrupts from the watchdog timer to en-
sure that the MCU can recover from any unresponsive
states. Additionally, we developed a software mech-
anism within the RIOT OS that allows the MCU to
wake from deep sleep using a simple RTC alarm. Fur-
thermore, to manage data between cycles effectively,
we incorporated an external EEPROM for storing and
retrieving data.
Figure 2: Hardware architecture overview.
3.2 Measurements Setup
To evaluate power consumption across different com-
ponents of the IoT node, we used the Joulescope
5
in-
strument. It is designed specifically to overcome the
limitations of traditional energy measurement tech-
niques, which can be costly, labor-intensive or expect-
ing errors. The ability of Joulescope to measure cur-
rent and voltage with precision allows it to compute
power, energy, and charge accurately. This setup pro-
vides high-resolution insights into the power usage
4
The hardware architecture design will soon be released
as open-source.
5
https://www.joulescope.com/
IoTBDS 2025 - 10th International Conference on Internet of Things, Big Data and Security
72
of our IoT nodes, efficiently capturing wide current
ranges and rapid consumption fluctuations, all while
allowing the device to operate normally. Joulescope
software was used for data logging and analysis, en-
abling us to gain detailed insights into the power con-
sumption characteristics. The primary aim of our
measurements was to precisely capture the entire cy-
cle of the IoT node and attribute power consumption
to its respective sources. Measurements were con-
ducted for the duration of the operational (active) cy-
cle of the node.
To achieve enhanced precision in low-power mea-
surements, we employed a 4-wire Kelvin connection
(Fig. 3), as outlined in the Joulescope documenta-
tion
6
. This approach involved conducting measure-
ments for the target device, which is the IoT node in
our case, as well as its subsystems, particularly the
sensors. This method minimizes the effects of lead
and contact resistance, allowing for more reliable data
collection. Key metrics captured during the measure-
ments included current, voltage, power and cumula-
tive energy over time. These parameters were selected
to accurately represent typical operational conditions
of the IoT node.
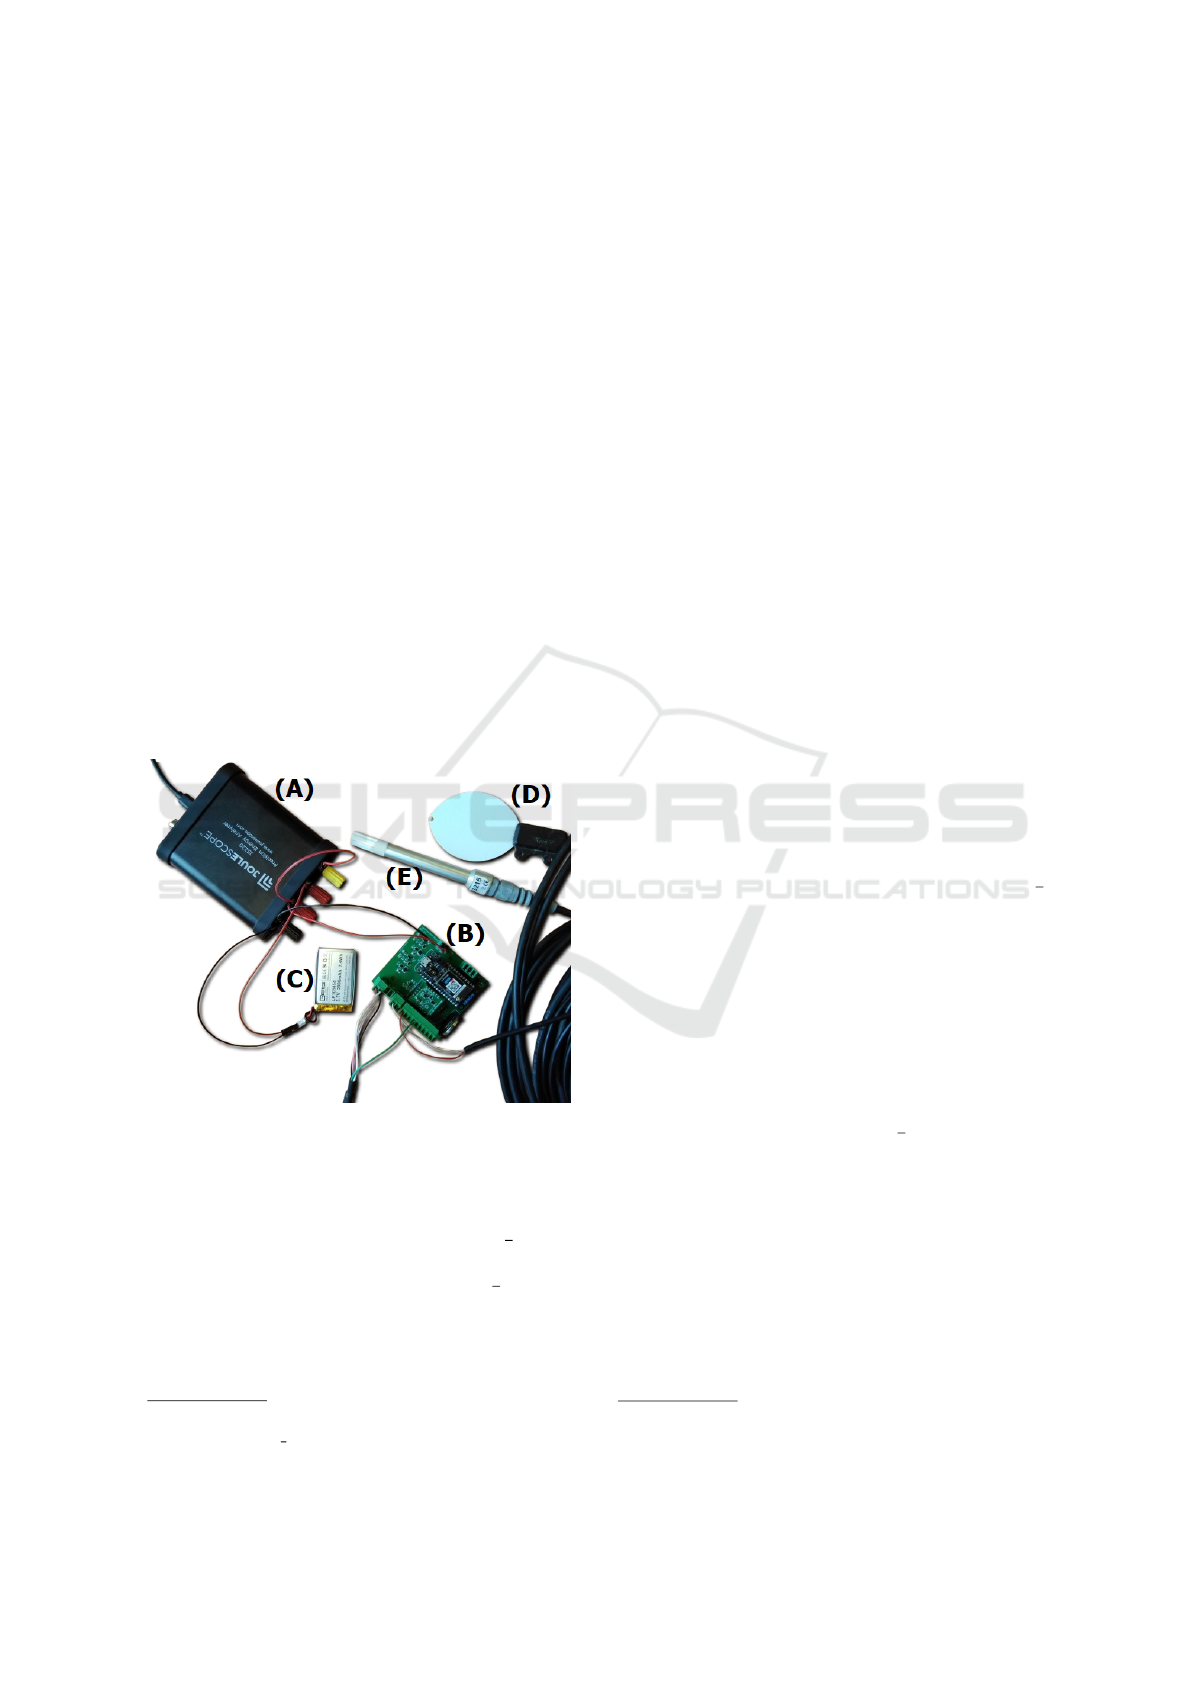
Figure 3: Temperature (E) and wetness (D) sensors con-
nected to the IoT node (B), which is powered by the
LP103454 Battery (C) and measured using the Joulescope
instrument (A) with a four-wire Kelvin connection for ac-
curate energy measurements.
The Average (avg) values of the current I is then
extracted from the measurements for the whole calcu-
lations and simulations done. The usage of I is essen-
tial for accurate power calculations in DC circuits and
scenarios where the current fluctuates. The average
value provides a reliable representation of the over-
6
https://download.joulescope.com/products/JS220/
JS220-K000/users guide/
all current consumption, accounting for the variations
that occur during the operation of an IoT node.
3.3 Experimental Investigation by
Empirical Measurements
We measured the operational cycles of both the main
node and the collaborative nodes. This investigation
aimed to assess the power consumption associated
with the functions mentioned in the literature, per-
formed by each node during their respective cycles. In
this part, we focus on the measurements of the collab-
orative node, in the case where no request is received
from the main node. The behavior of the collaborative
node here consists of waking up, waiting on the radio
interface for a request from the main node, and en-
tering sleep mode due to the absence of an extension
request.
3.3.1 Radio Interface Measurements
Since measuring the power consumption of the radio
interface independently is challenging due to its inte-
gration within the circuit of the IoT node, according
to the MCU datasheet
7
, the radio interface consumes
an average operating current of 6 to 20 mA when the
micro-controller is on and the radio is active. Nev-
ertheless, our power consumption measurements for
the radio interface, presented in Fig. 4, show that
both sending and receiving (waiting on the radio inter-
face) operations exhibit the same average current of I
= 6.09 mA. These measurements highlight the energy
demands during communication cycles, with commu-
nication being one of the main sources of power con-
sumption.
3.3.2 Sleep-Mode Measurements
The sleep mode duration, which occurs between cy-
cles where the collaborative node wakes up to per-
form its tasks, shows that the node consumes minimal
power, with an average current of I = 0.095 mA, As
depicted in Fig. 5. This low power usage highlights
the efficiency of the sleep mode in reducing overall
energy consumption during idle periods.
3.3.3 Sensors Measurements
After examining the deviations in power consumption
of a collaborative node with the described behavior,
we found that the sensors connected to the IoT node
consumes power not only during data collection but
7
https://docs.particle.io/assets/pdfs/datasheets/
xenon-datasheet.pdf
Toward a More Realistic Energy Consumption Model for IoT Nodes in Extreme-Edge Computing Environments
73
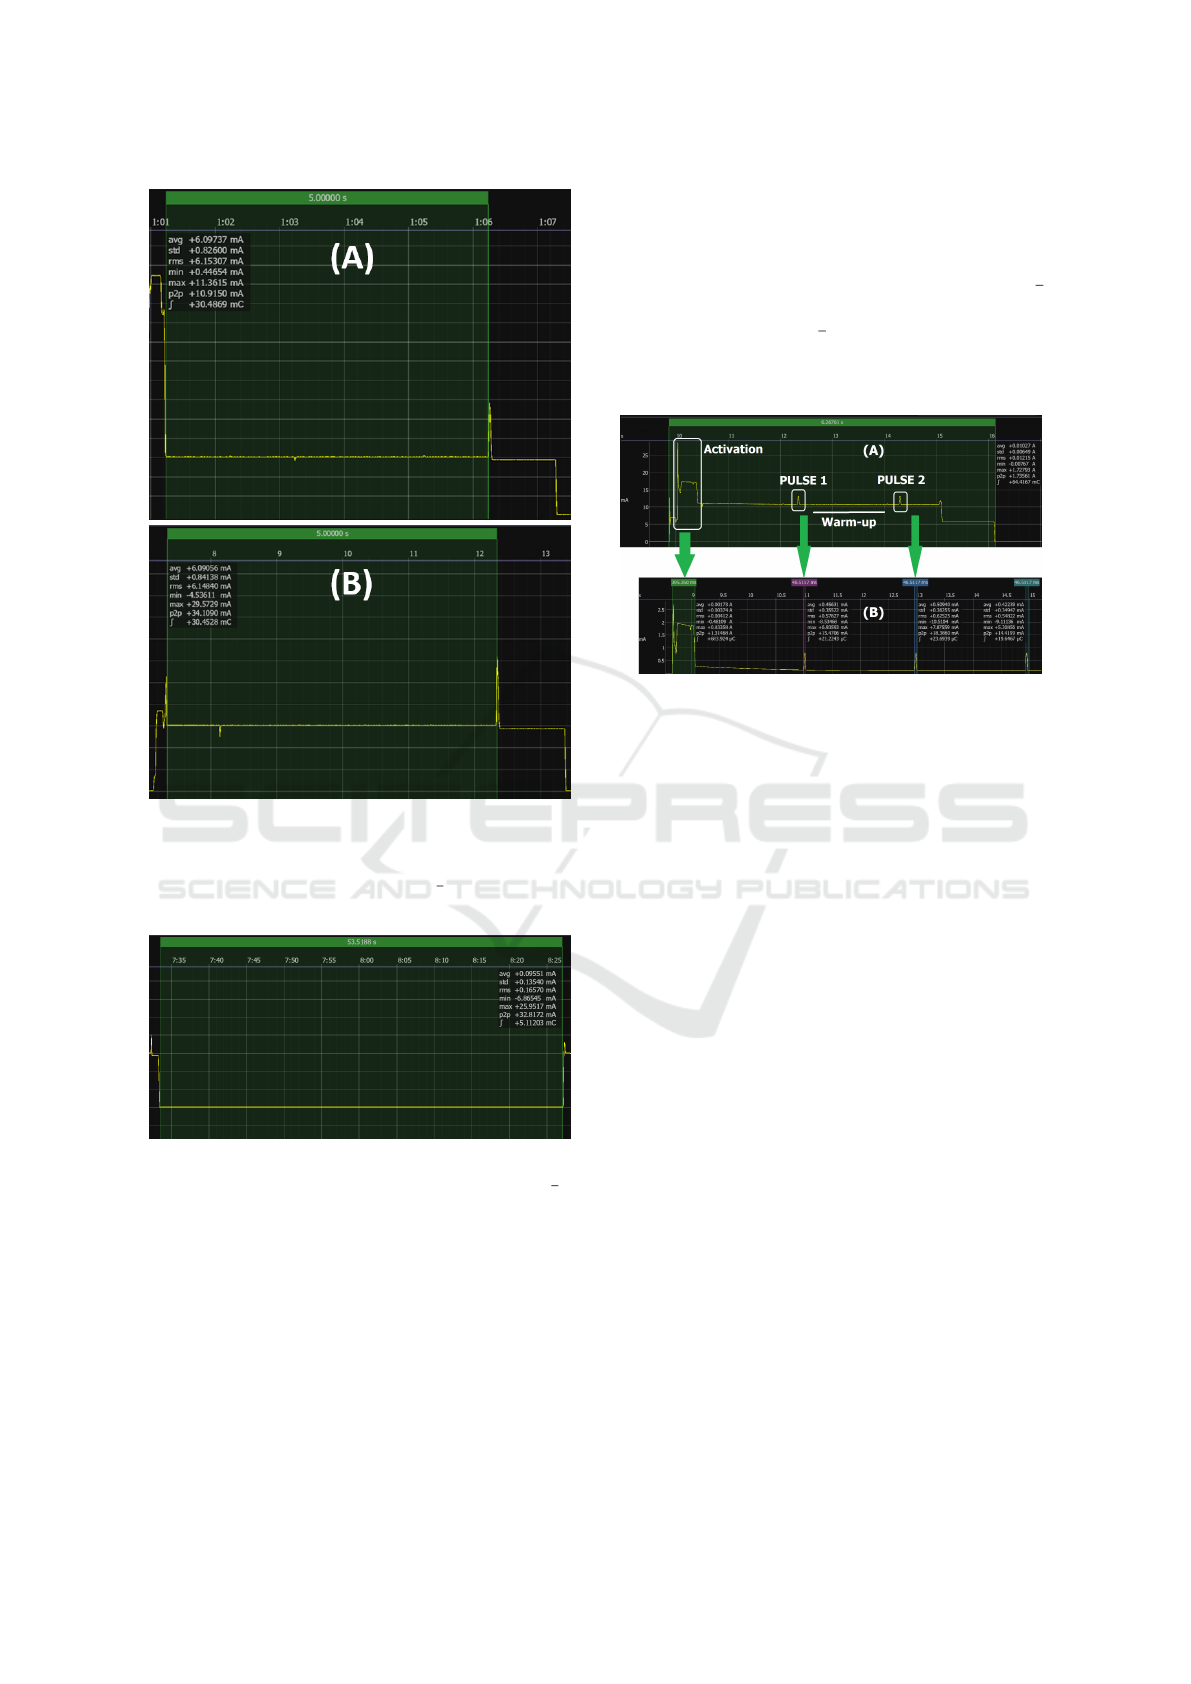
Figure 4: Power consumption measurements for (A) send-
ing on the radio interface by the main node when extending
requests to collaborative nodes, and (B) listening on the ra-
dio interface by the collaborative node while awaiting the
request, both with an average current of I = 6.09 mA.
Figure 5: Sleep mode duration between two cycles, high-
lighting the minimal power consumption of the collabora-
tive node during idle periods, with an average current of I =
0.095 mA.
also during its activation phase. This observation was
confirmed through independent measurements of the
power consumption of sensors. After initial activa-
tion, the temperature sensor continues to operate in
a mode that consumes power, even when no data is
being collected, as presented in Fig. 6. This period
is characterized by pulse activity, with the time inter-
vals between these pulses referred to as the warm-up
period. The warm-up phase is necessary before any
readings can be taken, as the sensor must be activated
and stabilized before performing the actual measure-
ments. For wetness sensor, measurements show that
it maintains a stable average power consumption of I
= 4.15 mA under dry conditions. However, this con-
sumption increases up to I = 7.5 mA when the surface
of the sensor is saturated with water, such as during
rainfall.
Figure 6: Power consumption of the IoT node, highlighting
the contribution of the temperature sensor (A), and showing
its independent power consumption in (B).
In scenarios where sensors are not in use, as
shown in Fig. 6-A and Fig. 7-A, activating them is
unnecessary. For that, and since we have a fine con-
trol over the power of the IoT board, we applied a
mechanism that powers the sensors only when needed
(when collaboration request is received). Then, we
conducted additional measurements while applying
this mechanism. The result, as illustrated in Fig. 7-
B, shows an optimization in the power consumption
measurements of an IoT node. Moreover, it displayed
two distinct peaks, one at the beginning and another
at the end of the process. These peaks were directly
attributed to memory activity, specifically during the
write and read operations for the minimal data re-
quired for the experiment, consisting of 20 records
(values).
Nevertheless, the measurements revealed that
power consumption of the node used in the experi-
ment increased progressively over time. The reason
was related to the memory operations since the node
incrementally stored data in memory with each wake-
up cycle.
3.3.4 Memory Measurements
We continued to assess power consumption while
operating with larger data records. Notably, when
we reached 500 records, the power consumption re-
mained consistent. Therefore, we subsequently mea-
sured the power consumption while storing and re-
IoTBDS 2025 - 10th International Conference on Internet of Things, Big Data and Security
74
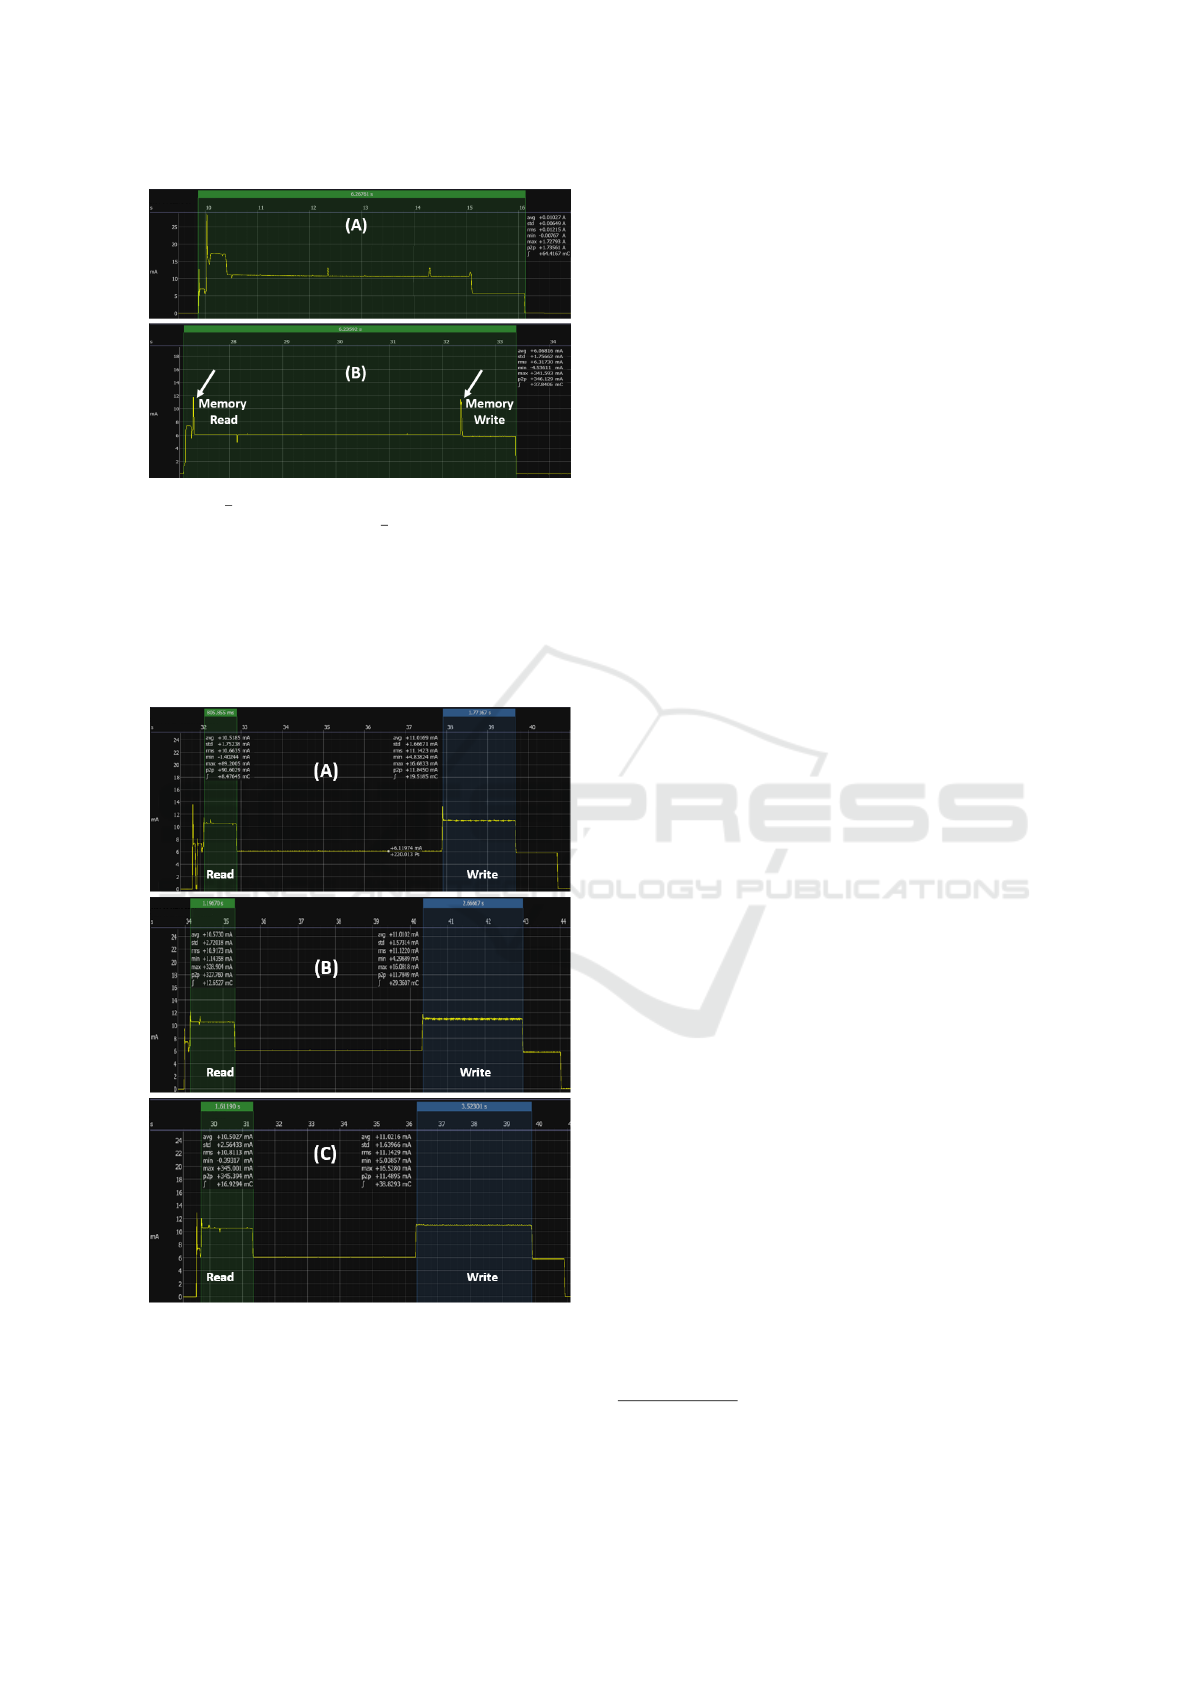
Figure 7: Before applying the mechanism (A), the node
consumes I = 10.27 mA for 6.2 sec. After applying the
mechanism (B), node consumes I = 6.06 mA for 6.2 sec.
trieving 2000, 3000, and 4000 records, as shown in
Fig. 8. Although the current consumption in mA
for the memory operations remain approximately the
same, the increased duration of these operations leads
to higher total power consumption.
Figure 8: Power consumption measurements for memory
read (green - left interval) and write (blue - right interval)
operations, where (A), (B), and (C) correspond to 2000,
3000, and 4000 records, respectively.
Measuring the power consumption of the
AT24C256 EEPROM memory independently was
challenging because it is integrated into the board,
making it difficult to extract its exact contribution
to the total power consumption of the IoT node.
According to its datasheet
8
, the time required for
read and write operations increases when the amount
of data increases. This extended time for operations
leads to increased power consumption because
longer active periods are needed, even if the power
consumption per unit of data remains constant. The
datasheet outlines several key factors related to the
performance of AT24C256, which are:
• Data Transfer Rate: The maximum speed is 400
kHz, meaning the time to read/write depends on
clock speed and data size.
• Write Cycle Time: Each write operation requires
about 5 ms for internal completion, during which
the EEPROM is busy.
• Sequential Writes: Writing in pages of up to 64
bytes reduces time, but each page still needs a stop
condition and incurs the write cycle delay.
• Data Retrieval: Sequential reads can be efficient,
but the speed is determined by the clock and data
size.
3.3.5 Energy Modeling of Memory Operations
While all these sources of power consumption are
well-documented and modeled in the literature, mem-
ory operations are often overlooked. For that, ac-
cording to the datasheet and these empirical measure-
ments, the total energy consumed by the memory dur-
ing its operation can be calculated by integrating the
power consumption over the time period of interest.
ε
memory
is given by eq. 17:
ε
Mem
(0,t) =
Z
t
0
P
Mem
(t)dt (17)
where:
P
Mem
(t) =
P
read,m
for t
read-start
≤ t < t
read-end
P
write,m
for t
write-start
≤ t < t
write-end
P
standby,m
for t
standby-start
≤ t < t
standby-end
(18)
It can be expressed as the sum of the energy
consumed during the read, write and standby op-
erations, where standby duration T
standby
= T
total
−
(T
read
+ T
write
). Therefore, the integral can be split
8
https://ww1.microchip.com/downloads/en/
DeviceDoc/doc0670.pdf
Toward a More Realistic Energy Consumption Model for IoT Nodes in Extreme-Edge Computing Environments
75

into several parts, as shown in eq. 19:
Z
t
0
P
Mem
(t)dt =
Z
t
read-end
t
read-start
P
read,m
dt
+
Z
t
write-end
t
write-start
P
write,m
dt
+
Z
t
standby-end
t
standby-start
P
standby,m
dt
(19)
where the power during the read P
read
(eq. 20), write
P
write
(eq. 21) and standby P
standby
(eq. 22) operations
are calculated by:
P
read,m
= V · I
read,m
(20)
P
write,m
= V · I
write,m
(21)
P
standby,m
= V · I
standby,m
(22)
3.3.6 Memory Power Consumption Analysis
Through our empirical measurements and analysis,
we demonstrate that memory power consumption is
significant and plays a key role in IoT nodes oper-
ating in extreme-edge environments. We found that
these operations considerably impact the overall en-
ergy usage of IoT nodes, an aspect that has often been
overlooked in current studies.
4 EXTREME-EDGE ENERGY
MODEL
Existing models often assume a linear relationship be-
tween processing tasks and power consumption, ne-
glecting the non-linear effects introduced by mem-
ory access patterns. For that, a comprehensive power
model that accommodates both local processing and
traditional IoT scenarios can be developed. The ap-
proach integrates insights from the local process-
ing models and traditional power models. Specifi-
cally, the formulas used are derived from references
(Martinez et al., 2015), (
¨
Ozkaya and
¨
Ors, 2021) and
(
¨
Ozkaya and
¨
Ors, 2024), which provide a robust foun-
dation for our analysis. As an extension of these mod-
els, we introduce parameters P
Mem
and ε
Mem
(0, t),
representing the power and energy consumption as-
sociated with memory operations. By synthesizing
these aspects, we propose a generalized power and
energy model that encompass all IoT node opera-
tions across diverse behaviors and scenarios. The total
power of an IoT node is expressed as:
P
IoT-node
= n · P
cycle
= n · (P
Active,node
+ P
Sleep,node
)
(23)
where n is the number of cycles, and:
P
Active,node
= P
Sens
+ P
Act
+ P
Proc
+ P
Comm
+ P
Sys
+ P
Mem
(24)
The energy consumed during the sleep and active
states of the IoT node are given by:
ε
Sleep,node
(0,t) =
Z
t
0
P
Sleep,node
(t)dt (25)
ε
Active,node
(0,t) =
R
t
0
P
Sens
(t) + P
Act
(t) + P
Proc
(t)+
P
Comm
(t) + P
Sys
(t) + P
Mem
(t)
dt
(26)
So, we can express it by summing the energies of
the factors as:
ε
Active,node
(0,t) = ε
Sens
(0,t) + ε
Act
(0,t) + ε
Proc
(0,t)
+ ε
Comm
(0,t) + ε
Sys
(0,t) + ε
Mem
(0, t)
(27)
The total energy consumed by the IoT node, com-
bining both active and sleep modes, is represented by
the eq. 28:
ε
IoT-node
(0,t) = ε
Active,node
(0,t) + ε
Sleep,node
(0,t)
(28)
5 COMPARATIVE SIMULATION
AND ANALYSIS
Following the measurements conducted and the de-
velopment of the energy model, we performed a
simulation to evaluate and compare the energy con-
sumption of an IoT node when dealing with different
amounts of data. This simulation considers existing
models in parralel with our proposed model, which
accounts for memory power consumption.
We measured power consumption for each opera-
tional state of the IoT node, including wake-up, mem-
ory operations (read/write), waiting on the radio in-
terface, and sleep. Using these measurements, we
implemented our model in Python to simulate power
consumption under different cases. The simulation
is based on a battery specification of 3.7 V and 2000
mAh, with a cutoff voltage of 3.25 V. It examines four
cases: one utilizing existing models and three em-
ploying our proposed model, which includes scenar-
ios operating with fixed minimal data (20 Records),
fixed large data (4000 Records), and incremental data
volume. The sleep mode is set for 2 minutes and wait-
ing on the radio interface for 5 seconds in this simu-
lation.
The results of the simulation highlight significant
differences in node lifetime, as illustrated in Fig. 9. It
demonstrate that our model, which accounts for mem-
ory power consumption, predicts a shorter lifespan
IoTBDS 2025 - 10th International Conference on Internet of Things, Big Data and Security
76
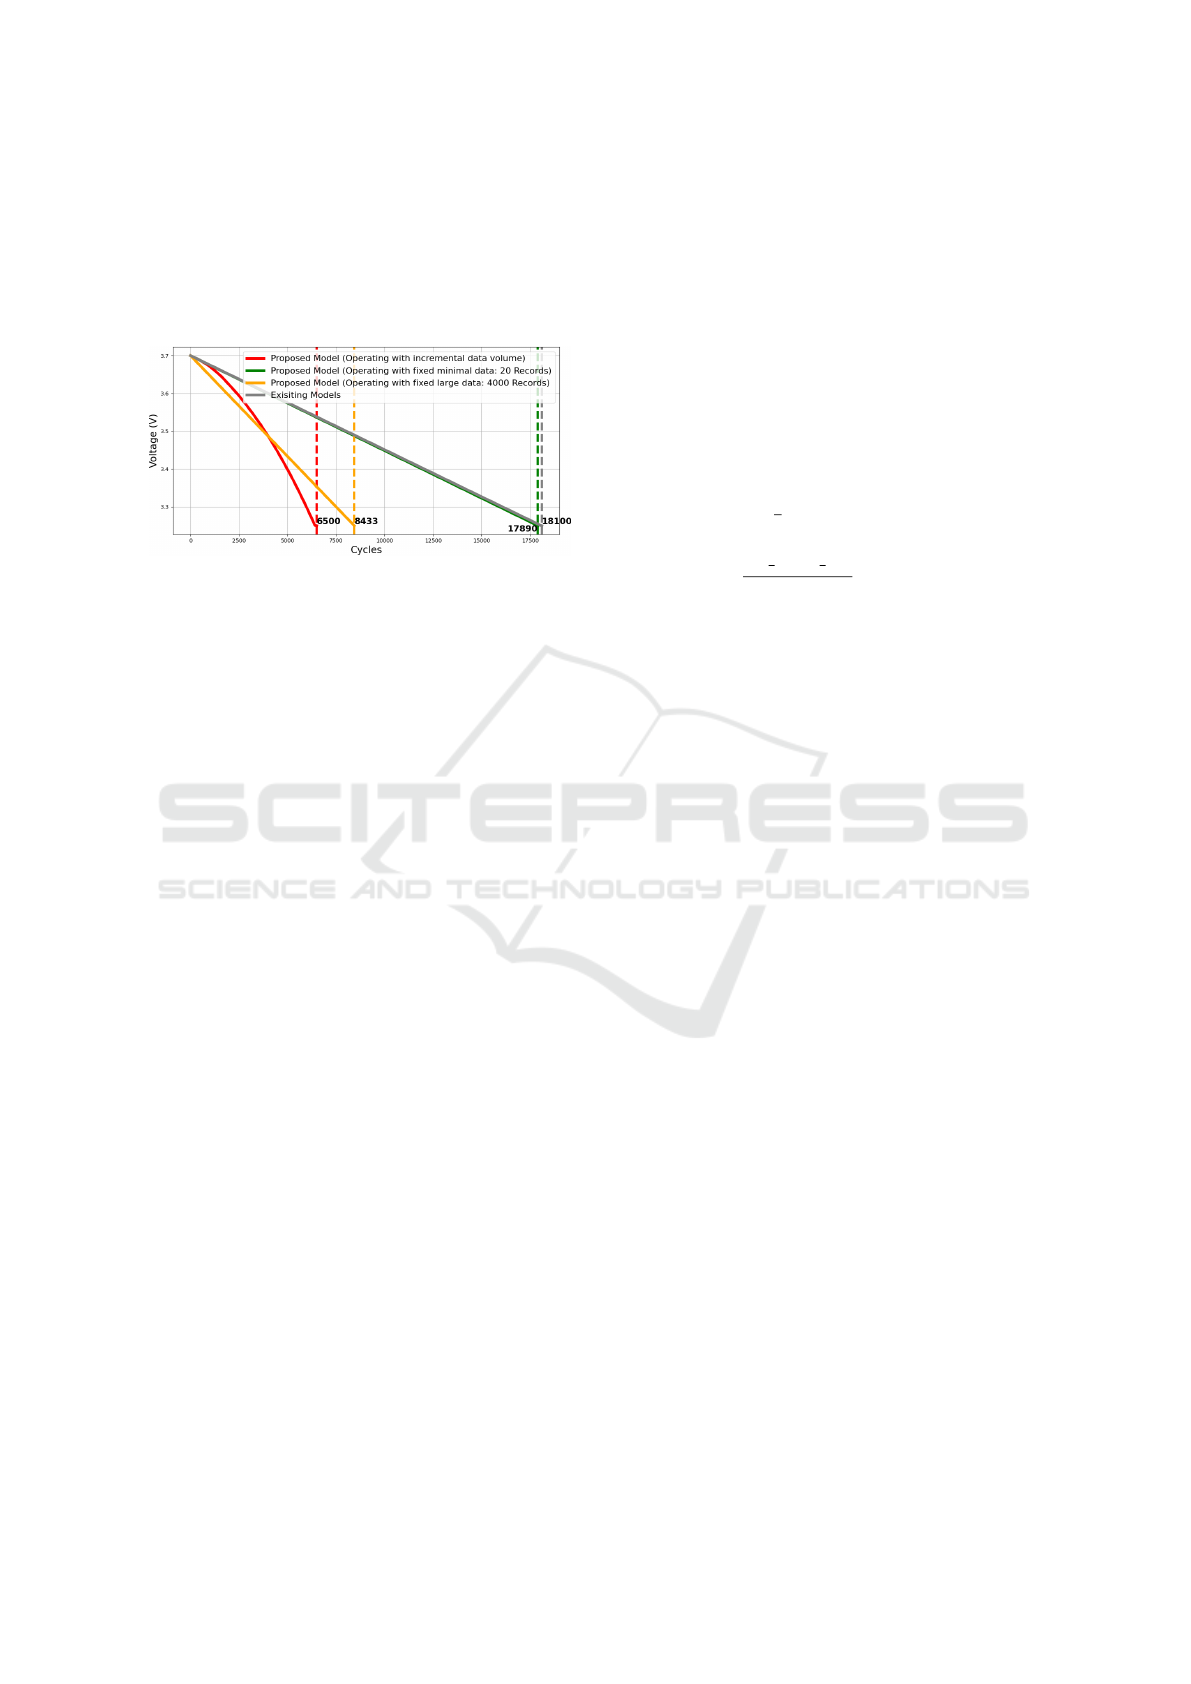
compared to existing models that overlook this crit-
ical aspect. This difference highlights the need to in-
clude memory operations in energy consumption as-
sessments, as ignoring them can create unrealistic ex-
pectations in studies that do not take their impact into
account.
Figure 9: Simulated lifetime comparison of IoT nodes
showing voltage drop over cycles across existing mod-
els and proposed model, highlighting the impact of mem-
ory operations (even though the number of records is very
small) on overall energy efficiency.
Given that IoT nodes frequently collect data for
possible future use, our observations indicate that
nodes storing and retrieving data incrementally have
the shortest lifetime, as illustrated by the red curve
in Fig. 9. This is primarily due to the proportional
increase in power consumption associated with incre-
mental data storage as discussed before, especially in
cases where retaining and accessing historical data is
necessary. For that, data management is a key com-
ponent that must be considered for power consump-
tion in extreme edge computing with low-power IoT
nodes. To address this challenge, we plan to design
an efficient data management mechanism that opti-
mizes memory operations, thereby reducing power
consumption and extending node lifetime.
6 DATA MANAGEMENT FOR
OPTIMIZING MEMORY
POWER CONSUMPTION
Data management techniques in IoT context are used
to manipulate data effectively, aiming to reduce la-
tency, minimize redundancy, and lower power con-
sumption (Krishnamurthi et al., 2020). For instance,
existing data aggregation methods, such as tree-based
and cluster-based approaches, summarize data from
multiple nodes primarily to minimize transmissions
to a remote server, thereby reducing network traf-
fic. These methods focus on collective data aggre-
gation rather than enabling each individual node to
perform data manipulation directly on-node (Yadav
and Gupta, 2020). To effectively manage data and
mitigate memory power consumption, our proposed
mechanism focuses on summarizing data directly on
the node to optimize how data is stored and retrieved
from locally from memory. It is designed to retain all
collected data while only accessing essential informa-
tion during normal operation cycles. When an event
occurs, the node will retrieve from memory the rele-
vant historical data to ensure comprehensive analysis.
After utilizing this historical data (D
h
), the node sum-
marizes it by extracting key metrics, such as:
1. First Element: x
start
= D
h
1
2. Middle Element:
x
middle
=
D
h
n
2
+ 1
, if n is odd
D
h
[
n
2
]
+D
h
[
n
2
+1
]
2
, if n is even
3. Last Element: x
last
= D
h
n
4. Minimum Value: x
min
= min{D
h
i
}, 1 ≤ i ≤ n
5. Maximum Value: x
max
= max{D
h
i
}, 1 ≤ i ≤ n
6. Total Number of Values: n
This summarization process is crucial for manag-
ing data efficiently, especially as subsequent events
may also require historical data retrieval. By sum-
marizing data after each event, the node minimizes
the volume of data that needs to be retrieved in fu-
ture cycles. If the application requires summarized
data for each duration before an event, the node can
perform this summarization continuously, allowing
for multiple summarized data to be generated. This
approach focuses on optimizing memory operations,
thus reducing power consumption. Fig. 10 illustrates
the data storage and retrieval processes within a node
across two scenarios: one without data management,
which presents incremental power consumption due
to incremental data volume, and one with an efficient
data management mechanism, which maintains stable
power consumption.
To validate the effectiveness of the proposed data
management mechanism, we conducted a simulation
using Python to compare the lifetimes of nodes op-
erating at the extreme edge of the network across two
different operational conditions. In the first condition,
the node retrieves and stores incremental data, where
the data volume increases with each cycle. The sec-
ond condition implements the proposed data manage-
ment mechanism in two cases, mentioned previously,
which manages data efficiently and maintains stable
power consumption. In the first case, summarized
data is generated at each event, with each summary
stored for use in subsequent events. As a result, at the
end, there are multiple of summarized data, each rep-
resenting the metrics for its corresponding event. In
Toward a More Realistic Energy Consumption Model for IoT Nodes in Extreme-Edge Computing Environments
77
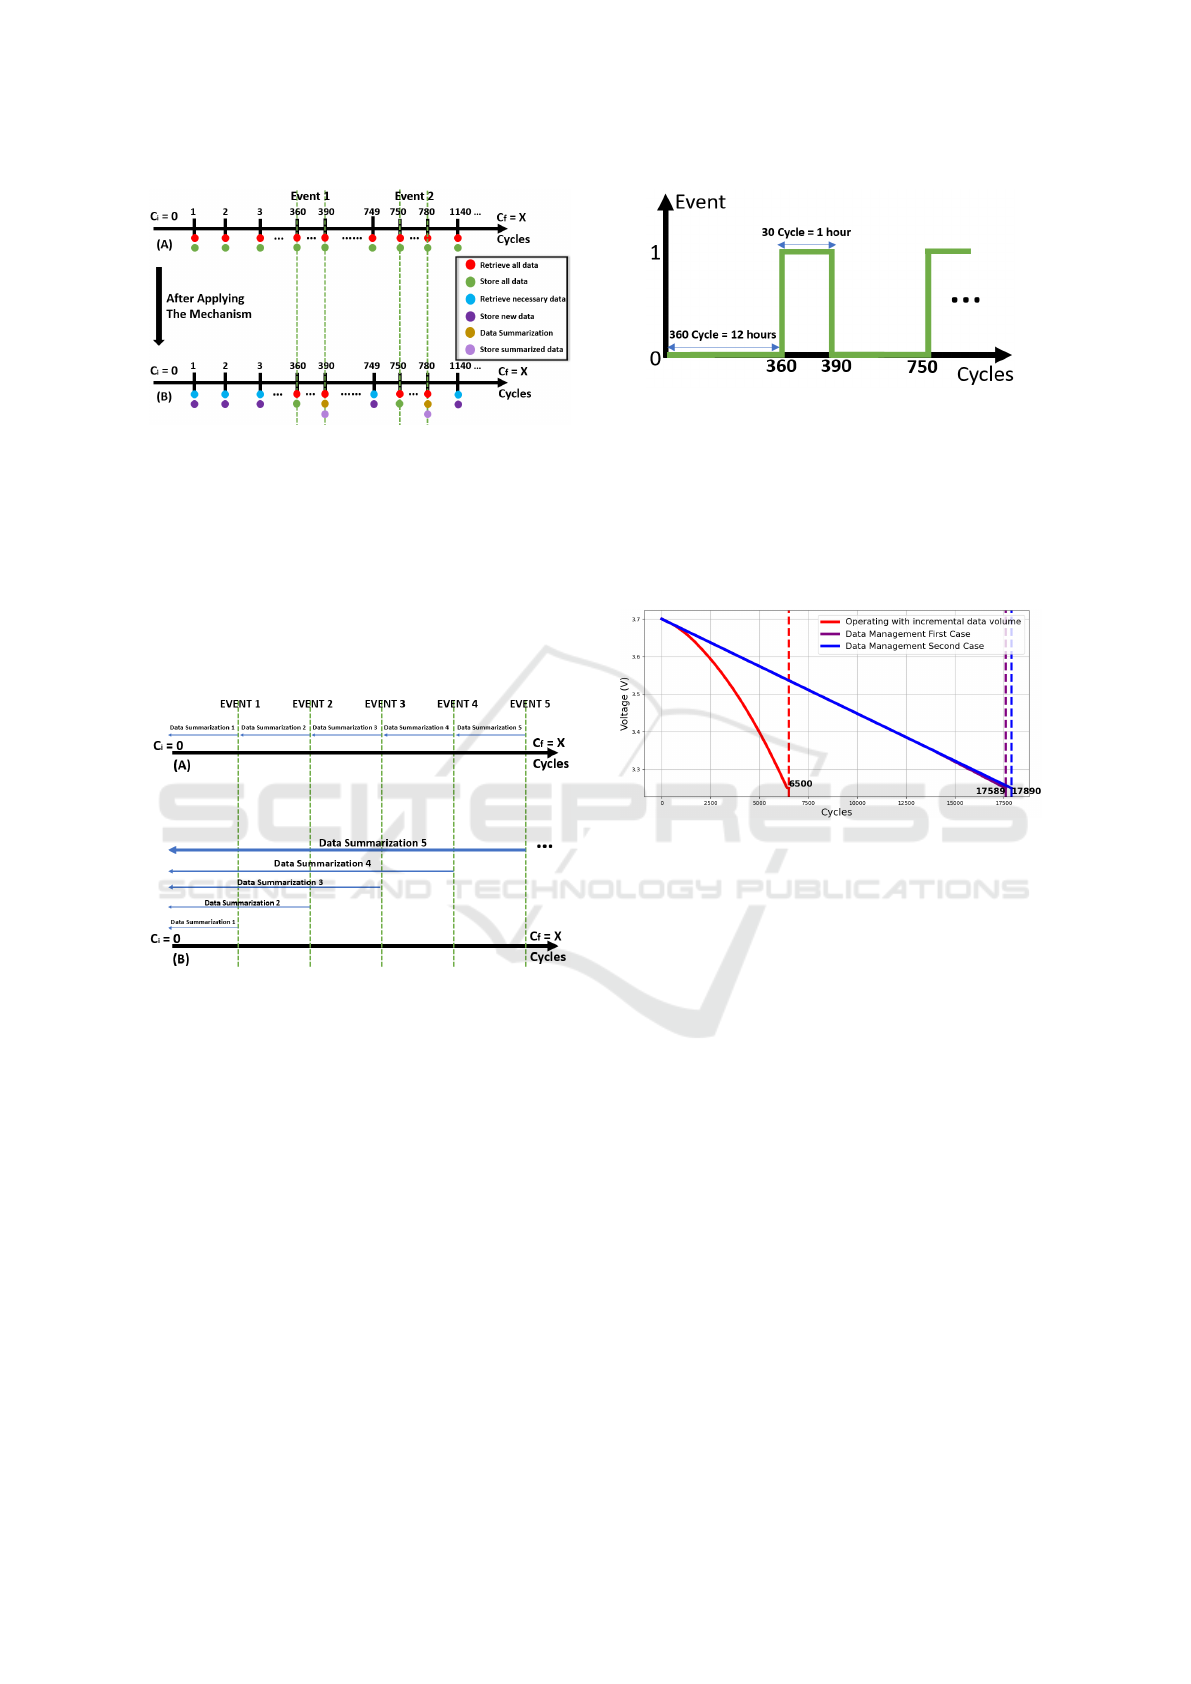
Figure 10: Comparison of data storage and retrieval pro-
cesses in a node. The x-axis indicates the number of cycles,
with (A) showing the scenario without data management
and (B) illustrating the scenario with data management.
the second case, the data is summarized during each
event, but the summaries from previous events are
fused together to create a single comprehensive sum-
marized data. This approach results in one summary
that integrates the summarized data from all events,
as highlighted in Fig. 11.
Figure 11: Data management strategies. (A) First case:
Each event generates its own summarized data, resulting in
multiple distinct summaries at the end of the process. (B)
Second case: Summaries from previous events are fused to-
gether, creating a single data summarization that integrates
information from all events.
The scenario of this simulation is an event occurs
every 360 cycles (equivalent to 12 hours), lasting for
30 cycles (1 hour) as shown in Fig. 12. This simu-
lation was based on our empirical measurements, uti-
lizing the previously mentioned battery specifications
of 3.7 V and 2000 mAh, with a cutoff voltage of 3.25
V. The sleep mode duration was set to 2 minutes and
waiting on the radio interface for 5 seconds.
As a result of this setup, the simulation reveals
a clear differences in node lifetime, as illustrated in
Fig. 13. Data management indicate that both cases
optimize power consumption and extend the opera-
tional lifespan of nodes compared to those operating
with incremental data volume. However, they differ
Figure 12: 390-cycles pattern used for simulation, illustrat-
ing periodic events: Each event occurs every 360 cycles
(equivalent to 12 hours) and lasts for 30 cycles (1 hour),
repeating consistently over time.
slightly, with one offering higher data precision but
requiring more power. To summarize the advantages
and disadvantages of each approach, we present the
table 1.
Figure 13: Simulated lifetime comparison of IoT nodes
showing voltage drop over cycles across a node operating
with incremental data volume and nodes using data man-
agement (First and Second cases), demonstrating that nodes
utilizing data management strategies last longer than relying
on incremental data volume.
7 CONCLUSION AND FUTURE
WORK
We presented an extended energy model for IoT
nodes, which incorporates memory-related energy
consumption alongside the traditional factors of com-
munication, processing, and sensing. By including
memory operations in the energy model, we demon-
strated a more comprehensive understanding of en-
ergy consumption patterns, providing insights that
can support more effective energy management strate-
gies in IoT applications. Furthermore, we proposed
a data management strategy that includes two cases
of data summarization. The first case creates detailed
summaries for each event, which improves clarity and
helps in data reconstruction. However, it requires
more power and memory than the second case, which
combines all events into a single summary. While
the second case is more energy-efficient and uses less
IoTBDS 2025 - 10th International Conference on Internet of Things, Big Data and Security
78

Table 1: Advantages and disadvantages of data summariza-
tion cases.
Data
Summariza-
tion
Advantages Disadvantages
(A) First Case
1.Produces summary for
each event
2.Helps understand
and reconstruct data
with less error
3.Allows for detailed
analysis of the data of
each event
1.Consumes more power
than Second Case
2.Requires more mem-
ory space for storing
multiple summaries
(B) Second Case
1.Creates a single sum-
mary that combines all
events
2.Consumes less power
than First Case (same as
if operating with fixed
minimal data, see Fig. 9)
3.Does not require
additional memory
space
1.Less clarity and under-
standing than First Case
2.May lose some
event-specific details in
the summary
memory, it may lose some specific details of individ-
ual events. Our simulations demonstrated that both
approaches optimize power consumption instead of
relying on incremental data volume. This work con-
tributes to the development of energy-efficient IoT
systems, emphasizing the need to consider all opera-
tional aspects for optimizing device performance and
longevity.
As a future research, we plan to conduct a real-
world experiment to validate the simulation results,
ensuring the practical applicability and accuracy of
our findings. In addition, we aim to investigate the
optimization of power consumption within the con-
text of communication (data transmission and recep-
tion) and peripheral components such as voltage reg-
ulators and real-time clocks (RTC). Notably, our mea-
surements indicate that using communication for data
transfer on our platform consumes less power than di-
rectly connecting and activating sensors for data col-
lection. This finding highlights potential benefits of
sharing sensor data rather than distributing or activat-
ing sensors over the network. Our goal is to identify
and implement specific strategies to further reduce
overall power consumption and costs in IoT appli-
cations, enhancing devices efficiency and extending
battery life.
REFERENCES
Alsharif, M. H., Anabi, H. K., Jahid, J. A., Kannadasan, R.,
Singla, M. K., Gupta, J., and Geem, Z. W. (2024). A
comprehensive survey of energy-efficient computing
to enable sustainable massive iot networks. Alexan-
dria Engineering Journal, 91:12–29.
Baccelli, E., Hahm, O., Petersen, H., and Schleiser, K.
(2015). Riot and the evolution of iot operating sys-
tems and applications. ERCIM News, 2015(101).
Bouguera, T., Diouris, J.-F., Chaillout, J.-J., Jaouadi, R.,
and Andrieux, G. (2018). Energy consumption model
for sensor nodes based on lora and lorawan. Sensors,
18(7):2104.
Brayner, A. and Menezes, R. (2007). Balancing energy con-
sumption and memory usage in sensor data process-
ing. In Proceedings of the 2007 ACM symposium on
Applied computing, pages 935–939.
De Donno, M., Tange, K., and Dragoni, N. (2019). Founda-
tions and evolution of modern computing paradigms:
Cloud, iot, edge, and fog. IEEE access, 7:150936–
150948.
Hammoud, H., Weis, F., Langrume, C., Leclerc, M., and
Bonnin, J.-M. (2024). Monitoring of in-field risk of
infection events by foliar pathogens using smart iot
nodes. In 2024 IEEE International Conferences on
Internet of Things (iThings) and IEEE Green Comput-
ing & Communications (GreenCom) and IEEE Cyber,
Physical & Social Computing (CPSCom) and IEEE
Smart Data (SmartData) and IEEE Congress on Cy-
bermatics, pages 324–330. IEEE.
Jacob, A. M., Rao, S. V., and Pillai, S. S. (2016). Re-
ducing energy consumption by cross layer design in
wireless sensor networks. In 2016 International Con-
ference on Control, Instrumentation, Communication
and Computational Technologies (ICCICCT), pages
93–97. IEEE.
Krishnamurthi, R., Kumar, A., Gopinathan, D., Nayyar, A.,
and Qureshi, B. (2020). An overview of iot sensor data
processing, fusion, and analysis techniques. Sensors,
20(21):6076.
Li, Y., Zhou, Z., Xue, X., Zhao, D., and Hung, P. C. (2023).
Accurate anomaly detection with energy efficiency in
iot–edge–cloud collaborative networks. IEEE Internet
of Things Journal, 10(19):16959–16974.
Lin, W., Shi, F., Wu, W., Li, K., Wu, G., and Mohammed,
A.-A. (2020). A taxonomy and survey of power mod-
els and power modeling for cloud servers. ACM Com-
puting Surveys (CSUR), 53(5):1–41.
Martinez, B., Monton, M., Vilajosana, I., and Prades, J. D.
(2015). The power of models: Modeling power con-
sumption for iot devices. IEEE Sensors Journal,
15(10):5777–5789.
Merino, P., Mujica, G., Se
˜
nor, J., and Portilla, J. (2020). A
modular iot hardware platform for distributed and se-
cured extreme edge computing. Electronics, 9(3):538.
Moschitta, A. and Neri, I. (2014). Power consumption as-
sessment in wireless sensor networks. In ICT-Energy:
Concepts Towards Zero-Power Information and Com-
munication Technology. IntechOpen.
Rose, K., Eldridge, S., and Chapin, L. (2015). The internet
of things: An overview. The Internet Society (ISOC),
80(15):1–53.
Sawaguchi, S., Christmann, J.-F., and Lesecq, S. (2021).
Highly adaptive linear actor-critic for lightweight
Toward a More Realistic Energy Consumption Model for IoT Nodes in Extreme-Edge Computing Environments
79

energy-harvesting iot applications. Journal of Low
Power Electronics and Applications, 11(2):17.
Sittalatchoumy, R., Kanthavel, R., Seetharaman, R., et al.
(2016). Power analysis of sensor node using simula-
tion tool. Circuits and Systems, 7(13):4236.
Vasconcelos, D. R., Andrade, R. M. C., Severino, V., and
Souza, J. N. D. (2019). Cloud, fog, or mist in iot?
that is the question. ACM Transactions on Internet
Technology (TOIT), 19(2):1–20.
Yadav, R. K. and Gupta, M. (2020). Data aggregation algo-
rithms in iot: An organized evaluation of the literature.
In 2020 Third International Conference on Smart Sys-
tems and Inventive Technology (ICSSIT), pages 300–
304. IEEE.
You, S., Eshraghian, J. K., Iu, H. C., and Cho, K. (2021).
Low-power wireless sensor network using fine-grain
control of sensor module power mode. Sensors,
21(9):3198.
¨
Ozkaya,
¨
O. and
¨
Ors, B. (2021). System-level, model-based
power estimation of IoT nodes. In 2021 IEEE 7th
World Forum on Internet of Things (WF-IoT), pages
403–408. IEEE.
¨
Ozkaya,
¨
O. and
¨
Ors, B. (2024). Model-based, fully sim-
ulated, system-level power consumption estimation
of IoT devices. Microprocessors and Microsystems,
105:105009.
IoTBDS 2025 - 10th International Conference on Internet of Things, Big Data and Security
80
