
Convolutional Neural Networks Enriched by Handcrafted Attributes
(Enriched-CNN): An Innovative Approach to Pattern Recognition in
Histological Images
Luiz Fernando Segato dos Santos
1
a
, Leandro Alves Neves
1 b
, Alessandro Santana Martins
2 c
,
Guilherme Freire Roberto
3
d
, Tha´ına Aparecida A zevedo Tosta
4 e
and Marcelo Zanchetta do Nascimento
5
f
1
Department of Computer Science and Statistics (DCCE), S˜ao Paulo State University (UNESP),
S˜ao Jos´e do Rio Preto, Brazil
2
Federal Institute of Triˆangulo Mineiro (IFTM), Ituiutaba, Brazil
3
Institute of Mathematics and Computer Science (ICMC), University of S˜ao Paulo (USP), S˜ao Carlos, Brazil
4
Federal University of S˜ao Paulo (UNIFE SP), S˜ao Jos´e dos Campos, Brazil
5
Faculty of Computer Science (FACOM), Federal University of Uberlˆandia (UFU), Uberlˆandia, Brazil
Keywords:
Enriched Backpropagation, Fractal Techniques, Loss Functions, CNN Architectures, H&E Images.
Abstract:
This paper presents a novel method called Enriched-CNN, designed to enrich CNN models using handcrafted
features extracted from multiscale and multidimensional fractal techniques. These features are incorporated
directly into the loss function during model training through specific strategies. The method was applied to
three important histological datasets for studying and classif ying H&E-stained samples. Several CNN archi-
tectures, such as ResNet, InceptionNet, EfficientNet, and others, were tested to understand the enrichment
behavior in different scenarios. The best results achieved accuracy rates ranging fr om 93.75% to 100% for
enrichment situations involving only 3 to 5 features. This paper also provides significant insights into the
conditions that most contributed to the process and allowed competitiveness compared to the specialized liter-
ature, such as the possibility of composing models with minimal or no structural changes. This unique aspect
enables t he method to be applied to other types of neural architectures.
1 INTRODUCTION
Enriching co nvolutional models have been explored
and applied in histopathological con texts to improve
diagnostic su pport systems and pattern recognition
(Roberto et al., 2021; Longo et al., 2023; Tengu am
et al., 2024). This approa ch ha s yielded various b e n-
efits, such as improving model performanc e or re-
solving training issues like overfitting (Jaha n et al.,
2022). Some studies combine different types of at-
tributes aiming to enrich their models. The most well-
a
https://orcid.org/0009-0008-0851-4379
b
https://orcid.org/0000-0001-8580-7054
c
https://orcid.org/0000-0003-4635-5037
d
https://orcid.org/0000-0001-5883-2983
e
https://orcid.org/0000-0002-9291-8892
f
https://orcid.org/0000-0003-3537-0178
known attributes in this context are handcrafted and
deep-lear ned.
Among handcrafted attributes, appr oaches based
on multiscale and/or multidimensiona l fractal tech-
niques stand out, especially in the histop athology field
(Roberto et al., 2021; Ivanovici and Richard, 2011).
Deep-learned attributes, on the other hand, include
those obtain ed through convolutional neural networks
(CNN) (Nanni et al., 20 20). For instance, network
models are applied to image samples, and the val-
ues obtained during training enable the formation of
feature vectors. It is also crucial to highlight that
the training of these neural networks an d the opti-
mal representation o f data are facilitated by an algo-
rithm known as backpropagation, which strengthens
the most relevant weights throughout training. During
this stage, a cost function, also known as loss fun c-
tion, generates a scalar value indicating how well a
Santos, L. F. S., Neves, L. A., Martins, A. S., Roberto, G. F., Tosta, T. A. A. and Zanchetta do Nascimento, M.
Convolutional Neural Networks Enriched by Handcrafted Attributes (Enriched-CNN): An Innovative Approach to Pattern Recognition in Histological Images.
DOI: 10.5220/0013277300003929
In Proceedings of the 27th International Conference on Enterprise Information Systems (ICEIS 2025) - Volume 1, pages 467-478
ISBN: 978-989-758-749-8; ISSN: 2184-4992
Copyright © 2025 by Paper published under CC license (CC BY-NC-ND 4.0)
467

sample is classified. This value can be minim iz ed or
maximized by an optimizer, depending on the training
objective.
Some combina tions have integrated ha ndcrafted
and deep-lear ned attributes (Nanni et al., 2020).
These combinations have contributed to various ar-
eas (Zheng et al., 2 023), but some challenges still
persist, such as providing appropriate dimensions and
scale for the involved attributes (Cheng et al., 2023)
or preventing redundancy in combining handcrafted
and deep-learned features (Zhe ng et al., 2023). To ad-
dress these divergences in the combination process,
some modifications in the architectures are required,
resulting in more complex models with specific ad-
justments for each arc hitecture type (Zheng et al.,
2023).
On the other hand, enrichment can also be ex-
plored through backpropagation. This process o ffers
several strategies tha t incorporate rewards or penalties
directly into the loss function, depending on the train-
ing objective. The possible types of incorporation
into th e loss function primarily occur through sum-
based rules (Hosseini et al., 2023 ) or weighted sum -
based rules (Wu et al., 2023). The in formation incor-
porated in this process is usually backpropag a te d to
the n etwork to update the model weights (Diao et al.,
2023). Despite contributions on the topic in the med-
ical imaging field (Diao et al., 20 23), there is no re-
search that has explored model enric hment through
fractal descriptor s directly in the loss function to in-
vestigate model performance and training behavior.
Therefore, researching how mo dels could be en-
riched using handcrafted features such a s multiscale
and multidimensional fractal attributes, as well as
through the loss function, and explor ing the poten-
tial forms of enrichment, including multiple attribute
combinations, is yet to be explored in the literatu re.
1.1 Research Directions and
Contributions
Research has indicated that combining distinct at-
tributes, such as deep-learn e d and hand crafted fea-
tures, is a crucial path to improving pattern recog-
nition systems, regardless of the application context
(Roberto et al., 2021; Nanni et a l., 2020 ). This is par-
ticularly evident when different attribute sources are
considered (Sukegawa et al., 2022). However, despite
attention modules and a dditional data fusion mecha-
nisms improving results (Montalbo, 2022), the mod-
els developed using these strategies still have limita-
tions (Zheng et al., 2023).
Alternatively, model enrichment research, primar-
ily through backpropagation, has overcome some of
these limitations, such as information red undancy
from fea ture fusion proce sses and the incompatibil-
ity of feature dimensions and scales (Xu et al., 2022),
using less c omplex models and achieving promising
results. Moreover, backpropagation studies have en-
abled improvements in distinction rates and reduced
training costs (X u et al., 202 2), leading to advance-
ments in addressing vanishing g radient issues (Hu
et al., 2021) and overfitting, e specially in the pres-
ence of class imbalance (Zhang et al., 2024) . Dif-
ferent types of loss func tions have also been consid-
ered for various scenarios, contributing distinctively
to model enrichment (Xu et al., 2022; Zha ng et al. ,
2024).
When handcrafted fe atures are incorporated into
these functions throu gh specific rules, such as
weighted sum -based rules (Xu et al., 2022), the re-
sults have been encouraging. However, in the his-
tological context, inco rporating these impo rtant fea-
tures directly into the loss function h as not been in-
vestigated. Furthermore, these studies have not di-
rectly incorporated handcrafted attributes into the loss
function but rather utilized domain metrics like retain-
ing edge information ( Edge Loss) an d reducing im -
age distortion (MSE Loss) during le arning (X u et al.,
2022). T hese strategies represent more generic in-
formation in medical images, particularly histological
images where pathologists explore patter ns like cell
clustering.
This raises a fundamen ta l question: how would
model learning be affected if it is enriched with at-
tributes that are more aligned with the nature of his-
tological images? This question serves as the primary
motivation for this stud y. Additionally, using domain-
specific k nowledge descriptors, such as multiscale
and multidimen sio nal fractals, has helped overcome
numerous challeng es f or this type of scenario (Ten-
guam et al., 2024; Longo et al., 2023). There-
fore, studying these descriptors and their incor pora-
tion rules could enable investigations into new combi-
nations between distinct feature groups. These com-
binations and their rules rep resent significant frontiers
in the m achine learning field and enhance diagnostic
support systems.
In light of the above, the main contributions of this
study are:
• A new m ethod (Enriched-CNN) capable of en-
riching CNN models throu gh loss function s us-
ing multiscale and multidimensional fractal at-
tributes;
• Insights into the primary conditions and enrich-
ment rules based on various neural architectures
such as ResNet, InceptionNe t, DenseNet, VG-
GNet and EfficientNet;
ICEIS 2025 - 27th International Conference on Enterprise Information Systems
468

• App lica tion of the meth od in relevant histological
dataset representing breast cancer, colorectal can-
cer and liver tissue, providing inf ormation on the
best enriched models and the necessary conditions
for their study and classification.
2 METHODOLOGY
The proposed approach was d ivided into two stage s to
explore different enrichment strategies through ha nd-
crafted attributes. Stage 1 aims to extract local and
global fractal attributes from each input image using
multidimen sio nal techniques like Fractal Dimension
(D), Lacunarity (Λ) and Percolation (PERC). Stage 2
investigates the influence of primar y enrichment rules
through fracta l attributes on the indicated architec-
tures.
2.1 Stage 1 - Multiscale and
Multidimensional Fractal Attributes
Various fractal techniques are available in the litera-
ture for image investigations. This study focuses on
techniques from a multidimension a l and multiscale
perspective, such as probabilistic fractal dimension
(Ivanovici and Richard, 2 011), lacunarity (Ivanovici
and Richard, 2009), and fractal percolation (Roberto
et a l., 2017), as these techniques provide complemen-
tary quantifications for colored images. The details
are presente d in the following subsections.
2.1.1 Probabilistic Approach-Based Fractal
Dimension
Fractal dimension (D) was calculated ba sed on the ap-
proach described by (Ivanovici and Richard, 2011).
Given a colored RGB input image, each image pixel
is r e presented by a 5D vector (x, y, r, g, b), where spa-
tial c oordina tes (x, y) have colo r components (r, g, b).
Then, a hypercube of side L is initially positioned
in the upper-left corner of the image. On each iter-
ation, this hypercube is dislocated from left to right
and from top to bottom, covering all pixels in a pro-
cess known as gliding-box (Ivanovici and Richard,
2011). The hypercube size is increased when the
analysis reaches the lower-right corner of the im-
age. For each displacement, an analysis is per-
formed comparing the pixels contained within the hy-
percub e . To do this, the central pixel of the hyper-
cube, F
c
= f (x
c
, y
c
, r
c
, g
c
, b
c
), is fixed, and a com-
parison is ma de with the rest of the pixels, includ-
ing the ce ntral pixel itself, using a distance measure
∆. The pixels analyzed in this process are d efined as
F
i
= f (x
i
, y
i
, r
i
, g
i
, b
i
). In this approach, the analysis is
done through the Minkowski distance (∆
mink
), c alcu-
lated as Equation (1):
∆
mink
= max (|F
i
(k
i
) − F
c
(k
c
)|), k ∈ r, g, b. (1)
In this process, each pixel F
i
with a distance ∆ less
than or equal to the scale size L is labelled as 1, indi-
cating it belongs to the hypercube. Otherwise, it is
labelled as 0. By counting these pixels, it is possible
to co nstruct the probability matrix P (m, L) (Ivanovici
and Richard, 2011), which characterizes the p robabil-
ity of m points being co ntained within the hypercube
of side L.
With the construction of the P(m, L) matrix, we
can obtain the partial fractal dim ension N(L), which
is a ssoc ia ted with each hyp e rcube size as defined by
the Equation (2):
N(L) =
L
2
∑
m=1
P(m, L)
m
. (2)
To obtain D, after calculating the N(L) value for
each L, the angular coe fficient of the linear regression
defined by log L × log N(L) enables us to obtain the
probabilistic fractal dimension of the image.
2.1.2 Lacunarity
The multidimensional and multiscale method for cal-
culating the LAC (Λ) of the images un der inves-
tigation was based on the approach by Ivanovici
(Ivanovici and Richard, 2009), using the same prob-
ability matrix for the fractal dimension as described
in subsection 2.1.1. The metric was based on the first
and second- order moments, as d e fined by Equ ations
(3) and (4). The LAC (Λ) as a function of L, Λ(L),
was obtained from the distribution measure indicated
in Equation (5).
λ(L) =
L
2
∑
m=1
mP(m, L). (3)
λ
2
(L) =
L
2
∑
m=1
m
2
P(m, L). (4)
Λ(L) =
λ
2
(L) − (λ(L))
2
(λ(L))
2
. (5)
2.1.3 Multidimensional and Multiscale
Percolation
Multidimensional and multiscale percolation (PERC)
was calculated following the strategy outlined in
(Roberto et al., 2017). To do th is, percolation theory
Convolutional Neural Networks Enriched by Handcrafted Attributes (Enriched-CNN): An Innovative Approach to Pattern Recognition in
Histological Images
469

was a pplied to analyze pixel paths between one end of
the image and the other. The metho d we used consid-
ers a multiscale approach using the gliding-box tech-
nique. Initially, hypercubes were defined with L = 3.
This parameter is increased by two units after cross-
ing the whole image from the top left to the bottom
right. The relatio nship between the number of hype r-
cubes T that have crossed an image with height H and
width W , as a function of L, is given by:
T (L) = (H −L + 1) × (W −L +1), L ≤ min(H, W).
(6)
For each hypercube of size L, we applied a mul-
tidimensional approach similar to th e one describ ed
in (Ivanovici and Richard, 2 011) in subsection 2.1. 1.
Therefore, when the distance ∆ has a value less than
or equal to L, the pixel P is labelled as - 1, indicat-
ing it represents a pore. Otherwise, it is labelled as 0,
considered the background of the image.
Based on these co mparisons, several clusters were
formed, as described in (Roberto et al., 2017). From
this process, we extracted three functions: th e average
number of clusters C; the ratio of percolating boxes
Q; and the average coverage of the largest cluster M.
To calculate the average numbe r of clusters per box
C(L), we utilized the number of clusters in a single
box (c
i
), as a function of scale L, divided by the total
number of boxes, as shown in the equation:
C(L) =
∑
T (L)
i=1
c
i
T (L)
. (7)
The ratio of perco lating boxes Q was obtained by
counting the number of percolating boxes based on
scale L. A box q
i
is considered pe rcolating if the ratio
between the number of p ixels labe lled as pores ( Ω
i
)
and the total number of pixels within the box (L
2
) ex-
ceeds a percolation threshold p, defined as 0.59275
(Roberto e t al., 2017). The ratio of perco la ting boxes
as a function of L, (Q(L)), was obtained by dividing
the total number of percolating boxes q
i
by the total
number of boxes T in a scale L. The expression is
given in Equation (8):
Q(L) =
∑
T (L)
i=1
q
i
T (L)
. (8)
Finally, the average coverage ra tio of the largest
cluster (M) was calculated by identifying the coverage
ratio of the largest cluster in each box evaluated at
scale L, as shown in Equation (9), whe re γ
i
represents
the largest cluster in a box i.
M(L) =
∑
T (L)
i=1
γ
i
L
2
T (L)
. (9)
2.1.4 Local and Global Attributes
The fractal descriptors based on the pr obabilistic frac-
tal dimension, lacunarity and percolation appro aches
were calculated with scale variations L, using the
gliding-box method. In these cases, L
max
= 41 was
considered (Roberto et al., 2021), allowing for quan-
tification of 20 different scales. The quantifications
used in this study resulted in a set of 100 local at-
tributes (L ) for each input image. This enabled us
to define characteristic curves as a function of each
attribute and the scale L. Therefore, for lacunarity,
the curves were formed b ased on the local values as
a fu nction of the sliding hypercube dimension. In the
percolation approach, the curves obtained were C, Q
and M, re presenting percolating r egio ns. The LAC
and PERC cu rves were represented by scalar values to
form attribute vectors. Based on these curves, the fol-
lowing metrics were extracted to g e nerate global at-
tributes: area under the curve (A), skew ness (S), area
ratio (Γ) and maximum point (MP) (Roberto et al.,
2017).
The total number of attributes was dependent
on each category investigated in th is study. Table
1 presents the distribution of handcrafted attributes,
comprising a structure of 116 attributes (T ), with 100
local (L ) and 16 global (G ), calculated as a func-
tion of distance ∆. Global and local attribute sets
were analyz ed to understand enrichment using differ-
ent strategies, as described in the next sections.
2.2 Stage 2 - Enrichment Strategies
To apply the enrichment strategies, some models were
obtained using transfer learning, which reduces the
training tim e of the CNN model and enables analysis
involving datasets with a smaller number of samples.
Therefore, in this proposal, pre-trained networks in
the ImageNet dataset were used (Roberto et al., 2021;
Almaraz-Dam ia n et al. , 2020). Examples of architec-
tures that can be investigated are VGGNet, Inceptio n,
ResNet, EfficientNet, DenseNet and others. Some of
these architectures have already shown relevant re-
sults in medical image classification problems in var-
ious contexts (Rajinikanth et al., 2020) and also in the
classification of histological images (Tenguam et al.,
2024; Longo et al., 20 23; de Oliveira et al., 2023).
These models were treated as the basis for enrichment
and there fore nam ed as baseline, and were defin ed ac-
cording to r ecommendations available in the literature
(Tenguam et al., 2024 ; L ongo et al., 2023; de Oliveira
et al., 2023).
The enr ic hment process consists o f incorporat-
ing fractal attributes into the loss function through
ICEIS 2025 - 27th International Conference on Enterprise Information Systems
470
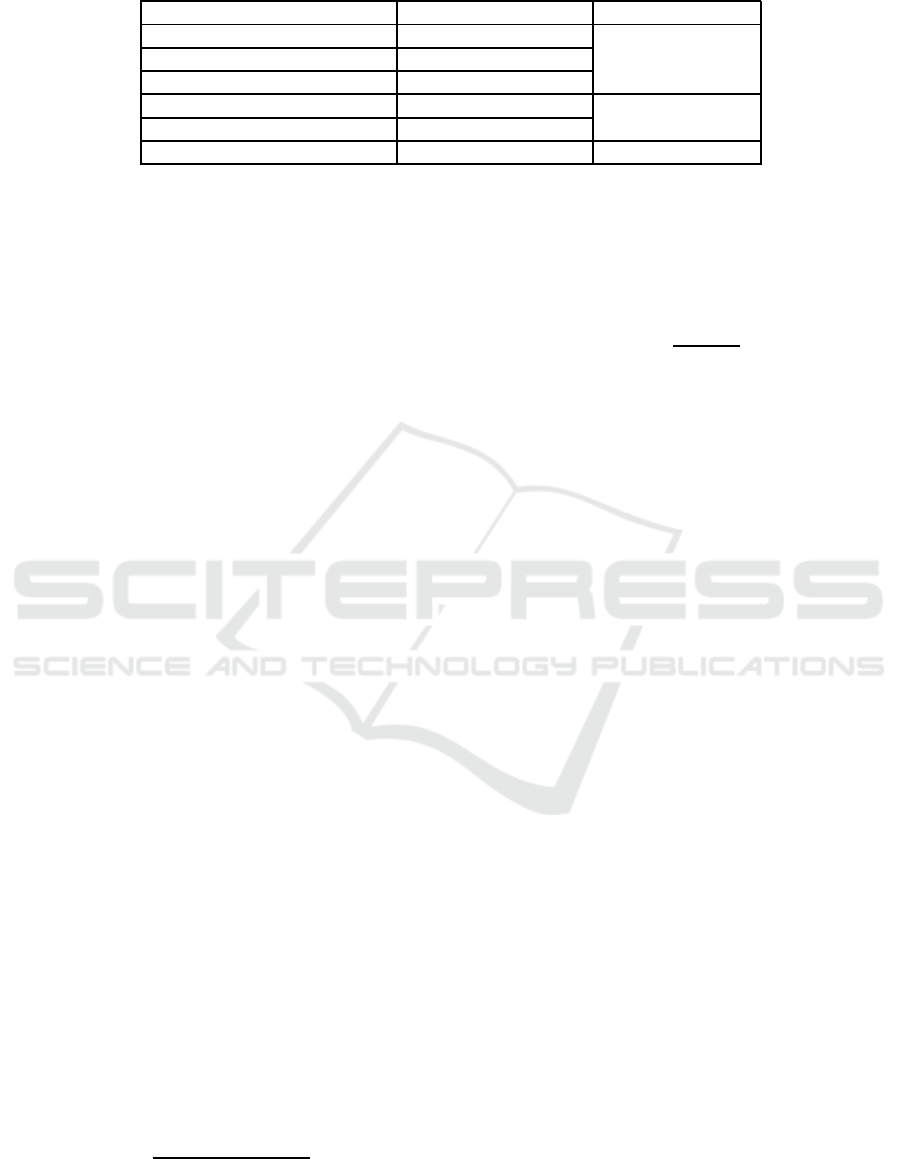
Table 1: Identification of the attribute name and the total number of handcrafted at tributes.
Attribute Number of Attributes Sets
PERC - C, Q, M 60
Local (L )LAC 20
Local D 20
PERC metrics - C, Q, M 12
Global (G )
LAC metrics 4
Total Number of Attributes 116 All (T = L ∪ G )
different strategies of selection and normalization.
Starting from a de fined architecture f or the base-
line model, some layers are released f or enrichmen t.
The weights of these layers are updated during tr ain-
ing, which, th rough backpropa gation, inc orporates
the co rresponding handcrafted features for each batch
of trained samples (batch size = 32). At the end, the
baseline model beco mes an enriched model. Incor-
poration of features is contingent on th e number of
features selected. For instance, if the ReliefF algo-
rithm identifies and c hooses only the 3 most per tinent
features from the overall feature set, training then pro-
ceeds by processing each given batch of samples ex-
clusively with these 3 selected features while also ap-
plying a defined inc orporation strategy, such as calcu-
lating the mean of their values. This approach allows
for the progressive enrichment of the model as it en-
counters each batch of data across its multiple training
iterations.
2.2.1 Preparation of Handcrafted Features for
Incorporation
In this stage, normalization, selection an d attribute in-
corporation into the loss function (L ) processes were
established for enrichment. The normalization pro-
cess was applied to the handcrafted fractal attribute
set T . Initially, we tested two nor malization types:
min-max (defined by Equations (10) an d (11)) and z-
score (defined by Equation (12)). Normalization is
important to ensure that attributes are correctly in-
corporated, as their value range differs from the loss
function where incorporation occurs. Additionally,
this strategy strengthens the proposed enrichment ap-
proach because it avoids structural m odifications or
extensions in the ar chitectures, which can lead to di-
mensional incompatibilities (Cheng et al., 2023). It
also minimizes phenomena such as information re-
dunda ncy (Zheng et al., 2023) and other limitations
that often require new modifications or adjustments
tailored to e ach architecture.
˜
T
c
=
T
c
− min(T )
max(T ) − min(T )
ε, (10)
where T
c
∈ T and
˜
T
c
represents each element T
c
normalized by min-max according to the scale o f val-
ues ε pr ovided by th e loss function.
ε = (max(L ) − min(L)) + min(L ). (11)
˜
T
z
=
T
z
− T
u
T
sd
, (12)
where T
z
∈ T and
˜
T
z
represents each element T
z
normalized by z-score, T
u
is the mean of the T and
T
sd
is its stand ard deviation.
The normalized attributes
˜
T were subjected to
a selection process using the ReliefF algorithm
(Kononen ko et al., 1997), resulting in a vector
˜
T
R
.
Several selection tests were perform ed with the best
values presented in the results section. This strategy
allowed us to obtain the most relevant descriptors, en-
hance model in te rpretability and indicate which rules
apply to enrichment through different attributes.
To incorporate the normalized and selected at-
tributes
˜
T
R
into the model, some adjustments were
made since the loss function only accepts scalars.
Some strategies were implemented, such as averag-
ing the values (
˜
T
R
u
) and applying norms to feature
vectors (k
˜
T
R
k
p
) with p = {1, 2}, as tested according
to Equation (13):
L = Error(y
i
, ˆy
i
) + αk
˜
T
R
k
p
, (13)
where α is a relevance coefficient that accounts for
normalized fractal attributes. In this study, we con-
sidered α = 1.
2.3 Comparisons and Tests
The enrichment process was tested on the ResNet, In-
ceptionNet, DenseNet, EfficientNet and VGGNet ar-
chitectures acr oss different layers. First, we analyzed
which layers in these arc hitectures contained trainable
parameters. Then, enrichment was applied in a com-
bined manner across the layers. Each combination
resulted in a new enriched CNN mo del (Enriched-
CNN). The goal of this test was to identify the
Convolutional Neural Networks Enriched by Handcrafted Attributes (Enriched-CNN): An Innovative Approach to Pattern Recognition in
Histological Images
471

most suitable lay er combinations for each architec-
ture, considering co mmonly used performance eval-
uation and validation methods in the literature, such
as accuracy (Acc), cross-validation, and others (Mar-
tinez et al., 2003). The results of the en riched models
were comp ared to those of baseline models to validate
the proposed approach.
Additionally, the mo dels enriched using multi-
scale and multidimensional fractal attributes were
compare d to the classification results of these at-
tributes using conventional mach ine learning algo-
rithms representing d ifferent categories, such as
SVM, Random Forest, KNN and Naive Bayes
(Ponti Jr, 2011). Comp arisons between the proposed
models were conducted using the histological d atasets
described in the next sub section.
2.4 Application Context - Histological
Image Datasets
Histological image datasets, especially those stained
with Hematoxylin & Eosin (H&E ), are essential for
training CNN models to create classification systems.
However, these da tasets have some limitations, such
as limited availability and diversity of samples, mak-
ing it challenging to train these mo dels for patter n
recogn ition. This requires solutions like enrichment
through handcraf te d f e atures (Dia o et al., 2023). In
the co ntext, the effects a nd conditions imposed to val-
idate the proposed enrichment approa ch were tested
on several datasets, including Colorectal (CR) (Sir-
inukunwattana et al., 2017), Brea st (UCSB) (Gelasca
et a l., 2008) a nd Liver tissue (LG) (Zahn et al., 2007).
Examples from each dataset group (CR, UCSB and
LG) are shown in Figures 1 to 3, respectively. Further
informa tion on the datasets is provided in Table 2.
3 RESULTS AND ANALYSIS
The proposed enrichment was implemented in
the indicated architec tures (ResNet, InceptionNet,
DenseNet, VGGNet and EfficientNet) and applied to
the following H&E datasets: CR, L G and UCSB. Fol-
lowing subsection 2 .2, the pre-trained CNN models
underwe nt normalization and feature selection steps
before incorporating handcrafted features. The Reli-
efF algorithm was used fo r the selection process with
the following feature count (para meter σ): 1, 3, 5, 10
and 20. These parameters were defined based on ob-
servations from relevant studies exploring this algo-
rithm in the histological context (Longo et al., 2023).
All tests were run three times, and the average of the
results was considered when c omparing the architec-
tures a nd datasets. The results were de fined through
samples for training (70%) and testing (30%), using
the holdout cross-validation method. In this study, we
considered a fixed learning rate at 1e
−3
.
Firstly, we tested the min-max n ormalization. All
attribute incorporation strategies into the lo ss function
were applied (
˜
T
R
u
, p = 1 and p = 2). After apply-
ing the e nrichmen t method with the defined strategies
for each σ value, considering the CR dataset, we ob-
served that except for the ResNet50 architecture, the
enriched model achieved higher Acc rates, with the
highest value at 100%, obtained using σ = 10 and
p = 2, provided by the EfficientNetB2 architecture,
as well as σ = 20 and p = 2 using the VGG19 archi-
tecture, outperforming the baseline models.
When testing the z-score normalization strategy
under the same conditions as the min-max, as shown
in Table 3, the results indicated that the highest Acc
rate (100%) was achieved with EfficientNetB2 using
σ = 10 and VGG19 usin g σ = 5. The most effec-
tive in c orporation was obtained using the vector norm
with p = 2. In turn, the highest average Acc value
(96.73%) was achieved with
˜
T
R
u
incorporation using
σ = 10. Notably, this norm a lization strategy o utper-
formed the baseline models in various combina tions,
namely σ = 10 and p = 2; σ = 3 and p = 1; and, fi-
nally, σ = 1 and σ = 10 using
˜
T
R
u
. This indicates that
the z-score normalization strategy was more efficient
in enriching models based on the ResNet50 architec-
ture. In contrast, this only occur red in one situation
(σ = 1 and p = 1) using the min-max strategy. There-
fore, it is clear that normalization strategies are im-
portant in the context of enriching CNN models using
handcr a fted attributes.
For the LG and UCSB datasets, the enrichment
process exh ibited different behaviors co mpared to the
CR dataset. The same norma lization, selection and
feature incorporation steps were performed for the LG
and UCSB datasets with notab le results hig hlighted in
Tables 4 and 5, respectively.
In the LG dataset, some of the most significant
results were achieved with the vector norm strategy
(p = 2) and min-max normaliza tion. This com bina-
tion achieved the highest average Acc rate among the
architecture s (88.78% with σ = 10). In terms of the
highest Acc value, different combina tions of normal-
ization, feature selection and incorporation strategies
achieved the 100 % value using the EfficientNetB2 ar-
chitecture, similar to the CR dataset. Furthermor e ,
the re sults obtained with this dataset indicated th at en-
richment was more efficient than with th e CR dataset,
as the proposed models outperformed baseline mod-
els in most combinations.
In the UCSB dataset, in contrast to CR an d LG, the
ICEIS 2025 - 27th International Conference on Enterprise Information Systems
472

(a) (b)
Figure 1: Examples of H&E colorectal images: (a) benign and (b) malignant.
(a) (b)
Figure 2: Examples of H&E breast images: (a) benign and (b) malignant.
(a) (b)
Figure 3: Examples of H&E liver images: (a) male and (b) female.
winning combination in terms of the highest average
Acc rate was vector norm incorporation (p = 1) with
z-score normalization. This combination achieved
the highest average Acc rate among the ar chitec-
tures (78.33% with σ = 3). The hig hest Acc value
(93.75%) was achieved using p = 1, z-score and the
VGG19 architecture, as well as p = 1, min-max and
EfficientNetB2, an d also
˜
T
R
u
, min-max and VGG19.
The results su ggest that, except for the ResNet50
architecture , en riched models outperformed baseline
models in a ll strategies for the CR and LG da ta sets,
especially for th e UCSB dataset. This is a significant
contribution, as histological datasets often have lim-
ited samp le s, par ticularly the UCSB dataset with only
58 samples, which generally hinders the training of
traditional CNN models.
Another noteworthy point is that th e enrichment
behavior differed dep ending on the image dataset
used. Among the incorpor ation strategies, vector
norm with p = 2 for the CR dataset and p = 1 for the
UCSB dataset sto od out. In the LG d ataset, no par-
ticular strategy stood out. Regarding normalization
strategies, their importance was evident in the enrich-
ment process throug h backpropaga tion. Additionally,
Convolutional Neural Networks Enriched by Handcrafted Attributes (Enriched-CNN): An Innovative Approach to Pattern Recognition in
Histological Images
473

Table 2: Information on the studied datasets.
Dataset Description Classes Total Images Dimensions (pixels)
CR Colorectal tissue 2 165 (91+ 74) 567 × 430 to 775 × 522
UCSB Breast tissue 2 58 (3 2+26) 896 × 768
LG Liver tissue 2 265 (150+115) 417 × 312
Table 3: Acc rates (%) of enriched models compared to baseline models for various CNN architectures, considering the CR
dataset, z-score normalization and feature incorporation using the vector norm with p = 2.
CNN Architectures
Enriched-CNN (z-score)
baseline model
σ = 1 σ = 3 σ = 5 σ = 10 σ = 20
ResNet50 55.10 65.99 66.67 81.63 55.10 99.32
InceptionV3 97.96 98.64 97.28 97.96 97.28 93.88
DenseNet121 97.96 97.28 97.28 98.64 97.28 96.60
EfficientNetB2 97.28 98.64 97.28 100 97.96 90.48
VGG19 97.96 98.64 100 97.28 99.32 91 .16
Average ±
SD
89.25 ±
0.19
91.84 ±
0.14
91.70 ±
0.14
95.10 ±
0.08
89.39 ±
0.19
94.29 ±
0.04
the min-max strategy yielded better results for the LG
dataset, while the z-scor e strategy was prominent for
other datasets. Regarding selection strategies, while
no commonalities em erged across datasets, strategies
involving few attributes (σ = 1 or σ = 3) consistently
produced considerable performance in several situa-
tions. This behavior could be due to the enrichment
process, whic h performe d better in more challeng-
ing circumstances, as observed for the UCSB dataset.
When σ = 1, it is imp lied that a single attribute is ca-
pable of p romoting the necessary enrichment for the
model. This highlig hts the imp ortance of the selection
strategies discussed here, further undersco ring the in-
novation of the prop osed enrichment m e thodology as
a method for en hancing classification systems and as-
sisting resear c hers in this field.
It is worth noting that training the enriched CNN
models involved enrichment across various layers to
identify the combinations yielding the best results, as
discussed in section 2.3. Tests were perfor med on dif-
ferent layers of the indicated architectures. The best
results are presented in Tables 3 to 5 for the three
datasets studied. The layers achieving these best per-
formances for each architecture are listed in Table 6.
To be tter understand the enrichment proc ess in
machine learning contexts, comparisons were made
among models obtained through classification algo-
rithms, as described in subsection 2.3. The algo-
rithms used were SVM, Random Forest, Naive Bayes
and KNN. These algorithms were combined in an en-
semble decision process (Longo et al., 2023). Ad-
ditionally, another combination known as ensemble
descriptors was implemented. I n this approa ch, frac-
tal attributes w e re concatenated with deep-learned at-
tributes extracted from the retrained baseline model
based on the last fully connec ted layer. This layer
selection was based on investigations and relevant re-
sults achieved in the context of histological images
(Tenguam et al., 2024 ; L ongo et al., 2023; de Oliveira
et al., 2023). This strategy also acted as a form
of CNN model enrichment (Tenguam et al., 2024 ;
de Oliveira et al., 2023; Roberto et al., 2021). The
fractal descriptors used here w e re the same as those
used in the previously presented enriched models.
This comparison is presented in Ta ble 7 for σ ≥ 5 val-
ues, with the best results highlighted in bold.
The results indicate that the proposed enrichment
method ou tperformed, in most situations, traditional
training with common classifiers in machine learning
processes fo r all datasets tested. Notably, there were
some instances where the enr ic hment showed less sig-
nificant p e rformance, particularly for the ResNet50
architecture . This could be attributed to the residual
connection mec hanism implemented in this architec-
ture.
When σ = 5 and σ = 10, the proposed enrich-
ment method showed noticeable improvements, par-
ticularly for the CR dataset. While no overall ad-
vantages emerged for other datasets, the prop osed
method outperformed en semble models in most sit-
uations when EfficientNetB2 and VGG19 arc hitec-
tures were considered. This comparison served only
to evaluate the feasibility of the proposal, as the im-
plemented enrichment relied on selected fractal at-
tributes, while ensemble models included both deep-
learned and fractal attributes. This lack of equality
in the comparison hindered a definitive conclusion.
However, the proposed enrichment approach can be
further explored usin g other types of attributes crucial
in the context of H&E im a ges, potentially leading to
new findings and complementing the results achieved
here.
ICEIS 2025 - 27th International Conference on Enterprise Information Systems
474
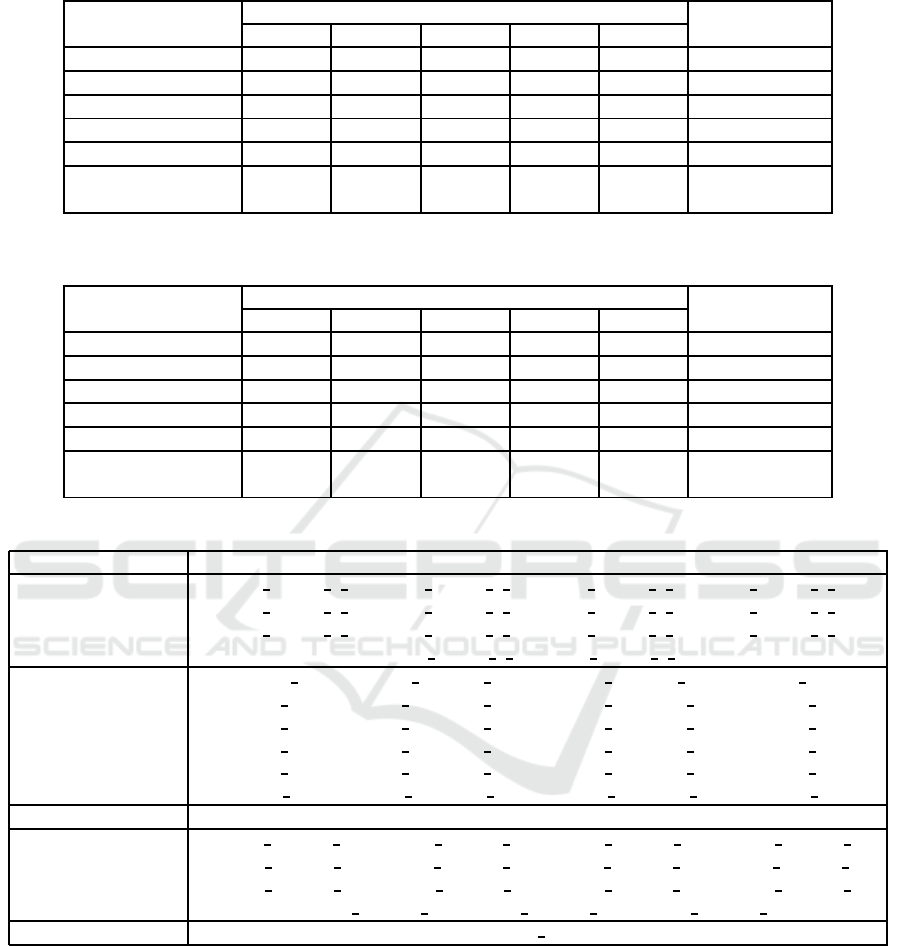
Table 4: Acc rates (%) of enriched models compared to baseline models for various CNN architectures, considering the LG
dataset, min-max normalization and feature incorporation using the vector norm with p = 2.
CNN Architectures
Enriched-CNN (min-max)
baseline model
σ = 1 σ = 3 σ = 5 σ = 10 σ = 20
ResNet50 67.09 83.54 77.64 78.06 80.59 81.44
InceptionV3 56.96 67.51 56.96 76.37 67.93 83.12
DenseNet121 81.86 91.98 89.03 94.09 91.56 80.17
EfficientNetB2 98.73 99.58 98.73 99.58 99.16 78.48
VGG19 95.78 92.40 97.47 95.78 96.20 89.87
Average ±
SD
80.08 ±
0.18
87.00 ±
0.12
83.97 ±
0.17
88.78 ±
0.11
87.09 ±
0.13
82.62 ±
0.04
Table 5: Acc rates (%) of enriched models compared to baseline models for various CNN architectures, considering the UCSB
dataset, z-score normalization and feature incorporation using the vector norm with p = 1.
CNN Architectures
Enriched-CNN (z-score)
baseline model
σ = 1 σ = 3 σ = 5 σ = 10 σ = 20
ResNet50 68.75 79.00 64.58 68.75 79.17 58.33
InceptionV3 60.42 62.50 68.75 60.42 66.67 64.58
DenseNet121 52.08 70.00 68.75 75.00 52.08 66.67
EfficientNetB2 83.33 89.58 89.58 91.67 87.50 75.00
VGG19 85.42 93.75 90.00 89.58 81.25 56.25
Average ±
SD
70.00 ±
0.14
78.33 ±
0.14
76.67 ±
0.13
77.08 ±
0.13
73.33 ±
0.14
64.16 ±
0.07
Table 6: Layers that exhibited the best performance during the enrichment process based on the studied architectures.
CNN Architectures Enriched laye rs indicated by name
ResNet50
conv2 block1 3 bn, conv2 block2 3 bn, conv2 block3 3 bn, conv3 block1 0 bn,
conv3 block1 3 bn, conv3 block2 3 bn, conv3 block3 3 bn, conv3 block4 3 bn,
conv4
block1 0 bn, conv4 block2 3 bn, conv4 block3 3 bn, conv4 block6 3 bn,
conv5 block1 3 bn, conv5 block2 3 bn
InceptionV3
batch norm alization 5, batch normalization 7, batch nor m alization 18,
batch
normalization 21, batch normalization 2 4, batch normalization 26,
batch normalization 33, batch normalization 39, batch normalization 43,
batch
normalization 48, batch normalization 5 8, batch normalization 71,
batch normalization 78, batch normalization 82, batch normalization 83,
batch norm alization 87, batch normalization 88, batch normalization 93
DenseNet121 bn
EfficientNetB2
block1a pro ject bn, block1b pro ject bn, block2a pro ject bn, block2b pro ject bn,
block2c
pro ject bn, block3c pro je ct bn, b lock4a pro ject bn, block4c pro ject bn,
block4d pro ject bn, block5a pro ject bn, block5c pro ject bn, block6a pro ject bn,
block6c
pro ject bn, block6e pro ject bn, block7a pro ject bn
VGG19 block5 conv4
3.1 Comparative Overview
To emphasize the importance of the pro posed method
and its feasibility, the results presented he re were
compare d with those of other established and relevant
studies in this research area. The compar isons are pre-
sented in Table 8 for each H&E histological dataset.
Most studies presented in the table focus on en-
semble descriptor strategies, w here the best results
are generally achieved through combin ations involv-
ing deep-learned attributes. When only handcrafted
attributes or com binations focused on these attributes
are considered, the overall results are not impressive
for most methods. The method proposed in this study
introdu ced a new ap proach for CNN architectures to
leverage handcrafted attributes, maximizing their po-
tential during training. Moreover, this integration was
subtle and did not significantly alter the architectures.
This highlights the advantage o f the proposed ap-
proach .
Convolutional Neural Networks Enriched by Handcrafted Attributes (Enriched-CNN): An Innovative Approach to Pattern Recognition in
Histological Images
475

Table 7: Acc rates (%) of enriched models compared to those obtained using fractal attributes applied to machine learning al-
gorithms and to those of models enriched through ensemble descriptor strategies using various CNN architectures, considering
the CR, LG and UCSB datasets.
CNN Architectures
σ = 5 σ = 10 σ = 20
Enriched-
CNN
Ensemble
Enriched-
CNN
Ensemble
Enriched-
CNN
Ensemble
CR
ResNet50 66.67 94.55 81.63 95.15 55.10 97.58
InceptionV3 97.28 95.15 97.96 92.73 97.2 8 97.58
DenseNet121 97.28 95.76 98.64 97.58 97.2 8 99.39
EfficientNetB2 97.28 95.15 100 99.39 97.96 99.39
VGG19 100 95. 15 97.28 96.36 99.32 97.58
Fractal Attributes 80.61 84.24 86.06
LG
ResNet50 77.64 95.85 78.06 98.49 80.59 98.11
InceptionV3 56.96 88.68 76.37 88.30 67.9 3 95.85
DenseNet121 89.03 97.74 94.09 99.25 91.5 6 99.62
EfficientNetB2 98.73 93.96 99.58 94.34 99.16 96.23
VGG19 97.47 92.83 95.78 94.34 96.20 94.34
Fractal Attributes 80.38 90.19 93.96
UCSB
ResNet50 64.58 86.21 68.75 91.38 79.17 91.38
InceptionV3 68.75 81.03 60.42 87.93 66.6 7 87.93
DenseNet121 68.75 86.21 75.00 86.21 52.0 8 91.38
EfficientNetB2 89.58 79.31 91.67 84.48 87.5 0 89.66
VGG19 90.00 74.14 89.58 74.14 81.2 5 86.21
Fractal Attributes 72.41 68.97 74.14
4 CONCLUSIONS
This study developed a novel method for enriching
CNN. In this method, deep-learned features were en-
riched through backpropag a tion using relevant frac-
tal techniques commonly applied in H&E image con-
texts. The results achieved in the studied histolog-
ical datasets in dicate the feasibility of the proposed
method, including ind ications of th e combinations
that contributed the most. It was important to inves-
tigate different selection, normalization and attribute
incorporation strategies in the performance analy sis
of various CNN arc hitectures. The method also high-
lighted how architectures can be enriched without ma-
jor structural changes. This opens the door for ap-
plying the method to other types of architectures be-
sides CNN. Comparison with related studies suggests
that the method achieved notable performance with
just a few fractal attributes, while other studies of-
ten utilized deep-learne d attributes or combinations
with more f eatures. Moreover, the method consis-
tently outperformed traditional training w ith the in-
dicated architectures in most situation s.
This op ens up new possibilities for future re-
search, such as applyin g enrichment to architectures
beyond CNN, as well as exploring other attributes rel-
evant to the investigated context. Investigating forms
of incorporation beyond the loss function c ould also
lead to new interpretations and potentially improve
the classification systems developed.
ACKNOWLEDGEMENTS
This research was funded in part by the: Coordenac¸˜ao
de Aperfeic¸oamento de Pessoal de N´ıvel Superior
- Brasil (CAPES) - Finan c e Code 001; National
Council for Scientific and Technological Develop-
ment CNPq (grants #132940/2019-1, #313643/2021-
0 and #311404/2021-9); the State of Minas Gerais Re-
search Foundation - FAPEMIG (gran t #APQ-00578-
18); S˜ao Paulo Research Foundation - FAPESP (grant
#2022/03020-1).
ICEIS 2025 - 27th International Conference on Enterprise Information Systems
476

Table 8: Acc rates (%) of Enriched-CNN models compared to other t echniques, considering the CR, LG and UCSB dataset.
Method Approac h
Type of
Attributes
Number of
attributes
Acc
CR
Enriched-CNN
VGG19 enriched by a ttributes
L (PERC and LAC) and G (S)
Handcraf ted 5 100
(Longo et al., 2023) DenseNet121 and EfficientNetB2
Ensemble of
deep-lear ned
10 100
(Roberto et al., 2021) ResNet50, D, LAC an d PERC
Ensemble of
deep-lear ned
and hand c rafted
300 99.39
(Dabass et al., 2019) 31-layered CNN Deep-learn ed - 96.97
LG
(Di Ruberto et al., 2016)
Statistical Analysis and
Texture Descriptors
Handcraf ted 20 100
(Longo et al., 2023) DenseNet121 and ResNet50
Ensemble of
deep-lear ned
25 100
(Roberto et al., 2021) ResNet50, D, LAC an d PERC
Ensemble of
deep-lear ned
and hand c rafted
300 99.62
Enriched-CNN
EfficientNetB2 enrich ed by
attributes L (LAC) and G (Γ)
Handcraf ted 3 99.58
(Andrearczyk and Whelan, 2017) Texture CNN Deep-learn ed - 99.10
UCSB
(Yu et al., 2019)
CNN, LBP, SURF, GLCM a nd
others
Ensemble of
deep-lear ned
and hand c rafted
319 96.67
(Longo et al., 2023) DenseNet121 and EfficientNetB2
Ensemble of
deep-lear ned
25 94.83
Enriched-CNN
VGG19 enriched by a ttributes
L (PERC) and G (Γ)
Handcraf ted 3 93.75
(Kausar et al., 2019)
Color normalization, Haar wavelet
decomposition and a 16-laye red
CNN
Deep-learn ed - 91.00
(Roberto et al., 2021) ResNet50, D, LAC an d PERC
Ensemble of
deep-lear ned
and hand c rafted
300 89.66
REFERENCES
Almaraz-Damian, J.-A., Ponomaryov, V., Sadovnychiy, S.,
and Castillejos-Fernandez, H. (2020). Melanoma and
nevus skin l esion classification using handcraft and
deep learning feature fusion via mutual information
measures. Entropy, 22(4):484.
Andrearczyk, V. and Whelan, P. F. (2017). Deep learning
for biomedical texture image analysis. In Proceedings
of the Irish Machine Vision & Image Processing Con-
ference. Irish Pattern Recognition & Classification So-
ciety (IPRCS).
Cheng, C., Xu, T., and Wu, X.-J. (2023). Mufusion: A
general unsupervised image fusion network based on
memory unit. Information Fusion, 92:80–92.
Dabass, M., Vig, R., and Vashisth, S. (2019). Five-grade
cancer classification of colon histology images via
deep learning. In Communication and Computing
Systems: Proceedings of the 2nd International Con-
ference on Communication and Computing Systems
(ICCCS 2018), December 1-2, 2018, Gurgaon, India,
page 18. CRC Press.
de Oliveira, C. I., do Nascimento, M. Z., Roberto, G. F. ,
Tosta, T. A., Martins, A. S., and Neves, L. A. (2023).
Hybrid models for classifying histological images: An
association of deep features by transfer learning with
ensemble classifier. Multimedia Tools and A pplica-
tions, pages 1–24.
Di Ruberto, C., Putzu, L., Arabnia, H., and Quoc-Nam, T.
(2016). A feature learning f r amework for histology
images classification. Emerging trends in applications
and infrastructures for computational biology, bioin-
formatics, and systems biology: systems and applica-
tions, pages 37–48.
Convolutional Neural Networks Enriched by Handcrafted Attributes (Enriched-CNN): An Innovative Approach to Pattern Recognition in
Histological Images
477

Diao, S., L uo, W., Hou, J., Lambo, R., Al-Kuhali,
H. A ., Zhao, H., Tian, Y., Xie, Y., Zaki, N., and
Qin, W. (2023). Deep multi-magnification similar-
ity learning for histopathological image classification.
IEEE Journal of Biomedical and Health Informatics,
27(3):1535–1545.
Gelasca, E. D., Byun, J., Obara, B., and Manjunath, B.
(2008). Evaluation and benchmark for biological im-
age segmentation. In 2008 15th IEEE International
Conference on Image Processing, pages 1816–1819.
IEEE.
Hosseini, V. R., Mehrizi, A. A., Gungor, A., and Afrouzi,
H. H. (2023). Application of a physics-informed neu-
ral network to solve the steady-state bratu equation
arising from solid biofuel combustion theory. Fuel,
332:125908.
Hu, Z., Zhang, J., and Ge, Y. (2021). Handling vanishing
gradient problem using artificial derivative. IEEE Ac-
cess, 9:22371–22377.
Ivanovici, M. and Richard, N. (2009). The lacunarity of
colour fractal images. In Image Processing (I CIP),
2009 16th IEEE International Conference on, pages
453–456. IEEE.
Ivanovici, M. and Richard, N. (2011). Fractal dimension
of color fractal images. IEEE Transactions on Image
Processing, 20(1):227–235.
Jahan, I., Ahmed, M. F., Ali, M. O., and Jang, Y. M. (2022).
Self-gated rectified linear unit for performance im-
provement of deep neural networks. ICT Express.
Kausar, T., Wang, M., Idrees, M., and Lu, Y. (2019). Hwd-
cnn: Multi-class recognition in breast histopathology
with haar wavelet decomposed image based convolu-
tion neural network. Biocybernetics and Biomedical
Engineering, 39(4):967–982.
Kononenko, I.,
ˇ
Simec, E., and Robnik-
ˇ
Sikonja, M. (1997).
Overcoming the myopia of inductive learning algo-
rithms with relieff. Applied Intelligence, 7(1):39–55.
Longo, L. H. d. C. , Roberto, G. F., Tosta, T. A., de Faria,
P. R. , Loyola, A. M., Cardoso, S. V., Silva, A. B.,
do Nascimento, M. Z., and Neves, L. A. (2023). Clas-
sification of multiple h&e images via an ensemble
computational scheme. Entropy, 26(1):34.
Martinez, E. Z., Louzada-Neto, F., and Pereira, B. d. B.
(2003). A curva roc para testes diagn´osticos. Cad.
sa´ude colet.,(Rio J.), 11(1):7–31.
Montalbo, F. J. P. (2022). Diagnosing gastrointestinal dis-
eases from endoscopy images through a multi-fused
cnn with auxiliary layers, alpha dropouts, and a fu-
sion residual block. Biomedical Signal Processing
and Control, 76:103683.
Nanni, L., Ghidoni, S., Brahnam, S ., Li u, S., and Zhang,
L. (2020). Ensemble of handcrafted and deep learned
features for cervical cell classification. I n Nanni, L.,
Brahnam, S., Brattin, R., Ghidoni, S., and Jain, L., ed-
itors, Deep Learners and Deep Learner Descriptors
for Medical A pplications. Intelligent Systems Refer-
ence Library, volume 186, pages 117–135. Springer.
Ponti Jr, M. P. (2011). Combining classifiers: from the cre-
ation of ensembles to the decision fusion. In 2011 24th
SIBGRAPI Conference on Graphics, Patterns, and Im-
ages Tutorials, pages 1–10. IEEE.
Rajinikanth, V., Joseph Raj, A., Thanaraj, K., and Naik, G.
(2020). A customized vgg19 network wit h concatena-
tion of deep and handcrafted features for brain tumor
detection. Appl. Sci., 10(10):3429.
Roberto, G. F. , Lumini, A., Neves, L. A., and do Nasci-
mento, M. Z. (2021). Fractal neural network: A new
ensemble of fractal geometry and convolutional neu-
ral networks for the classification of histology images.
Expert Systems with Applications, 166:114103.
Roberto, G. F., Neves, L. A., Nascimento, M. Z., Tosta,
T. A., Longo, L. C. , Martins, A. S., and Faria, P. R.
(2017). Features based on the percolation theory for
quantification of non-hodgkin lymphomas. Comput-
ers in biology and medicine, 91:135–147.
Sirinukunwattana, K., Pluim, J. P., Chen, H., Qi, X. , Heng,
P.-A., Guo, Y. B., Wang, L. Y., Matuszewski, B. J.,
Bruni, E., Sanchez, U., et al. (2017). Gland segmen-
tation in colon histology images: The glas challenge
contest. Medical i m age analysis, 35:489–502.
Sukegawa, S., Fujimura, A., Taguchi, A., Yamamoto, N.,
Kitamura, A., Goto, R., N akano, K., Takabatake, K.,
Kawai, H., Nagatsuka, H., et al. (2022). Identification
of osteoporosis using ensemble deep learning model
with panoramic radiographs and clinical covariates.
Scientific reports, 12(1):1–10.
Tenguam, J. J., Longo, L. H. d. C., Roberto, G. F., Tosta,
T. A., de Faria, P. R., Loyola, A. M., Cardoso, S. V.,
Silva, A. B., do Nascimento, M. Z. , and Neves, L. A.
(2024). Ensemble learning-based solutions: An ap-
proach for evaluating multiple features in the con-
text of h&e histological images. Applied Sciences,
14(3):1084.
Wu, M., Zhu, C., Yang, J., Cheng, S., Yang, X., Gu, S., Xu,
S., Wu, Y., Shen, W., H uang, S., et al. (2023). Explor-
ing prognostic indicators in the pathological images
of ovarian cancer based on a deep survival network.
Frontiers in Genetics, 13:1069673.
Xu, L., Zhang, H., Song, L., and Lei, Y. (2022). Bi-
mgan: Bidirectional t1-to-t2 mri images prediction us-
ing multi-generative multi-adversarial nets. Biomedi-
cal Signal Processing and Control, 78:103994.
Yu, C., Chen, H., Li, Y., Peng, Y., Li, J., and Yang, F.
(2019). Breast cancer classification i n pathological
images based on hybrid features. Multimed Tools
Appl, 78:21325–21345.
Zahn, J. M., Poosala, S., Owen, A. B., Ingram, D. K.,
Lustig, A., Carter, A., Weeraratna, A. T., Taub, D. D.,
Gorospe, M., Mazan-Mamczarz, K., et al. (2007).
Agemap: a gene expression database for aging in
mice. PLoS genetics, 3(11):e201.
Zhang, F., Lin, S., Xiao, X., Wang, Y., and Zhao, Y. (2024).
Global attention network with multiscale feature fu-
sion for infrared small target detection. Optics &
Laser Technology, 168:110012.
Zheng, H., Hu, Z., Yang, L., Xu, A., Zheng, M., Zhang, C.,
and Li, K. (2023). Multi-feature collaborative fusion
network with deep supervision for sar ship classifica-
tion. IEEE Transactions on Geoscience and Remote
Sensing.
ICEIS 2025 - 27th International Conference on Enterprise Information Systems
478
