
Machine Learning Approaches in the Detection of Amyotrophic Lateral
Sclerosis Disease Using Orofacial Gestures
Mara Hajdu M
˘
acelaru
a
, Rares¸ Chiuzb
˘
aian and Petric
˘
a Pop
b
Department of Mathematics and Informatics, Faculty of Sciences, North University Center of Baia Mare,
Technical University of Cluj-Napoca, Victoriei 76, Baia Mare, Romania
Keywords:
Machine Learning, Amyotrophic Lateral Sclerosis Disease, Orofacial Gestures.
Abstract:
Amyotrophic lateral sclerosis (ALS) is a progressive neurodegenerative disease that affects nerve cells in the
brain and spinal cord, specifically the motor neurons. As far as we know, there is no single test that can
definitively diagnose ALS, and the diagnosis is often based on a integration of clinical findings, medical his-
tory, physical examination and various tests to rule out other possible conditions and confirm the diagnosis.
The present work proposes four machine learning (ML) algorithms: K-Nearest Neighbors, the Iterative Di-
chotomizer 3, Naive Bayes and Logistic Regression to help the diagnosis of early signs of ALS disease. In
order to test the proposed ML algorithms, we used the only existing data set, created by the Sunnybrook Re-
search Institute in Toronto. Using the extracted images from the videos of the participants, we developed a
system of recognition based on orofacial gestures of the early signs of ALS. The achieved experimental results
show that the described ML techniques enable accurate ALS predictions and can be easily integrated into
healthcare system for diagnostic use.
1 INTRODUCTION
Amyotrophic Lateral Sclerosis (ALS), also known
as Lou Gehrig’s disease, is a progressive and irre-
versible neurodegenerative disease that progressively
paralyzes people because the brain loses the ability to
send signals to the body’s muscles, that we typically
have the ability to move at will. Gradually, as the
body’s muscles deteriorate, someone living with ALS
will lose the capability to walk, talk, eat, swallow, and
eventually breathe.
The exact cause of most ALS cases remains un-
known. Researchers have been investigating various
factors potentially associated with ALS, such as ge-
netics and environmental influences. Additionally,
studies have explored connections with diet and in-
juries. While the cause for most ALS cases remains
elusive, several inherited factors have been identified
as causing familial ALS.
Over 250,000 individuals globally are affected by
ALS. Until now, there have been limited published
studies aimed at projecting the quantity and disper-
sion of ALS cases in future years. The research per-
formed by (Arthur et al., 2016) indicated a projected
a
https://orcid.org/0000-0003-3135-1244
b
https://orcid.org/0000-0002-0626-9284
rise in ALS cases around the world, from 222,801 in
2015 to 376,674 in 2040, marking a 69% increase.
They mentioned that the primary reason for this rise is
the aging population, especially in developing coun-
tries.
Although ALS is a very serious disease, it is cru-
cial not to lose hope in the battle against it. Timely
diagnosis is imperative for comprehensive treatment
in the earliest stages. With advancements in science
and technology, many patients have the opportunity
for substantial improvement. Proper treatment can
significantly enhance quality of life and extend the
lifespan of the patients.
(Bandini et al., 2020) described the only available
dataset containing videos showcasing orofacial ges-
tures executed by individuals with orofacial impair-
ment due to neurological disorders, such as ALS and
stroke. Their experiments revealed that even in case
of standardized experimental setup and mild to mod-
erate orofacial impairment due to neurological dis-
eases, a bias in the face alignment accuracy persisted.
Machine learning (ML) is an area of study in arti-
ficial intelligence (AI) focused on creating and exam-
ining statistical algorithms capable of learning from
data, generalizing to new data, and executing tasks
without explicit instructions. ML techniques have
1132
M
ˇ
acelaru, M. H., Chiuzb
ˇ
aian, R. and Pop, P.
Machine Learning Approaches in the Detection of Amyotrophic Lateral Sclerosis Disease Using Orofacial Gestures.
DOI: 10.5220/0013282000003890
In Proceedings of the 17th International Conference on Agents and Artificial Intelligence (ICAART 2025) - Volume 3, pages 1132-1139
ISBN: 978-989-758-737-5; ISSN: 2184-433X
Copyright © 2025 by Paper published under CC license (CC BY-NC-ND 4.0)

been applied successfully to many fields including
natural language processing, computer vision (Khan
et al., 2021), speech recognition (Madanian et al.,
2023), cybersecurity (Cosma et al., 2021), agriculture
(Meshram et al., 2021), medicine (Chakraborty et al.,
2023; Sudharsan and Thailambal, 2023), etc.
The field of medicine and healthcare has under-
gone rapid evolution and advancement in the last
years (Chakraborty et al., 2023), especially driven
by the adoption of robust and efficient ML and deep
learning (DL) technologies. ML applications in the
medical sector are swiftly developing, leading to fast
improvement, reshaping the practice of medicine, and
enhancing the experiences of clinicians and patients
alike. Among the many benefits of ML and DL in
medicine, according to Aslam et al. (Aslam et al.,
2022), both streams of techniques can support clini-
cians in several key ways:
1. In predicting individuals susceptible to diseases,
enabling timely alerts to avoid triggers.
2. In early and accurate disease diagnosis, leading to
the use of therapeutic agents known to delay dis-
ease progression and enhance patient life quality.
3. In forecasting disease transformation by analyz-
ing various markers such as blood, cerebrospinal
fluid, radiological data, etc.
4. In predicting the efficacy of specific medications
in halting disease deterioration and enable effec-
tive treatment monitoring.
ML significantly enhanced the reliability, perfor-
mance, predictability, and accuracy of diagnostic sys-
tems for numerous diseases, such as Alzheimer’s dis-
ease (Sudharsan and Thailambal, 2023), Parkinson’s
disease (Govindu and Palwe, 2023), etc, but as far
as we know, this is the first work that uses ML ap-
proaches in the detection of amyotrophic lateral scle-
rosis disease using orofacial gestures.
1.1 Main Contributions
The scope of our paper is to develop predictive mod-
els through ML methods for early ALS detection us-
ing orofacial gestures. As far as we know, there are
no studies sought to predict ALS development. This
research fills this gap by focusing on the development
of ML models able to handle clinical data from ALS
patients, facilitating the accurate classification of the
presence or absence of ALS. Through our approach,
we plan to assist in the early detection and manage-
ment of this irreversible neurodegenerative disease.
Our main contributions are outlined in the follow-
ing:
1. From medical perspective, as far as we know, it is
the first appoach to use ML techniques for early
ALS detection using orofacial gestures.
2. From the perspective of algorithm design, we de-
signed four ML techniques: K-Nearest Neighbors
(KNN), the Iterative Dichotomizer 3 (ID3), Naive
Bayes and Logistic regression for predicting indi-
viduals susceptible to ALS disease.
3. From the perspective of empirical evaluation,
computational experiments were performed to as-
sess the performance of the considered ML tech-
niques on the only existing clinical dataset from
ALS patients provided by the Sunnybrook Re-
search Institute from Toronto. The achieved re-
sults were analyzed, evaluated and interpreted.
The remainder paper is structured as follows: the
second section describes in details the data set from
ALS patients provided by the Sunnybrook Research
Institute from Toronto and the used data preprocess-
ing, Section 3 describes the proposed ML techniques:
K-Nearest Neighbors, the Iterative Dichotomizer 3,
Naive Bayes and Logistic Regression, for detection of
ALS using orofacial gestures. In Section 4, we report
the achieved experimental results based on computa-
tional experiments on the clinical dataset from ALS
patients. The achieved results were analyzed, eval-
uated and interpreted. Finally in Section 5, we for-
mulate some conclusions and outline further research
directions.
2 DATASET DESCRIPTION AND
PREPROCESSING
The Toronto NeuroFace dataset (Bandini et al., 2020)
comprises data from 36 participants, including 10
with ALS, 15 who have experienced a stroke (post-
stroke), and 11 healthy individuals forming the con-
trol group. The data for each group is organized into
separate folders, each containing:
• Videos: recordings of orofacial actions in .avi
format, with filenames indicating subject ID and
action ID. Actions include: repeating the sentence
”Buy Bobby a Puppy” (BBP NORMAL), repeat-
ing the syllable /pa/ rapidly (DDK PA), repeating
the syllables /pataka/ rapidly (DDK PATAKA),
pursing the lips like blowing out a candle
(NSM BLOW), pressing lips like a kiss
(NSM KISS), maximum mandible open-
ing (NSM OPEN), smiling with closed lips
(NSM SPREAD), big smile (NSM BIGSMILE),
raising eyebrows (NSM BROW).
Machine Learning Approaches in the Detection of Amyotrophic Lateral Sclerosis Disease Using Orofacial Gestures
1133

• Frames: the extracted frames from the videos,
saved in .jpg format, and utilized for the analy-
ses presented in both the original article (Bandini
et al., 2020) and in our work. Each frame re-
tains the filename of the corresponding video. The
frames used for analysis were extracted uniformly
from each video based on a fixed frame rate, en-
suring consistent representation across all actions
and participants.
• Landmarks
gt: These files, formatted in .txt, en-
compass 68 points (or landmarks) delineating the
facial features of each participant within the afore-
mentioned frames. Each video corresponds to a
.txt file bearing the same name. Within each file,
the landmarks are presented in a standard CSV
(comma-separated values) format, with the initial
column denoting the annotated frame number. We
employed these landmarks comprehensively, aug-
menting them with an extra 2D series and a set of
3D landmarks for each frame.
• Bbox gt: These .txt files contain bounding boxes,
which are rectangles encompassing all the points
or the entire face, derived from the 68 landmarks.
Each video corresponds to a .txt file bearing the
same number. Within each file, the coordinates of
the top-left (x
1
, y
1
) and bottom-right (x
2
, y
2
) cor-
ners are presented in CSV format, with the ini-
tial column indicating the annotated frame num-
ber. However, these data were not utilized in our
study.
• VideoInfoFile Spreadsheet: file that contains ad-
ditional information about videos, such as du-
ration (in seconds), frame rate (fps), number of
frames, format, and image size.
• VID DATASET Clinical Information Spread-
sheet: file that describes the demographic (age,
sex) and clinical information (duration of condi-
tion, etc.) of the specific groups.
• SLP Assessment Spreadsheet: This document
records the evaluations of two trained speech ther-
apists (SLP1 and SLP2) who rated each video
based on a scale from 1 (indicating normal func-
tioning) to 5 (reflecting severe dysfunction) across
various parameters including symmetry, range of
motion (ROM), variability, and fatigue induced
by orofacial movements. The total of these five
scores was aggregated as ”All”.
To conduct this investigation, we examined vari-
ous factors influencing the incidence of amyotrophic
lateral sclerosis (ALS). Notably, race emerged as a
significant factor, as highlighted by (Rechtman et al.,
2015), while gender and age played comparatively
lesser roles. According to the report from (Rechtman
et al., 2015), 93% of ALS patients are of white eth-
nicity, with males comprising 60% of the cases.
The original dataset included age and gender in-
formation for participants but omitted race. To rec-
tify this aspect, we had two options. The first in-
volved manually attributing race based on participant
images, a feasible task given the dataset’s modest size
of 36 participants. However, we opted for a more au-
tomated approach to ensure future scalability. Con-
sequently, we utilized deep learning, specifically em-
ploying the DeepFace module for race detection.
For accurate race detection, we analyzed all im-
ages in the dataset. Results from analyzing all frames
for each participant were saved in a .csv file, consider-
ing that single-frame analysis could yield inaccurate
results. Subsequently, we collated the results from
all files and identified the most frequently occurring
race, validated against participant images, as the cor-
rect race.
Among the 10 ALS participants, 6 were identified
as white, 3 as Hispanic Latino, and 1 as Asian, align-
ing with prior studies despite the limited sample size.
Conversely, only 3 out of 10 ALS participants were
male, with the majority of ALS patients being over
60 years old at the time of the study.
Since the original article on the Toronto Neuro-
Face dataset mentioned the use of the FAN model for
landmark extraction, we applied the same model to
our dataset. Both the 2D and 3D FAN algorithms (Bu-
lat and Tzimiropoulos, 2017) were utilized on each
frame.
Although we used the same model, our results
diverged slightly from those of the original dataset.
However, upon comparing variants against analyzed
pictures, we found negligible discrepancies between
the results and reality, attributing any differences to
variations in the deep learning model across runs.
In our research, we used the 3D detection. A ma-
jor advantage of using three-dimensional landmarks is
that each one of the 68 orofacial landmarks is repre-
sented by three coordinates, which results in 204 fea-
tures (compared to 136 in the two-dimensional case).
This means that the data frame used has a total of
208 columns (204 landmark data, the age, race and
the group of the subject) and 6229 rows (one for each
frame).
Transitioning from simple files to a more robust
database management system, we migrated all infor-
mation into a MongoDB database. This process en-
compassed three types of files: participant data (up-
dated from the previous step), original dataset land-
marks, and our generated landmarks. Each partici-
pant data file was read and added as a document to the
database, while corresponding landmarks from each
ICAART 2025 - 17th International Conference on Agents and Artificial Intelligence
1134
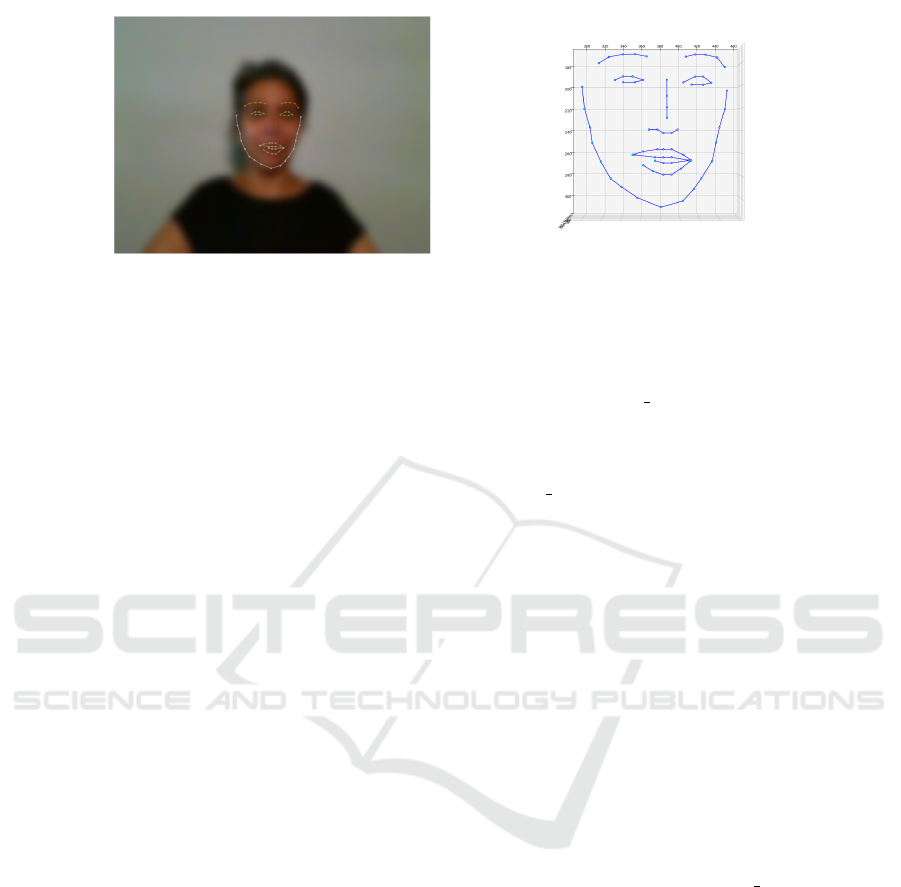
Figure 1: 2D and 3D orofacial point detection from a frame.png.
.txt file associated with the videos were also inserted
into the database.
3 ML-BASED TECHNIQUES FOR
DETECTION OF ALS USING
OROFACIAL GESTURES
The proposed approach gathers information from the
extended version of the Toronto NeuroFace dataset.
The data is subjected to preprocessing, analysis, and
the resulting attributes are stored in our database.
Four models: K-Nearest Neighbors, the Iterative Di-
chotomizer 3, Naive Bayes, and Logistic Regression
are trained using 80% of the data set. These mod-
els are trained to classify whether a patient has ALS
based on the data provided. Afterwards, the models
are tested on the remaining 20% of the data set and
evaluated in terms of accuracy and prediction time.
All frames from a single participant were used as the
testing set, with the model trained on frames from
the remaining participants. This ensured no over-
lap between training and testing data, allowing the
evaluation to focus on the model’s ability to general-
ize across different individuals rather than relying on
participant-specific patterns. Figure 2 illustrates the
overall implemented process.
3.1 K-Nearest Neighbors (KNN)
The K-Nearest Neighbors (KNN) algorithm classifies
a point by checking the K nearest neighbors and as-
signing the most common class among them. It works
best when data clusters are identifiable.
To use KNN, we converted all features to numer-
ical values and plot them in an n-dimensional space,
where n is the number of features. While effective for
simple tasks, KNN has limitations. It requires signif-
icant computation for distance calculations and high
memory usage, as it relies on the entire dataset for
predictions, unlike logistic regression which uses spe-
cific records.
To implement the KNN algorithm, we used a
function euclidean distance that calculates the
Euclidean distance. The init method sets the number
of neighbors, usually to 5, and the fit method initial-
izes the known data. To predict, the predict method
uses the predict helper to find the K closest points,
determine their most common class, and return that
class.
3.2 The Iterative Dichotomizer 3 (ID3)
The Iterative Dichotomizer 3 (ID3) algorithm con-
structs decision trees from labeled datasets. Each
node in the tree represents an attribute, the links de-
note decision rules, and the leaves show outcomes.
ID3 builds a decision tree from training data to clas-
sify new instances and can also be adapted for regres-
sion. To choose attributes for branching, ID3 calcu-
lates the entropy, measuring the quality of the splits.
Zero entropy means complete homogeneity (all in-
stances in the same class), while entropy of one in-
dicates an even distribution among classes. The en-
tropy is calculated in the method entropy from the
DecisionTree class, based on the following formula:
Entropy(S) = −
c
∑
i=1
p
i
log
2
(p
i
),
where S is the dataset, c is the number of classes in
the dataset, in our case whether or not the subject
has ALS and p
i
is the probability of occurrence of
class i in S. Since entropy measures the ”lack of or-
der”, a lower value is better. However, leaf nodes with
zero entropy can slow the algorithm for large datasets.
To address this aspect, we used simultaneously the
following stopping conditions: maximum tree depth
reached, entropy change below a predefined thresh-
old and node size falls below a minimum threshold.
A Node class was designed for the decision tree struc-
ture with the following attributes:
Machine Learning Approaches in the Detection of Amyotrophic Lateral Sclerosis Disease Using Orofacial Gestures
1135
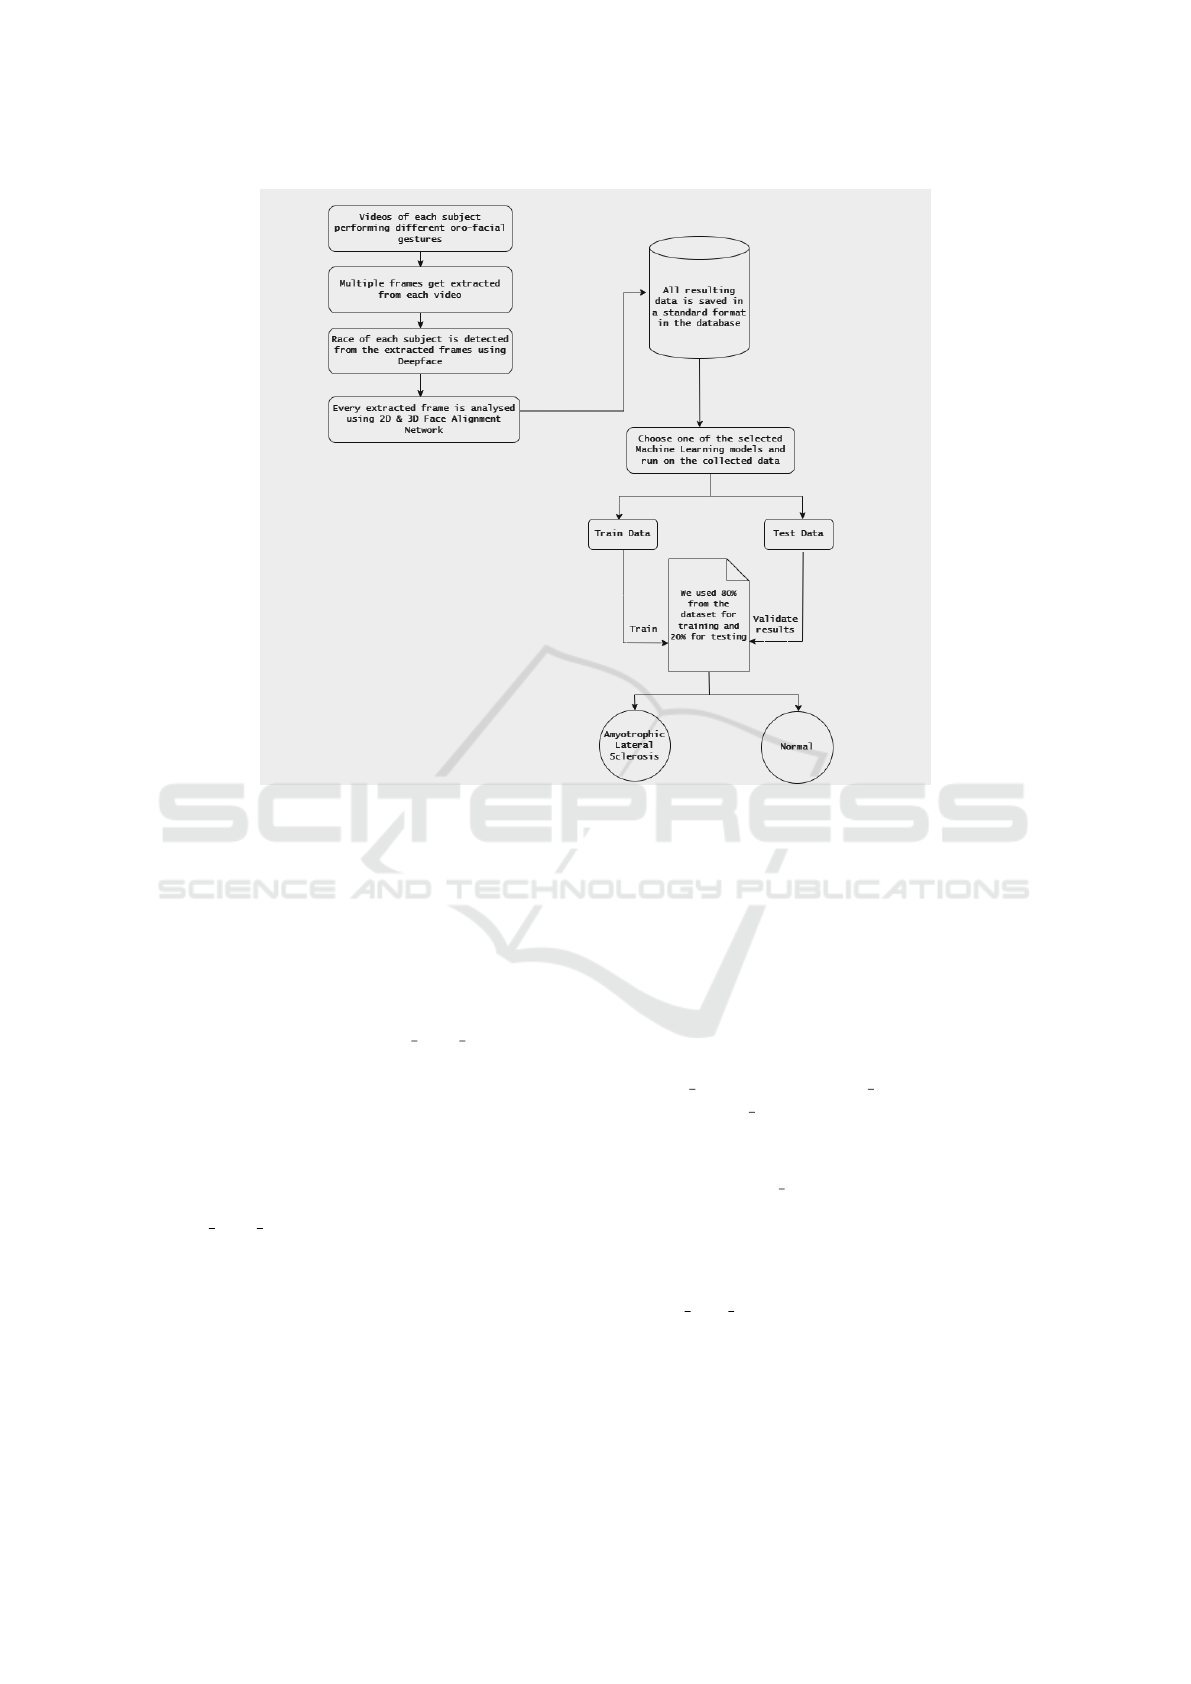
Figure 2: The developed architecture.
• Feature: Attribute for splitting.
• Threshold: Value dividing elements into two
groups.
• Left: Indices of elements in the ”left” group.
• Right: Indices of elements in the ”right” group.
• Value: Majority category of elements in the node.
For leaf nodes, only Value is set, while non-terminal
nodes use all attributes. The is leaf node method
checks if a node is a leaf by verifying if Value is not
None. The DecisionTree class manages the decision
tree. Its init method sets stopping conditions and
initializes the root node as None. We have two public
methods: fit for training and predict for making
predictions.
1. fit initializes the root node and builds the tree us-
ing grow tree method, updating node elements,
checking stopping conditions, and splitting based
on the best method.
2. predict traverses the tree to return the classifica-
tion result for the input data.
3.3 Naive Bayes
Naive Bayes is a supervised classification model
based on Bayes’ Theorem. It calculates the condi-
tional probability p(C
l
|x
1
, x
2
, ..., x
n
) for each class C
l
given a vector x = (x
1
, x
2
, ..., x
n
) of n features. Its key
advantage is computational efficiency, especially with
large datasets.
In our paper, we implemented this model in
Python with the ”NaiveBayes” class, featuring:
1. The fit method trains the model by storing
the number of samples and features, determin-
ing possible classes from unique values in y
(the training results), and initializing the mean
(self. mean), variance (self. var), and prior proba-
bilities (self. priors). Then, it calculates the mean
and variance of features for each class.
2. The predict method returns predictions for all
elements. The predict method classifies an el-
ement by calculating the product of probabilities
for each feature, using the generalized Bayes The-
orem. To handle very small probability products,
it sums the logarithms of these probabilities.
3. The prob density method computes the probabil-
ity of a feature indicating a final class using the
Gaussian distribution.
ICAART 2025 - 17th International Conference on Agents and Artificial Intelligence
1136

3.4 Logistic Regression
Logistic Regression is used for binary classification
tasks where the outcome is categorical with two pos-
sible values. It models the probability of an input be-
longing to a particular class. In Python, we imple-
mented this model with a class that includes:
• learning rate to adjust the speed of updating
weights and bias, with low rates causing slow
learning and high rates risking overshooting,
• nr iterations for the number of training itera-
tions,
• weights for feature weights,
• bias as the correction term.
The init method initializes these fields, and the fit
method trains the model using data x and outcomes y.
It stores the number of samples in nr samples and
features in nr features. During training, predic-
tions are made by multiplying input data by weights
and adding the bias. These linear predictions are then
converted into probabilities using the sigmoid func-
tion:
S(x) =
1
1 + e
−x
.
The sigmoid function is crucial in logistic regression,
converting linear combinations of input features into
probabilities between 0 and 1. The predict method
uses the trained model to predict outcomes for new
data, following the same process as during training,
and rounds results to 0 or 1.
4 EXPERIMENTAL RESULTS
AND PERFORMANCE
ANALYSIS
The aim of our paper was to develop an efficient
method of detecting amyotrophic lateral sclerosis
(ALS) disease using orofacial gestures. We used
the Toronto NeuroFace dataset (Bandini et al., 2020)
which contains data from 36 participants, including
10 with ALS, 15 who have experienced a stroke (post-
stroke), and 11 healthy individuals who make up the
control group. We compared four different ML tech-
niques and how they affected our models. Specifi-
cally, we used the following ML algorithms: KNN,
ID3, Naive Bayes and logistic regression. We divided
the sample into two categories of data in order to as-
sess the performance of the suggested strategy utiliz-
ing the Toronto Neuro Face dataset (Bandini et al.,
2020). The first group is made up of the training sam-
ples, which consists of 80% of the total samples. The
system will be tested, validated, and its accuracy will
be verified using the remaining samples.
4.1 Implementation
The experimental study has been executed on one
desktop PC running Windows 11 Pro 23H2, AMD
Ryzen 7 7700 CPU, 32 GB RAM DDR5 RAM and
one NVIDIA GeForce GTX 1060 with 6 GB GDDR5
VRAM. The algorithms and models were imple-
mented in Python programming language. We have
also used the DeepFace library for the extraction of
other relevant data in the prediction of amyotrophic
lateral sclerosis. Specifically, we used this library to
detect a person’s age, gender, current emotion, and
race from images.
4.2 Performance Evaluation
Assessment of classifier performance involves the use
of evaluation metrics. In our study, we used both
the confusion matrix and the classification report that
shows the accuracy, precision, recall, and F1-score.
The confusion matrix organizes actual class in-
stances along rows and predicted class occurrences
along columns. It outlines four potential outcomes:
True Positives (TP), i.e. the number of instances ac-
curately classified as belonging to the positive class;
True Negatives (TN), i.e. the number of instances ac-
curately classified as belonging to the negative class;
False Positives (FP), i.e. the number of instances that
are incorrectly classified as belonging to the positive
class, and False Negatives (FN), i.e. the number of in-
stances that are incorrectly classified as belonging to
the negative class. For further details, see (Jayaswal,
2021).
Accuracy is a metric that measures the frequency
with which a ML model correctly predicts the out-
come. Accuracy is computed based on the following
formula:
Accuracy =
T P + T N
T P + T N + FP + FN
Precision can be seen as a metric that reflects the
exactness of a classifier. It is calculated for each class
as the ratio of true positives to the sum of true posi-
tives and false positives.
Recall is a metric that measures the thoroughness
of a classifier, indicating its ability to correctly iden-
tify all positive instances. These metrics are com-
puted according to the following formulas:
Precision =
T P
T P + FP
, Recall =
T P
T P + FN
Machine Learning Approaches in the Detection of Amyotrophic Lateral Sclerosis Disease Using Orofacial Gestures
1137
F1-Score represents the harmonic mean of preci-
sion and recall, taking into account both false posi-
tives and false negatives.
F1 − Score =
2 × Precision × Recall
Precision + Recall
.
4.3 Experimental Results
Table 1 illustrates the results achieved by our consid-
ered ML models for detection of ALS disease using
orofacial gestures on the Toronto NeuroFace dataset
(Bandini et al., 2020). For each considered ML model
we provide the the accuracy, precision, recall, F1-
score, training time and prediction time. Both com-
putational times were measured in seconds.
Both traditional ML ID3 and Naive Bayes algo-
rithms achieved the best results, achieving an accu-
racy of 100%. But the training time in case of ID3 is
much higher than the corresponding training time of
the Naive Bayes. Therefore, the Naive Bayes model
seems to be the better one based on the accuracy re-
sults and computational times.
KNN has the lowest accuracy and the correspond-
ing prediction time is high, therefore, we can con-
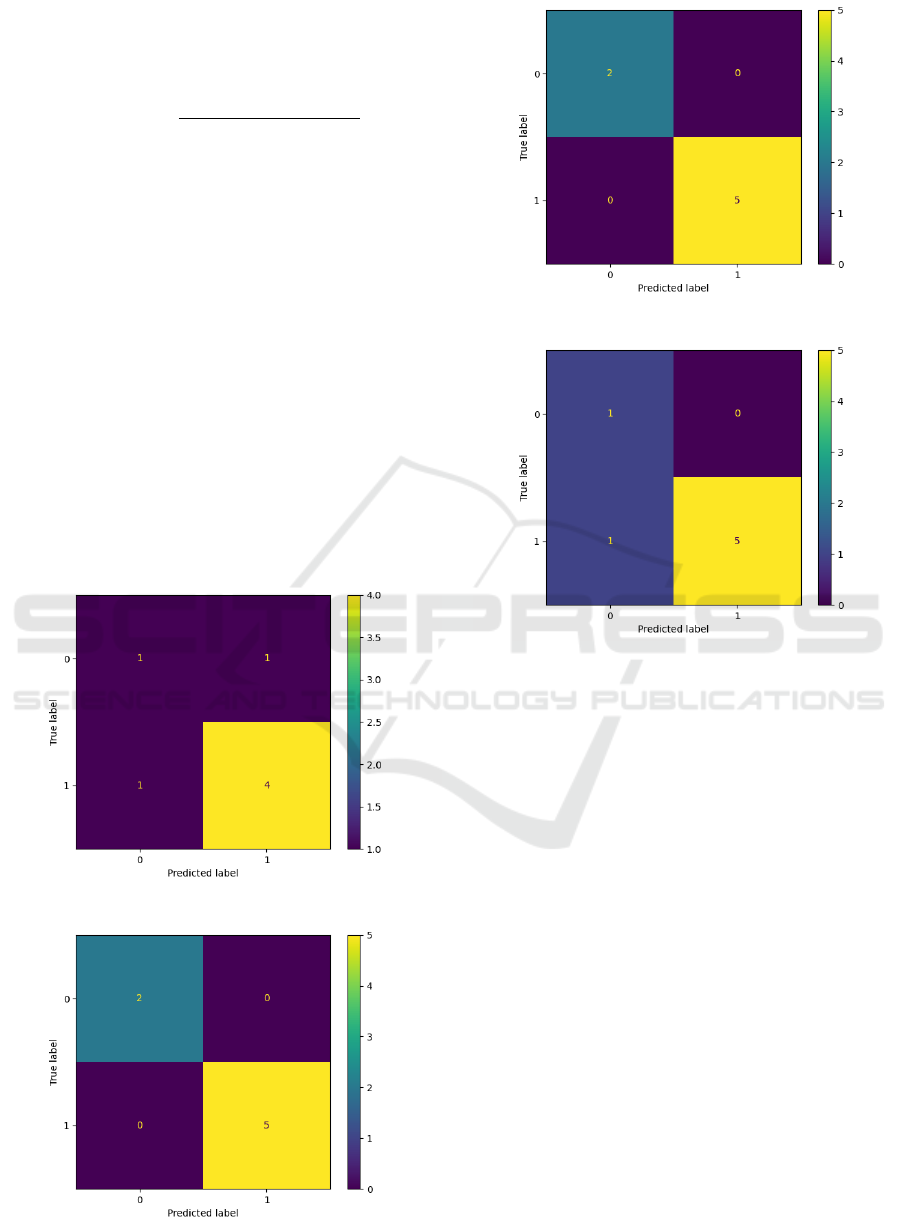
Figure 3: Confusion matrix for KNN.
Figure 4: Confusion matrix for ID3.
Figure 5: Confusion matrix for Naive Bayes model.
Figure 6: Confusion matrix for Logistic regression model.
clude that this model is the worst of the considered
ML models. The confusion matrix of this model is il-
lustrated in Figure 3, and the classification of the out-
comes into the four categories is: T N = 1, FN = 1,
T P = 4 and FP = 1.
ID3 has perfect accuracy but the training time is
the worst from the investigated models. This model
has a very good prediction time. The confusion ma-
trix of this model is illustrated in Figure 4, and the
classification of the outcomes into the four categories
is: T N = 2, FN = 0, T P = 5 and FP = 0.
Naive Bayes model performs best for our dataset
and has the higher accuracy. This model has the short-
est training time and acceptable prediction time. The
confusion matrix of this model is illustrated in Figure
5, and the classification of the outcomes into the four
categories is: T N = 2, FN = 0, T P = 5 and FP = 0.
Logistic Regression has an accuracy of 85% and
reasonable training and prediction times. The confu-
sion matrix of this model is illustrated in Figure 6,
and the classification of the outcomes into the four
categories is: T N = 1, FN = 1, T P = 5 and FP = 0.
ICAART 2025 - 17th International Conference on Agents and Artificial Intelligence
1138

Table 1: Machine learning model’s performance.
ML model Accuracy Precision Recall F1-score Training time Prediction time
KNN 71.42% 0.5 0.5 0.5 0.0029 17.8924
ID3 100% 1 1 1 85.4265 0.0025
Naive Bayes 100% 1 1 1 0.0025 0.0231
Logistic Regression 85.71% 1 0.5 0.66 0.4051 0.0023
5 CONCLUSIONS
In this paper, we proposed using machine learning ap-
proaches to diagnose the amyotrophic lateral sclerosis
by using orofacial gestures.
Our results reveal that both traditional ID3 and
Naive Bayes ML algorithms obtained the best results,
achieving an accuracy of 100%. The training time in
case of ID3 is much higher than the corresponding
training time of the Naive Bayes. Therefore, we can
conclude that the Naive Bayes algorithm obtained the
best accuracy within a short computational time.
In the future, we plan to collaborate with medical
institutions to expand the dataset by collecting videos
from a larger and more diverse pool of patients. This
will enhance the dataset’s representativeness and sup-
port the development of more accurate and scalable
prediction models using ML algorithms and DL tech-
niques. As well, we plan to develop a web application
accessible to anyone interested in assessing the pres-
ence of ALS symptoms. Such an application holds
the potential to revolutionize screening and diagnosis
efforts, leading to earlier detection of ALS.
Our research marks a major progress in the early
detection of ALS, and we do hope that these findings
will encourage the use of ML approaches in the de-
tection of ALS disease using orofacial gestures.
REFERENCES
Arthur, K. C., Calvo, A., Price, T. R., Geiger, J. T., Chio, A.,
and Traynor, B. J. (2016). Projected increase in amy-
otrophic lateral sclerosis from 2015 to 2040. Nature
communications, 7(1):12408.
Aslam, N., Khan, I. U., Bashamakh, A., Alghool, F. A.,
Aboulnour, M., Alsuwayan, N. M., Alturaif, R. K.,
Brahimi, S., Aljameel, S. S., and Al Ghamdi, K.
(2022). Multiple sclerosis diagnosis using machine
learning and deep learning: challenges and opportuni-
ties. Sensors, 22(20):7856.
Bandini, A., Rezaei, S., Guar
´
ın, D. L., Kulkarni, M., Lim,
D., Boulos, M. I., Zinman, L., Yunusova, Y., and Taati,
B. (2020). A new dataset for facial motion analysis in
individuals with neurological disorders. IEEE Journal
of Biomedical and Health Informatics, 25(4):1111–
1119.
Bulat, A. and Tzimiropoulos, G. (2017). How far are
we from solving the 2d & 3d face alignment prob-
lem?(and a dataset of 230,000 3d facial landmarks).
In Proceedings of the IEEE international conference
on computer vision, pages 1021–1030.
Chakraborty, C., Bhattacharya, M., Pal, S., and Lee, S.-
S. (2023). From machine learning to deep learn-
ing: An advances of the recent data-driven paradigm
shift in medicine and healthcare. Current Research in
Biotechnology, page 100164.
Cosma, O., Macelaru, M., Pop, P. C., Sabo, C., and Zelina,
I. (2021). A comparative study of the most impor-
tant methods for forecasting the ict systems vulner-
abilities. In Computational Intelligence in Security
for Information Systems Conference, pages 224–233.
Springer.
Govindu, A. and Palwe, S. (2023). Early detection of
parkinson’s disease using machine learning. Procedia
Computer Science, 218:249–261.
Jayaswal, V. (2021). Performance metrics: Confusion ma-
trix, precision, recall, and f1 score. towards data sci-
ence.
Khan, A. A., Laghari, A. A., and Awan, S. A. (2021). Ma-
chine learning in computer vision: a review. EAI En-
dorsed Transactions on Scalable Information Systems,
8(32):e4–e4.
Madanian, S., Chen, T., Adeleye, O., Templeton, J. M.,
Poellabauer, C., Parry, D., and Schneider, S. L. (2023).
Speech emotion recognition using machine learn-
ing—a systematic review. Intelligent systems with ap-
plications, page 200266.
Meshram, V., Patil, K., Meshram, V., Hanchate, D., and
Ramkteke, S. (2021). Machine learning in agriculture
domain: A state-of-art survey. Artificial Intelligence
in the Life Sciences, 1:100010.
Rechtman, L., Jordan, H., Wagner, L., Horton, D. K., and
Kaye, W. (2015). Racial and ethnic differences among
amyotrophic lateral sclerosis cases in the united states.
Amyotrophic Lateral Sclerosis and Frontotemporal
Degeneration, 16(1-2):65–71.
Sudharsan, M. and Thailambal, G. (2023). Alzheimer’s dis-
ease prediction using machine learning techniques and
principal component analysis (pca). Materials Today:
Proceedings, 81:182–190.
Machine Learning Approaches in the Detection of Amyotrophic Lateral Sclerosis Disease Using Orofacial Gestures
1139
