
Analysis of Surface Thermal Behavior in Different Local Climate
Zones (LCZ): A Case Study in Bragança (Portugal) (2013-2024)
Cátia Rodrigues de Almeida
1,2,3 a
, Artur Gonçalves
3b
and Ana Cláudia Teodoro
1,2 c
1
Department of Geosciences, Environment and Land Planning, Faculty of Sciences, University of Porto,
Rua Campo Alegre, 687, 4169-007 Porto, Portugal
2
Earth Sciences Institute (ICT), Pole of the FCUP, University of Porto, 4169-007 Porto, Portugal
3
CIMO, LA SusTEC, Instituto Politécnico de Bragança, Campus de Santa Apolónia, 5300 253 Bragança, Portugal
Keywords: Urban Heat Island (UHI), Surface Urban Heat Island (SUHI), Remote Sensing (RS), Albedo, Land Use and
Land Cover (LULC), Land Surface Temperature (LST).
Abstract: The Urban Heat Island (UHI) effect occurs when temperatures in urban areas are higher than surrounding
vegetated areas, especially during the sunset and sunrise. UHI impacts include effects on public health and
well-being, changes to the local microclimate, and influence on the local biome. This study evaluates the Land
Surface Temperature (LST) and the corresponding Surface Urban Heat Island Intensity (SUHIint) across
different Local Climate Zones (LCZs) in Bragança (Portugal) from 2013 to 2024, using images from Landsat
8 and 9 data collected with a portable thermal camera on different surfaces to assess thermal behavior across
different scales. The results confirm the existence of the UHI effect in Bragança, where vegetated areas exhibit
milder temperatures compared to built areas, especially in summer afternoons. Satellite-derived LST data
indicate that the lowest temperature was recorded in an LCZ with vegetation, reaching (-7ºC), while the
highest minimum temperature was observed in an LCZ with higher density of anthropogenic elements (-3ºC).
Thermal camera measurements showed that surfaces such as asphalt and exposed soil reached 80 ºC in the
morning and remained above 60ºC in the afternoon. These findings underscore the importance of considering
mitigation measures, such as increasing vegetation in urbanized areas or replacing impervious surfaces.
1 INTRODUCTION
The viability of human life in each location requires
a series of adaptations in Land Use and Land Cover
(LULC), presenting a contemporary challenge. With
the global population expected to increase from 7.7
billion to 9.7 billion by 2050 (ONU, 2019), it is
essential to pay attention to the surface materials
incorporated in the construction of houses, railways,
commerce, industry, etc. (Oke, 1987; Weng, 2003).
Urbanization can contribute to the formation of the
Urban Heat Island (UHI) effect, characterized by
higher temperatures in urbanized areas compared to
surrounding rural areas (Imhoff et al., 2010; Oke,
1982). A specific approach to this phenomenon is the
Surface Urban Heat Island (SUHI), which assesses
temperature differences based on temporal variability
a
https://orcid.org/0000-0003-4455-9407
b
https://orcid.org/0000-0002-4825-6692
c
https://orcid.org/0000-0002-8043-6431
and surface characteristics (Voogt & Oke, 2003;
Weng & Fu, 2014).
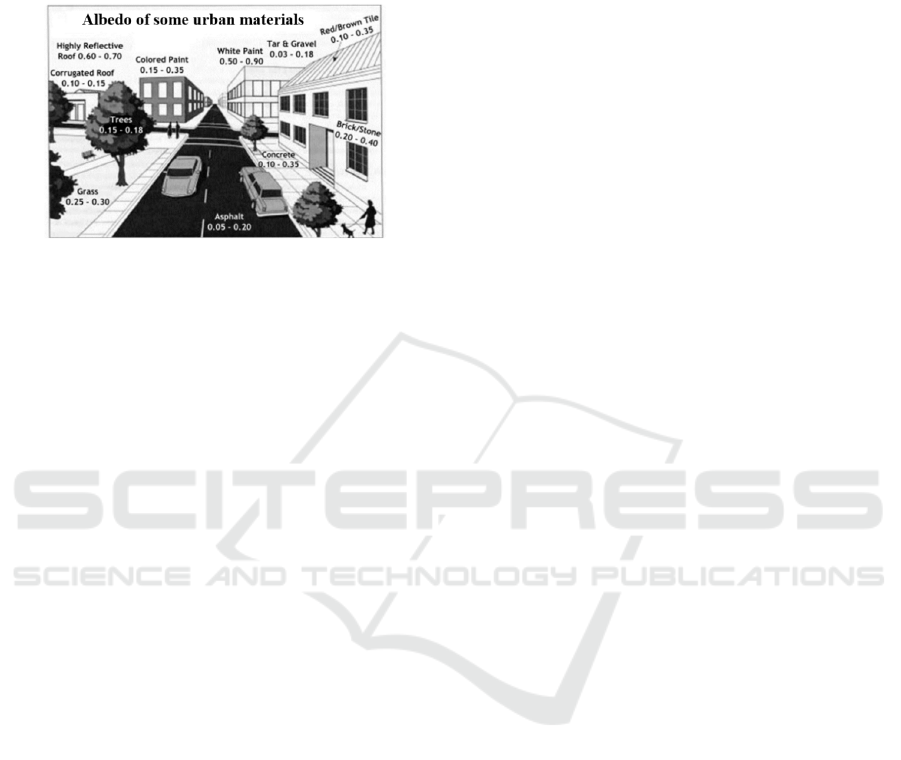
SUHI occurs mainly due to the characteristics of
anthropogenic elements in the urban landscape, such
as asphalt, sidewalks, and streets (Oke, 1988). These
materials have a low albedo, meaning they reflect less
solar radiation and retain more heat (Coakley, 2003).
Figure 1 shows some materials found in an urban
context, along with their respective albedo rates. As
observed, most anthropogenic materials exhibit low
reflectance.
Beyond albedo, the Local Climate Zones (LCZ)
methodology was developed to classify urban and
rural environments based on the local landscape and
physical and thermal characteristics, such as land
cover, terrain structure, building density, surface
materials. LCZs are divided into various categories:
Rodrigues de Almeida, C., Gonçalves, A. and Teodoro, A. C.
Analysis of Surface Thermal Behavior in Different Local Climate Zones (LCZ): A Case Study in Bragança (Portugal) (2013-2024).
DOI: 10.5220/0013282700003935
In Proceedings of the 11th International Conference on Geographical Information Systems Theory, Applications and Management (GISTAM 2025), pages 157-164
ISBN: 978-989-758-741-2; ISSN: 2184-500X
Copyright © 2025 by Paper published under CC license (CC BY-NC-ND 4.0)
157
on one hand, built zones (urban), including blocks of
buildings and residential areas with little or no
vegetation, and on the other, natural zones (rural),
such as forests, parks, water surfaces, etc. (Errea et
al., 2023; Stewart & Oke, 2012).
Figure 1: The albedo of urban materials (adapted from
(EPA - United States Environmental Protection Agency,
n.d.)).
Remote Sensing (RS) is a methodology applied to
understand UHI using data collected by thermal
sensors placed on various platforms. The sensors
record the electromagnetic radiation emitted or
reflected by surfaces without physical contact with
the sampled surface, enabling the calculation of Land
Surface Temperature (LST) (Pachêco, 2001; Weng et
al., 2004). The satellite mission most commonly used
for LST calculation, with freely available data
distribution, is Landsat, which has included a thermal
sensor since Landsat 4 (operational from July 1982 to
June 2001) to Landsat 9 (launched in September
2021) (Almeida et al., 2021; US Geological Survey,
n.d.-a; Zhou et al., 2019). In addition to satellite data,
portable thermal cameras with in situ data collection
can complement the methodology, allowing for a
more detailed analysis of surface reflectance.
The objective of this study is to evaluate the UHI
effect in Bragança (Portugal) using LST data from
Landsat 8 and 9 between 2013 and 2023, along with
LST data from a portable thermal camera collected
during five field campaigns between 2023 and 2024,
divided into summer and winter, to assess the
seasonal influence on the results.
The choice of Bragança is based on: i) its
mountainous setting, which naturally influences wind
circulation and speed, potentially contributing to UHI
formation; ii) centralized urban densification with
surrounding vegetated areas; iii) its classification into
seven distinct LCZs, facilitating the understanding of
its LULC; and iv) as a supplement to the existing
literature, as Bragança's UHI has already been
analyzed using RS images and compared with Air
Temperature (Ta) data from a monitoring network
with 23 weather stations distributed across seven
LCZs between June 29, 2013, and July 5, 2021. In
summer, the correlations were strong and very strong,
while in winter, they were very strong in all sensors,
confirming similar thermal behavior in both
parameters (Almeida et al., 2022, 2023; Menezes,
2017).
Our hypothesis is that the integration of RS data
acquired by satellites and thermal cameras can
confirm the identification of the UHI effect in
Bragança and inspire other researchers to implement
similar approaches, contributing to the advancement
of knowledge and promoting discussions on the need
for sustainable urban planning, including the adoption
of high albedo materials and green infrastructure to
mitigate the UHI effect (Nations, n.d.). The LST
measured by satellites and thermal cameras differs in
specificity, with expected errors due to spatial
resolution and ground proximity. Landsat 8 and 9
sensors acquire LST at 100m, resampled to 30m,
limiting the detection of small transition areas.
Additionally, the altitude difference reduces
atmospheric influences on ground-level data, as
thermal cameras capture at 1.5m, while satellites
operate from 705 km.
2 METHODOLOGY
2.1 Study Area
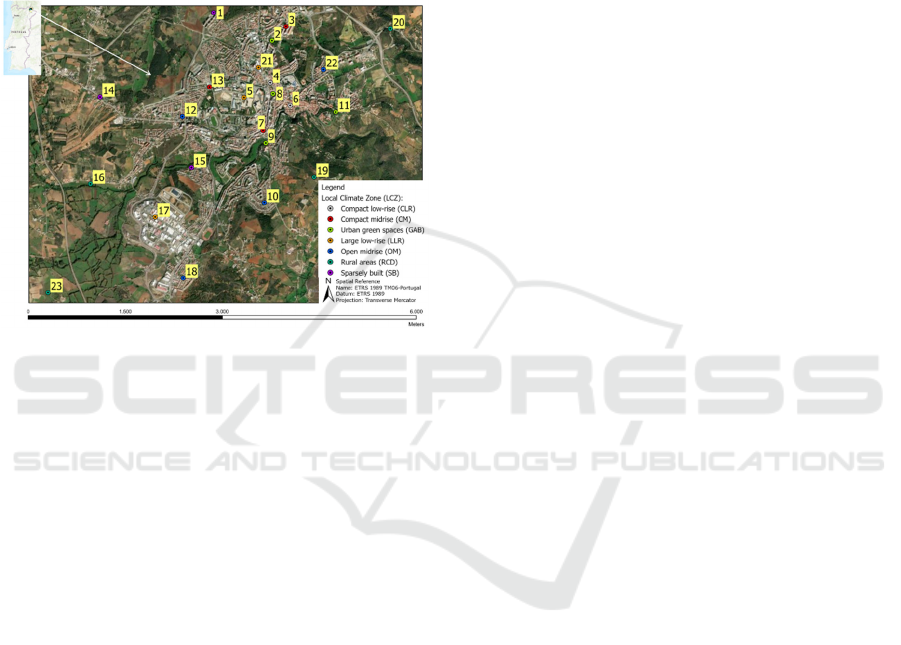
Located in the northeastern of Portugal (41º48'20" N,
6º45'42" W), the municipality of Bragança has an area
of approximately 1,174 km² and, according to the last
census conducted in 2021, has a population of 35,341
inhabitants (Bragança, n.d.; INE, n.d.) (Figure 2). It is
a region with complex terrain, significant variability
in elevation, and heterogeneous LULC, featuring
urban covers, agriculture, forested areas, exposed
soils, and natural and vegetated areas. Its economy
primarily focuses on public sector service companies
(Gonçalves et al., 2018).
Bragança is characterized by a Mediterranean
climate, with dry summers and mild temperatures
(Csb), as defined in the Köppen-Geiger scale
(Barceló & Nunes, 2009). Two scales influence the
climate: i) regional, with the atmospheric circulation
present in transitional zones (between the ocean and
continents); and ii) a more detailed scale, influenced
by terrain and proximity to water bodies (lakes or
rivers). There are two main rivers in and around
Bragança: Fervença (which crosses the region) and
Sabor, which is located in a peripheral area and has
GISTAM 2025 - 11th International Conference on Geographical Information Systems Theory, Applications and Management
158
less local influence (Bragança, n.d.; Gonçalves et al.,
2018).
One of the environmental actions implemented in
Bragança is the extensive and continuous collection
of temperature and relative humidity data through
TGP-4500 model sensors, TinyTag, Gemini Data
Loggers, Chichester, UK, installed three meters
above the ground, enclosed in a protective white box,
semi-leveled on light poles, and oriented towards the
South.
Figure 2. Identification of the 23 Sensors used in this study
in Bragança, Portugal: Compact low-rise (CLR) (gray);
Compact midrise (CM) (red); Urban green spaces (GAB)
(light green); Large low-rise (LLR) (orange); Open midrise
(OM) (blue); Rural areas (RCD) (green); Sparsely built
(SB) (purple); (adapted from (Almeida et al., 2022)).
The installation criterion for the sensors
considered the different LCZs identified in Bragança,
ensuring at least three sensors in each class, namely:
i) Compact low-rise (CLR): historical city center,
including buildings with high density, medium-low
height, and presence of embedded bricks/stones
(sensors 4 and 6); ii) Compact midrise (CM): modern
high-density buildings, with paved surfaces and
medium-high height (sensors 3, 7, and 13); iii) Urban
green spaces (GAB): predominantly green, covered
by trees and low vegetation (sensors 2, 8, 9, and 11);
iv) Large low-rise (LLR): industrial and commercial
area, with paved parking lots, low or medium density,
featuring low and high buildings (sensors 5, 17, and
21); v) Open midrise (OM): streets with isolated or
low houses, of medium density (sensors 10, 12, 18,
and 22); vi) Sparsely built (SB): transition between
rural and urban environments, with scattered houses
in forested and agricultural areas (sensors 1, 14, and
15); and vii) Rural areas (RCD): isolated rural spaces
surrounding the city (sensors 16, 19, 20, and 23)
(Almeida et al., 2022; Gonçalves et al., 2018). The
data from these sensors enabled studies on UHI in the
region and surrounding areas, including
methodologies with Remote Sensing (Almeida et al.,
2022, 2023; Gonçalves et al., 2014, 2018).
2.2 Data Used and Processing
Conducted
2.2.1 Satellite Images
We used Google Earth Engine (GEE) for satellite
image processing, a cloud-based platform that
processes data remotely, reducing the need for
powerful computers and significantly minimizing
processing time, which already offers a series of
processed products (Hurni et al., 2017; NASA, n.d.-
a). We utilized the "LANDSAT/LC08/C02/T1_L2"
and "LANDSAT/LC09/C02/T1_L2" collections,
with overpass times around 11 AM in Bragança.
These satellites operate in a nearly polar and sun-
synchronous orbit at a nominal altitude of 705 km,
with an orbital inclination of 98.2°, and revisit the
same location every eight days, as they operate in
alternating orbits, improving temporal resolution for
the study areas (US Geological Survey, n.d.-a).
The thermal sensors record data at 100m, which is
resampled and made available to users at 30m. In
GEE, the collections are provided with
atmospherically corrected surface reflectance data,
and the LST is derived from the Land Surface
Reflectance Code (LaSRC), generated through a
single-channel algorithm developed in collaboration
between the Rochester Institute of Technology (RIT)
and NASA's Jet Propulsion Laboratory (JPL)
(NASA, n.d.-a).
We used the code for processing LST (NASA,
n.d.-b) and to filter the data for our study area between
2013 and 2024, considering only those with cloud
coverage below 20%. Subsequently, we used the
quality bands from each collection (QA_PIXEL) to
remove pixels with clouds and cloud shadows.
We utilized the thermal band (B10) from both
collections to obtain the LST. The spectral range is
from 10.6 to 11.19 µm, and the data are recorded at
100m and resampled to 30m. To convert the LST to
Celsius, we applied Equation (1) (NASA, n.d.-a; US
Geological Survey, n.d.-b).
LST = TIR f
O−
K
(1
)
Where LST is the Land Surface Temperature
(°C), TIR is the radiance in the thermal infrared band,
f
S
is the scale factor of Landsat 8 and 9 (0.00341802),
O is the offset of Landsat 8 and 9 (149.0) and K is the
conversion constant from K to °C (273.15).
Analysis of Surface Thermal Behavior in Different Local Climate Zones (LCZ): A Case Study in Bragança (Portugal) (2013-2024)
159

To evaluate the LST by LCZs, we used a .shp file
of points in GEE corresponding to the locations of the
23 sensors installed in Bragança to extract the LST
values for each of them, and we added a function to
export the data to a .csv file. Between 2013 and 2014,
we identified 158 images, with the first date being
06/29/2013 and the last being 09/15/2024.
Subsequently, we selected results where images
provided data for all 23 sensors, resulting in 123
images spanning all seasons. We further filtered the
data for summer and winter, obtaining 46 images for
summer and 15 for winter, which were used in the
processing. The lower number of winter images can
be attributed to meteorological conditions, with
higher cloud cover and precipitation during winter,
aligning with the Köppen-Geiger classification
(Barceló & Nunes, 2009).
To process and analyze the results, we calculated
the SUHI by applying Equation (2), a methodology
already used in other UHI studies (Almeida et al.,
2022; Menezes, 2017).
𝑆𝑈𝐻𝐼
=𝐿𝑆𝑇
− 𝐿𝑆𝑇
(2)
Where SUHI
Int
is the intensity value of the UHI at
each point; 𝐿𝑆𝑇
is the LST value extracted from
the sensor points; and 𝐿𝑆𝑇
refers to the average of
the LST values extracted the RCD sensors (16, 19, 20,
and 23).
To present the results, we used SPSS software to
create boxplots of the SUHI
int
results, separated by
LCZ and by seasonality (summer and winter), a
methodology already applied in other studies
(Almeida et al., 2022; Saher et al., 2021).
2.2.2 LST from Portable Thermal Camera
For in situ LST imaging, we used the HT Instruments
THT33 portable thermal camera, which has a
resolution of 80x80 pixels, a Field of View (FOV) of
21°x21°, a spectral range of 8 to 14 µm, and an
Instantaneous Field of View (IFOV) (@1m) of 4.53
mrad. Images were taken at a standard height of 1.5m
between the camera and the target to ensure
consistent operator-associated error across all
samples.
The collections were conducted only on clear,
cloud-free days, as these conditions affect
measurement accuracy. Consequently, three data
collection sessions were conducted: two in winter
(02/17/2023 and 02/20/2024) and one in summer
(07/27/2023). Since morning data collections had to
coincide with satellite overpass times, covering all 23
points with T
a
sensors was not feasible. Instead, ten
representative points were selected to capture spatial
diversity and ensure at least one representative for
each of the seven LCZs. The selected sensors, their
respective LCZs, and the number assigned to each
point for identification in the in situ collection are: i)
CM: sensor 3, point P08; ii) CLR: sensor 6, point P07;
iii) GAB: sensor 9, point P05; iv) SB: sensors 14 and
15, points P09 and P04; v) LLR: sensors 5 and 17,
points P06 and P03; vi) OM: sensors 18 and 22, points
P02 and P10; and vii) RCD: sensor 23, Point P01.
We assessed the diversity in LULC composition
for each selected point and sampled different surfaces
within a 10m radius of each sensor. We conducted
two measurements at each point: i) between 10 am
and 12 pm (within one hour before and after the
satellite’s overpass time in Bragança); and ii) between
1 pm and 3 pm to analyze temperature variability of
the sampled surfaces compared to the first session.
For each sampled surface, we took a photograph
using a Canon EOS 800D camera to classify it
afterward into the following categories: Vegetation;
Exposed soil; Road with stones; Sidewalk; Asphalt;
Sidewalk with shade; Asphalt with shade;
Cobblestone; Iron; Curb and Vegetation with shade.
Each surface is assigned a letter to differentiate its
LULC for the analysis. For example, five different
surfaces were collected at P01, labeled from P01A to
P01E.
The HTMercury33 application was used to
record, visualize, and export the LST results in .pdf
format (User Manual - HTMercury33, n.d.) We
created an R routine to extract specific data from the
.pdf files to Excel, specifically: S (temperature
associated with the fixed central cursor); H
(temperature of the hottest point in the image); C
(temperature of the coldest point in the image); and
Mean (average temperature). Subsequently, we
categorized the data by season (summer and winter)
and generated boxplots with the maximum and
minimum LST.
3 RESULTS AND DISCUSSION
3.1
SUHI
int
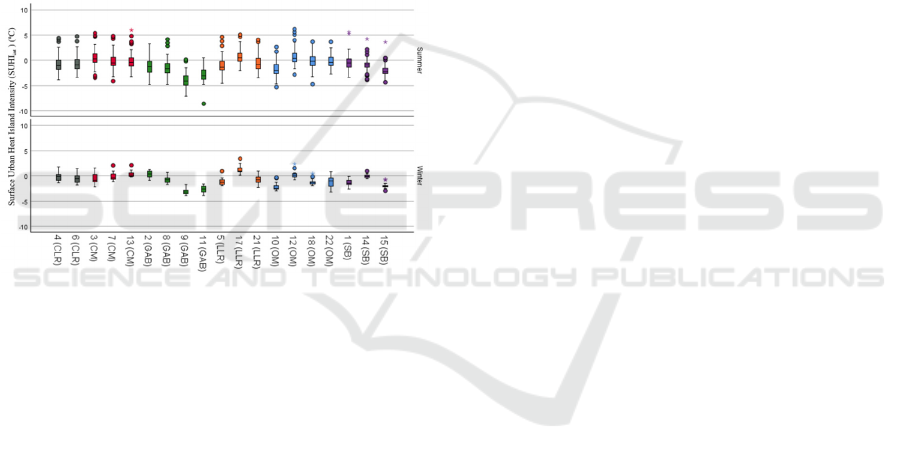
According to Figure 3, it can be observed that the
summer data exhibit greater amplitude and more
outliers compared to winter data, which may be
associated with a higher availability of solar radiation
during this season.
In the summer, most sensors showed negative
medians of SUHI
int
, except for sensors 3 (CM), 17
(LLR), and 12 (OM). In these three cases, the
surroundings allowed the entry of short-wave
GISTAM 2025 - 11th International Conference on Geographical Information Systems Theory, Applications and Management
160
radiation in the early hours of the day from the east
(sunrise), warming the surface in the early morning.
Additionally, the structures of the OM (12) and CM
(3) sensors, which contain medium-height buildings,
may interfere with heat exchange with the
environment due to shadow projection, making the
area less prone to heat accumulation (Zheng et al.,
2019). In the case of LLR (17), due to the presence of
heterogeneous profiles, including industrial and
commercial areas and paved parking lots, heat can be
absorbed, especially by elements with low albedo
(pavements, structures made of cement, etc.) (Zheng
et al., 2019). Still in summer, the three sensors that
exhibited the lowest medians consist of vegetation
elements, as in the case of sensors 9 and 11 (GAB)
and 15 (SB), reinforcing that the presence of
vegetation aids in regulating SUHI
int
(Dai et al.,
2019).
Figure 3. Boxplot illustrating the Surface Urban Heat Island
Intensity (SUHI
int
) across various Local Climate Zones
(LCZ). The zones are categorized as follows: i) Compact
Low-Rise (CLR) in gray; ii) Compact Midrise (CM) in red;
iii) Urban Green Spaces (GAB) in green; iv) Large Low-
Rise (LLR) in orange; v) Open Midrise (OM) in light blue;
and vi) Sparsely Built (SB) in purple.
In summer, regarding higher temperatures and
disregarding outliers, sensors 17 (LLR), 12, and 18
(OM) exhibited the highest values, reinforcing that
the presence of anthropogenic elements may
contribute to heat accumulation on the analyzed
surfaces (Oke, 1987, 1988; Voogt & Oke, 2003).
Finally, the lowest temperature is associated with
sensor 9 (GAB), reaffirming the importance of
preserving and prioritizing vegetation in spaces to
regulate heat (Miles & Esau, 2020).
In winter, the medians were mainly below 0,
except for sensors 13 (CM), 2 (GAB), 17 (LLR), and
12 (OM). Most of these sensors are integrated into
LCZs with the presence of anthropogenic materials,
converging with the values identified in summer,
except for sensor 2, which contains vegetation. This
behavior can be explained by the season: in winter,
vegetation enters a state of dormancy to protect itself
from cooler temperatures, reducing its metabolic
activities and, consequently, slowing down heat
exchanges. This also limits photosynthesis, as it does
in other seasons under similar conditions (Du et al.,
2016; French & Inamdar, 2010). There is also leaf
shedding in deciduous trees, known as senescence,
which may also contribute to this result (Mariën et al.,
2019).
As in summer, the highest temperatures are
associated with sensors containing anthropogenic
elements, as seen in sensors 17 (LLR), 4 and 6 (CLR),
and 3 (CM). In contrast, the lowest temperatures
occurred in sensors 9 and 11 (GAB), which contain
vegetation (Tang et al., 2017).
3.2 LST from Thermal Camera
The number of data points available in each
measurement session was 220 images (110 in the
morning and 110 in the afternoon) on 02/17/2023,
224 on 02/20/2024 (112 in each period), and 186 on
07/27/2023 (93 per period). The differences in sample
size are attributed to occasional measurement errors
related to the equipment. Figure 4 shows the recorded
LST values in summer across different surfaces, with
surface identification highlighted in the legend.
In general, summer temperatures are much higher
than winter temperatures due to increased
electromagnetic energy availability and solar angle,
which minimizes shadow projection. Some surfaces
reached nearly 80 ºC in the morning and above 60 ºC
in the afternoon, mainly asphalt and exposed soil. In
summer, vegetation also retains greater heat in the
morning and has cooler temperatures in the afternoon.
This can be explained by vegetation's prolonged
exposure to electromagnetic energy in the early hours
compared to built-up areas, which are shaded by
structures and accumulate less heat. In the afternoon,
the opposite is observed: vegetation temperatures
tend to be cooler due to latent heat exchange with the
environment, especially through evapotranspiration,
which reduces the heating of these surfaces, in
addition to the shading effect provided by tree
canopies. In urban areas with low albedo surfaces,
such as asphalt and concrete, the radiative balance
favors the absorption of short-wavelength radiation,
resulting in the surface heating of these areas (Oke,
1988; Yu et al., 2019).
In a more detailed LCZ analysis, at P07 (CLR), we
observe that the LULC materials such as asphalt and
elements of iron, along with the lack of vegetation,
contribute
to higher temperatures in summer,
Analysis of Surface Thermal Behavior in Different Local Climate Zones (LCZ): A Case Study in Bragança (Portugal) (2013-2024)
161
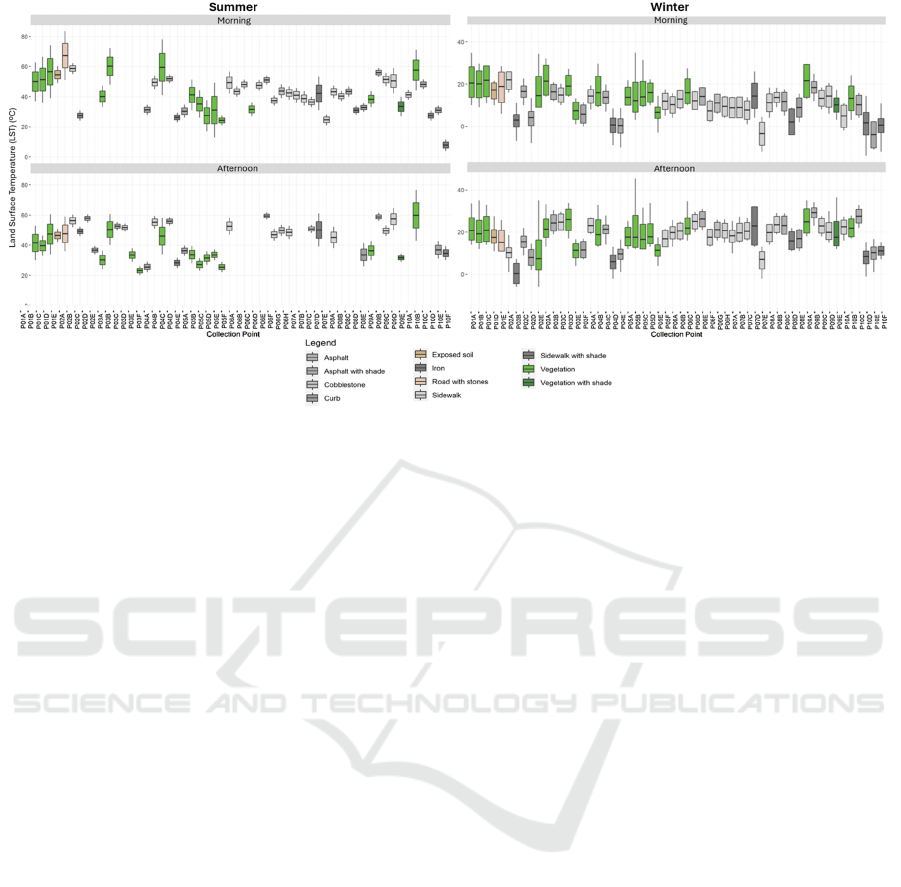
Figure 4. Boxplot of Land Surface Temperature (LST) at the ten in situ measurement points using a thermal camera.
particularly in the afternoon, due to the thermal inertia
of these materials, which accumulate heat throughout
the day. In winter, temperatures are slightly higher
than most vegetation classes, especially in the
afternoon (Cai et al., 2017). At P08 (CM), asphalt and
sidewalk temperatures were higher in summer than in
winter, both in the morning and afternoon, which may
be associated with the angle of electromagnetic
energy. In summer, this energy is more direct,
reducing shading from existing buildings in the area
(Yu et al., 2019).
At P05 (GAB), it is evident that vegetation created
a cooler microclimate, with lower temperatures than
densely built areas, especially in summer at both times
of the day. The LST values for these locations are
slightly lower in winter than in built-up areas,
although they represent a less pronounced cooling.
This could be associated with the lower radiation
levels and the vegetation’s dormancy process, which
reduces evapotranspiration and impacts natural
cooling, as discussed in the UHI
int
results (Rose,
2019).
At points P03 and P06 (LLR), both in summer and
winter, the LST showed higher values in paved areas,
similar to CM and CLR points, which may be due to
the lack of shading in the area. Regarding points P02
and P10 (OM), LST values in summer were more
moderate, with warmer asphalt areas and cooler
vegetated areas, particularly in the afternoon,
potentially helping to regulate local temperature. In
winter, due to lower construction density and
vegetation presence, temperatures were milder at
these points (Oke et al., 2017).
For points P04 and P09 (SB), in both summer and
winter, vegetation showed higher values in the
morning, possibly due to heat accumulation in the
early hours of the day, a similar effect to that observed
at point P01 (RCD). The absence of large vertical
barriers in open areas facilitates heat exchange with
the environment in the night, promoting heat
dissipation through convection. However, surface
characteristics and solar radiation absorption still
significantly influence daytime temperature retention
in these areas. For this reason, it is suggested that
UHI studies should be conducted after sunset,
incorporating additional methodologies such as the
use of Unmanned Aerial Vehicle (UAV), which
provide greater flexibility regarding the timing of data
collection.
Despite scale differences, the results were similar,
with higher surface temperatures in built-up areas,
reinforcing the need for mitigation measures.
Incorporating vegetated surfaces in densely
urbanized areas, such as green roofs and substituting
impermeable surfaces with alternatives like
permeable asphalt, is essential (Cai et al., 2017;
Gonçalves et al., 2014; Mullerova & Williams, 2019).
It is worth noting that, especially in summer,
additional data through field visits are necessary to
verify if these initial thermal behavior results are
consistent across time.
4 CONCLUSIONS
This study used RS data to assess surface thermal
behavior across different LCZs and identify the UHI
GISTAM 2025 - 11th International Conference on Geographical Information Systems Theory, Applications and Management
162

effect in Bragança. We utilized both satellite data and
in situ data collected from a thermal camera,
comparing the results from both techniques. In terms
of spatial resolution and measurement height, the two
methods differ: while Landsat is efficient for mapping
larger, more homogeneous areas, the use of the
thermal camera provides more detailed, localized
surface data, being less influenced by atmospheric
parameters and more effective at mapping
heterogeneous areas. This makes the integration of
these techniques particularly valuable for UHI studies.
The SUHI
int
, calculated from satellite data, was
higher in summer, especially in LCZs with
anthropogenic surfaces, compared to those with
vegetation, highlighting the influence of seasonality.
In situ measurements corroborated these results,
showing that impermeable surfaces retained more
heat, particularly during summer afternoons.
The analyses suggest that integrating green areas
and using high-albedo materials are strategies to
mitigate the UHI effect and promote climate resilient
cities. Future research could explore long-term UHI
dynamics, with additional field data collection and
the development of specific mitigation strategies
tailored to the different LCZs in Bragança, whose
findings could be applied to other urban contexts.
ACKNOWLEDGEMENTS
This work was supported by national funds through
FCT/MCTES (PIDDAC): CIMO, UIDB/00690/2020
(DOI: 10.54499/UIDB/00690/2020) and UIDP/
00690/2020 (DOI: 10.54499/UIDP/00690/2020); and
SusTEC, LA/P/0007/2020 (DOI: 10.54499/LA/
P/0007/2020). The authors are grateful to the
Foundation for Science and Technology, I.P., projects
UIDB/04683/2020 (https://doi.org/10.54499/UIDB/
04683/2020), IDP/04683/2020 (https://doi.org/
10.54499/ UIDP/04683/2020. Cátia Rodrigues de
Almeida was financially supported by Portuguese
national funds through FCT (Grant:
PRT/BD/153518/2021).
REFERENCES
Almeida, C. R. de, Furst, L., Gonçalves, A., & Teodoro, A.
C. (2022). Remote Sensing Image-Based Analysis of
the Urban Heat Island Effect in Bragança, Portugal.
Environments - MDPI, 9(8).
https://doi.org/10.3390/environments9080098
Almeida, C. R. de, Garcia, N., Campos, J. C., Alírio, J.,
Arenas-Castro, S., Gonçalves, A., Sillero, N., &
Teodoro, A. C. (2023). Time-series analyses of land
surface temperature changes with Google Earth Engine
in a mountainous region. Heliyon, 9(8), e18846.
https://doi.org/10.1016/j.heliyon.2023.e18846
Almeida, C. R. de, Teodoro, A. C., & Gonçalves, A. (2021).
Study of the Urban Heat Island (UHI) Using Remote
Sensing Data/Techniques: A Systematic Review.
Environments, 8(10), 105. https://doi.org/10.3390/
environments8100105
Barceló, A. M., & Nunes, L. F. (2009). Iberian Climate
Atlas 1971-2000. In Atlas Clim{á}tico Ib{é}rico -
Iberian Climate Atlas.
Bragança, M. de. (n.d.). Estratégia Municipal de
Adaptação às Alterações Climáticas. Retrieved
October 1, 2024, from https://www.cm-braganca.pt/
cmbraganca2020/uploads/writer_file/document/6050/
B__8-
_Publica__o_do_Plano_Municipal_de_Ambiente.pdf
Cai, G., Liu, Y., & Du, M. (2017). Impact of the 2008
Olympic Games on urban thermal environment in
Beijing, China from satellite images. Sustainable Cities
and Society, 32, 212–225. https://doi.org/10.1016/
j.scs.2017.03.020
Coakley, J. A. (2003). Reflectance and Albedo, Surface.
Encyclopedia of Atmospheric Sciences, 1914–1923.
https://doi.org/10.1016/b0-12-227090-8/00069-5
Dai, Z., Guldmann, J. M., & Hu, Y. (2019). Thermal
impacts of greenery, water, and impervious structures
in Beijing’s Olympic area: A spatial regression
approach. Ecological Indicators, 97(July 2018), 77–88.
https://doi.org/10.1016/j.ecolind.2018.09.041
Du, H., Song, X., Jiang, H., Kan, Z., Wang, Z., & Cai, Y.
(2016). Research on the cooling island effects of water
body: A case study of Shanghai, China. Ecological
Indicators, 67, 31–38. https://doi.org/10.1016/
j.ecolind.2016.02.040
EPA - United States Environmental Protection Agency.
(n.d.). Ilhas de calor. Retrieved October 13, 2024, from
http://www.epa.gov/heat-islands
Errea, C. L., Almeida, C. R. de, Gonçalves, A., & Teodoro,
A. C. (2023). Remote Sensing Analysis of the Surface
Urban Heat Island Effect in Vitoria-Gasteiz, 1985 to
2021. Remote Sensing, 15(12), 3110. https://doi.org/
10.3390/rs15123110
French, A. N., & Inamdar, A. (2010). Land cover
characterization for hydrological modelling using
thermal infrared emissivities. International Journal of
Remote Sensing, 31
(14), 3867–3883. https://doi.org/
10.1080/01431161.2010.483491
Gonçalves, A., Ornellas, G., Ribeiro, A. C., Maia, F.,
Rocha, A., & Feliciano, M. (2018). Urban cold and
Heat Island in the City of Bragança (Portugal). Climate,
6(3), 1–14. https://doi.org/10.3390/cli6030070
Gonçalves, A., Ribeiro, A. C., Feliciano, M., & Maia, F.
(2014). Clima Urbano de la Ciudad de Bragança.
Hurni, K., Heinimann, A., & Würsch, L. (2017). Google
Earth Engine Image Pre-processing Tool : Background
and Methods. 12. https://www.cde.unibe.ch/e65013/
e542846/e707304/e707386/e707390/CDE_Pre-
processingTool-UserGuide_eng.pdf
Analysis of Surface Thermal Behavior in Different Local Climate Zones (LCZ): A Case Study in Bragança (Portugal) (2013-2024)
163

Imhoff, M. L., Zhang, P., Wolfe, R. E., & Bounoua, L.
(2010). Remote sensing of the urban heat island effect
across biomes in the continental USA. Remote Sensing
of Environment, 114(3), 504–513. https://doi.org/
10.1016/j.rse.2009.10.008
INE, I. N. de E. (n.d.). Censos 2021. Retrieved September
10, 2024, from https://censos.ine.pt/xportal/xmain?
xpgid=censos21_main&xpid=CENSOS21&xlang=pt
Mariën, B., Balzarolo, M., Dox, I., Leys, S., Lorène, M. J.,
Geron, C., Portillo‐Estrada, M., AbdElgawad, H.,
Asard, H., & Campioli, M. (2019). Detecting the onset
of autumn leaf senescence in deciduous forest trees of
the temperate zone. New Phytologist, 224(1), 166–176.
https://doi.org/10.1111/nph.15991
Menezes, G. de O. (2017). Análise do Clima Urbano da
Cidade de Bragança (2012-2016): Estudo da Ilha de
Calor [Instituto Politécnico de Bragança].
https://core.ac.uk/reader/153415740
Miles, V., & Esau, I. (2020). Surface urban heat islands in
57 cities across different climates in northern
Fennoscandia. Urban Climate, 31(December 2019),
100575. https://doi.org/10.1016/j.uclim.2019.100575
Mullerova, D., & Williams, M. (2019). Satellite Monitoring
of Thermal Performance in Smart Urban Designs.
Remote Sensing, 11(19), 2244. https://doi.org/10.3390/
rs11192244
NASA. (n.d.-a). Earth Engine Data Catalog - Landsat.
Retrieved October 10, 2024, from https://developers.
google.com/earth-engine/datasets/catalog/landsat
NASA. (n.d.-b). NASA Applied Remote Sensing Training
(ARSET) program.
Nations, U. (n.d.). The 17 Goals. Retrieved October 21,
2024, from https://sdgs.un.org/goals
Oke, T. R. (1982). The energetic basis of the urban heat
island. Quarterly Journal of the Royal Meteorological
Society, 108(455), 1–24. https://doi.org/10.1002/
qj.49710845502
Oke, T. R. (1987). Boundary Layer Climates (Routledge
(Ed.); 2nd ed.). http://library1.nida.ac.th/termpaper6/
sd/2554/19755.pdf
Oke, T. R. (1988). Street design and urban canopy layer
climate. Energy and Buildings, 11(1–3), 103–113.
https://doi.org/10.1016/0378-7788(88)90026-6
Oke, T. R., Mills, G., Christen, A., & Voogt, J. A. (2017).
Energy Balance. Cambridge University Press. https://
doi.org/https://doi.org/10.1017/9781139016476.007
ONU. (2019). World population prospects 2019. In
Department of Economic and Social Affairs. World
Population Prospects 2019. (Issue 141).
http://www.ncbi.nlm.nih.gov/pubmed/12283219
Pachêco, A. P. (2001). Sensoriamento Remoto na Faixa
espectral do Infravermelho termal ( 8 - 12 µm ). Revista
Da Comissão Brasileira de Geodésia.
https://agencia.ufpe.br/documents/39451/1778670/GE
ODE´SIA+online++·++2%252F2001.pdf/1a8b61d5-
da8c-487e-9103-485313f03aa7
Rose, G. (2019). Satellite Monitoring of Thermal
Performance in Smart Urban Designs. The Routledge
Companion to Urban Imaginaries, Figure 1, 103–112.
https://doi.org/10.4324/9781315163956-8
Saher, R., Stephen, H., & Ahmad, S. (2021). Understanding
the summertime warming in canyon and non-canyon
surfaces. Urban Climate, 38, 100916. https://doi.org/
10.1016/j.uclim.2021.100916
Stewart, I. D., & Oke, T. R. (2012). Local climate zones for
urban temperature studies. Bulletin of the American
Meteorological Society, 93(12), 1879–1900.
https://doi.org/10.1175/BAMS-D-11-00019.1
Tang, J., Di, L., Xiao, J., Lu, D., & Zhou, Y. (2017).
Impacts of land use and socioeconomic patterns on
urban heat island. International Journal of Remote
Sensing, 38(11), 3445–3465. https://doi.org/
10.1080/01431161.2017.1295485
US Geological Survey. (n.d.-a). Landsat Missions.
Retrieved October 23, 2024, from
https://www.usgs.gov/landsat-missions/landsat-9
US Geological Survey. (n.d.-b). Landsat Missions.
Retrieved September 12, 2024, from https://
www.usgs.gov/core-science-systems/nli/landsat/
landsat-8?qt-science_support_page_related_con=0#qt-
science_support_page_related_con
User manual - HTMercury33. (n.d.). Retrieved July 1,
2020, from https://www.ht-instruments.com/
en/products/mercury/download/manual/
Voogt, J. ., & Oke, T. . (2003). Thermal remote sensing of
urban climates. Remote Sensing of Environment, 86(3),
370–384. https://doi.org/10.1016/S0034-
4257(03)00079-8
Weng, Q. (2003). Fractal analysis of satellite-detected
urban heat island effect. Photogrammetric Engineering
and Remote Sensing, 69(5), 555–566. https://doi.org/
10.14358/PERS.69.5.555
Weng, Q., & Fu, P. (2014). Modeling diurnal land
temperature cycles over Los Angeles using downscaled
GOES imagery. ISPRS Journal of Photogrammetry and
Remote Sensing, 97, 78–88. https://doi.org/10.1016/
j.isprsjprs.2014.08.009
Weng, Q., Lu, D., & Schubring, J. (2004). Estimation of
land surface temperature-vegetation abundance
relationship for urban heat island studies. Remote
Sensing of Environment, 89(4), 467–483.
https://doi.org/10.1016/j.rse.2003.11.005
Yu, K., Chen, Y., Wang, D., Chen, Z., Gong, A., & Li, J.
(2019). Study of the Seasonal Effect of Building
Shadows on Urban Land Surface Temperatures Based
on Remote Sensing Data. Remote Sensing, 11(5), 497.
https://doi.org/10.3390/rs11050497
Zheng, H., Chen, Y., Pan, W., Cai, Y., & Chen, Z. (2019).
Impact of Land Use/Land Cover Changes on the
Thermal Environment in Urbanization: A Case Study
of the Natural Wetlands Distribution Area in Minjiang
River Estuary, China. Polish Journal of Environmental
Studies, 28(4), 3025–3041. https://doi.org/10.15244/
pjoes/93743
Zhou, D., Xiao, J., Bonafoni, S., Berger, C., Deilami, K.,
Zhou, Y., Frolking, S., Yao, R., Qiao, Z., & Sobrino, J.
A. (2019). Satellite remote sensing of surface urban
heat islands: Progress, challenges, and perspectives.
Remote Sensing, 11(1), 1–36. https://doi.org/
10.3390/rs11010048
GISTAM 2025 - 11th International Conference on Geographical Information Systems Theory, Applications and Management
164
