
Improving Object Detection Through Multi-Perspective LiDAR Fusion
Karl Schrab
1 a
, Felix Hilgerdenaar
2 b
, Robert Protzmann
2 c
and Ilja Radusch
1 d
1
Daimler Center for Automotive IT Innovations, Technische Universit
¨
at Berlin, Ernst-Reuter-Platz 7, Berlin, Germany
2
Smart Mobility, Fraunhofer Institute FOKUS, Kaiserin-Augusta-Allee 31, Berlin, Germany
{karl.schrab, ilja.radusch}@dcaiti.com, {felix.hilgerdenaar, robert.protzmann}@fokus.fraunhofer.de
Keywords:
Object Detection, Sensor Fusion, Edge Computing, Vehicle Simulation, Synthetic LiDAR, Eclipse MOSAIC.
Abstract:
Detection of relevant objects in the driving environment is crucial for autonomous driving. Using LiDAR scans
and image detection based on neural networks for this task is one possibility and already well researched. With
advances in the V2N communication stack, the task of object detection can be shifted towards the edge-cloud,
which would enable collaborative data collection and consideration of multiple perspectives in preparation
for the detection. In this paper, we present an initial analysis of this idea, by utilizing the Eclipse MOSAIC
co-simulation framework to develop and test the fusion of multi-perspective LiDAR frames and subsequent
object detection. We generate synthetic LiDAR data from the views of multiple vehicles for detection training
and use them to assess the robustness of our approach in regard to positioning and latency requirements. We
found that a data fusion from multiple perspectives primarily improves detection of largely or fully occluded
objects, which could help situation recognition and, therefore, decision making.
1 INTRODUCTION
Reliable detection of other objects in the driving envi-
ronment based on vehicle sensors is a critical compo-
nent for advanced driver assistance systems, as well
as autonomous driving. There is still a dispute if ob-
ject detection should rely on camera only or on 3D
point clouds generated by LiDAR based sensors. Al-
though detection in either approach works already
well, expanding local camera data with depth infor-
mation from LiDAR sensors can show significant im-
provements in detection quality. However, all these
approaches rely on local computation effort, which
requires strong hardware in the vehicles. With recent
advances in communication technologies, the shift of
these computationally expensive tasks from individ-
ual vehicles to an edge-cloud infrastructure is feasible
and could enable further possibilities. For example,
the collection of point cloud information from multi-
ple sources would allow for the aggregation of mul-
tiple views towards a more holistic understanding of
the driving environment.
Despite the potential benefits of this collaborative
sensor data collection, research in that area remains
a
https://orcid.org/0000-0002-5083-595X
b
https://orcid.org/0009-0003-8386-5113
c
https://orcid.org/0000-0002-5531-1936
d
https://orcid.org/0009-0007-9298-1588
limited. Two primary strategies can be used to im-
plement this approach. The first involves the detec-
tion results of individual vehicles and merges the lists
of detected objects. This approach mainly encoun-
ters challenges related to ambiguous matching due to
moving objects, especially in complex junction situa-
tions. The second strategy, which this paper focuses
on, entails merging point clouds from multiple vehi-
cles in a centralized spot and subsequently performing
object detection. However, the need to transmit large
volumes of LiDAR data from multiple vehicles intro-
duces latency, which can reduce the quality of object
detection due to the dynamic nature of the environ-
ment (objects may have moved by the time the data
are fused).
In this paper, we present a centralized sensor data
fusion approach which is able to improve the de-
tectability of largely or fully occluded objects in the
driving environment. Unlike previous studies that fo-
cus primarily on improving detection methods, our
work emphasizes the effectiveness of adopting a col-
laborative approach using point cloud data from mul-
tiple vehicles. This novel perspective is supported
by our experimental results, which indicate that our
method is able to enhance situational awareness and
decision-making capabilities in complex driving en-
vironments. To achieve that, we present an inte-
grated development and testing framework based on
448
Schrab, K., Hilgerdenaar, F., Protzmann, R. and Radusch, I.
Improving Object Detection Through Multi-Perspective LiDAR Fusion.
DOI: 10.5220/0013283600003941
Paper published under CC license (CC BY-NC-ND 4.0)
In Proceedings of the 11th International Conference on Vehicle Technology and Intelligent Transport Systems (VEHITS 2025), pages 448-457
ISBN: 978-989-758-745-0; ISSN: 2184-495X
Proceedings Copyright © 2025 by SCITEPRESS – Science and Technology Publications, Lda.

Eclipse MOSAIC, facilitating the simulation of var-
ious traffic scenarios and sensor interactions for the
evaluation, as well as for the generation of synthetic
data used for the training step.
The paper is structured as follows. First, we re-
view related work in the field of object detection and
sensor fusion in the next Section 2. This is followed
by Section 3 with a detailed description of our multi-
perspective object detection approach, including the
methodology for point cloud fusion and detection. In
Section 4 we then present our simulation methodol-
ogy which serves as a synthetic data generator as well
as the platform for our experiments, which are shown
in Section 5 subsequently. In Section 6, we discuss
our findings and, finally, we draw our conclusions and
give a future look at the ongoing work in Section 7.
2 RELATED WORK
Autonomous driving requires the detection of other
road users. This object detection is mainly based on
sensor fusion of cameras, radar, and light detection
and ranging (LiDAR) (Charles et al., 2017). Monocu-
lar camera-based object detection relies on 2D images
and can be implemented by well-established neural
network-based detection, such as ResNet-based de-
tectors (He et al., 2016). In contrast to that, depth
information is required for accurate 3D object detec-
tion (Charles et al., 2017). This depth information can
be acquired by stereo-vision or in general by multi-
view camera images. Overlapping multi-view cam-
era images allow depth information to be derived, and
LiDAR provides measuring distances very accurately
because it measures the time of flight (TOF) of the
light (Royo and Ballesta-Garcia, 2019). In combi-
nation with a scan, the result is a point cloud of the
environment in three-dimensional space. Therefore,
the fusion of sensor data with these point clouds en-
ables the 3D object detection. This detection is usu-
ally implemented with deep neural networks operat-
ing on projections of the point cloud, directly on a
set of points, or on a voxel grid for data reduction
(Wu et al., 2021). The projection methods involve
the generation of 2D images and therefore rely on 2D
image recognition. Our approach realizes a bird eye
view as input to an image recognition network for ob-
ject detection. Single-Shot Detectors (SSD) provide
sufficient speed and detection accuracy, whereas De-
formable DETR (Zhu et al., 2021) performs state-of-
the-art detection (Zou et al., 2023).
(Fang and Li, 2024) takes the sensor fusion a step
further by considering the measurements of nearby
vehicles relative to the ego vehicle. That work fol-
lows a cooperative approach using vehicle-to-vehicle
(V2V) communication to exchange point clouds from
multiple view points, which will be fused together
by an ICP-based merge process. This results in an
augmented environment scan and relative pose esti-
mation, which is also known as simultaneous local-
ization and mapping (SLAM). (Fang and Li, 2024)
performs feature extraction on each point cloud indi-
vidually for object detection, whereas our approach
fuses multiple point clouds before feature extraction
and object detection.
These architectures result in detector models after
a training process. This training relies on labeled in-
put data, in our case point clouds. The KITTI dataset
(Geiger et al., 2013) is one of the first publicly avail-
able datasets widely used in the field of computer vi-
sion and autonomous driving research. It consists of
data collected using a sensor suite mounted on a ve-
hicle, KITTI includes stereo grayscale and color im-
ages, 3D point clouds from LiDAR, and GPS/IMU
data, offering a comprehensive and realistic dataset
for algorithm development and evaluation. As stated
in (Geiger et al., 2013), a classification of the visi-
bility of other road users by the ego-vehicle is made.
These four occlusion states, from fully visible to fully
occluded, are used in our work. In addition to that,
there are many other data sets like nuScenes (Caesar
et al., 2020) or Waymo (Sun et al., 2020). However,
all these data sets contain only data from the view-
point of a single vehicle. For merging point clouds
from vehicles within a certain range with multiple
views, the available data sets are not sufficient. There-
fore, we used simulations to generate synthetic Li-
DAR data from the point of view of multiple vehicles,
similar to the work done in (Strunz et al., 2024).
3 MULTI-PERSPECTIVE
OBJECT DETECTION
The detection is implemented by a fusion of point
clouds from different perspectives with a subsequent
detection. Vehicles send point clouds of local LiDAR
scans via a cellular network, merged by our fusion
service, and augmented by an object detector. The
detector uses a well-established architecture and is
trained with synthetically generated data from sim-
ulations. In this section, we present the point cloud
fusion and detection implementation, as well as the
challenges for these services.
Improving Object Detection Through Multi-Perspective LiDAR Fusion
449
Box predictions for
veh_0
Fusion
Point
Cloud
Storage
Connector
Pointcloud of
veh_n
Pointcloud of
veh_0
Queue
Fusion
Garbage
Collector
Trigger
Detection
Grid Generator
Merged Point Cloud
for veh_0
Neural Network
(Tensorflow)
Feature Extractor
(Inception V2)
Detector
(SSD)
…
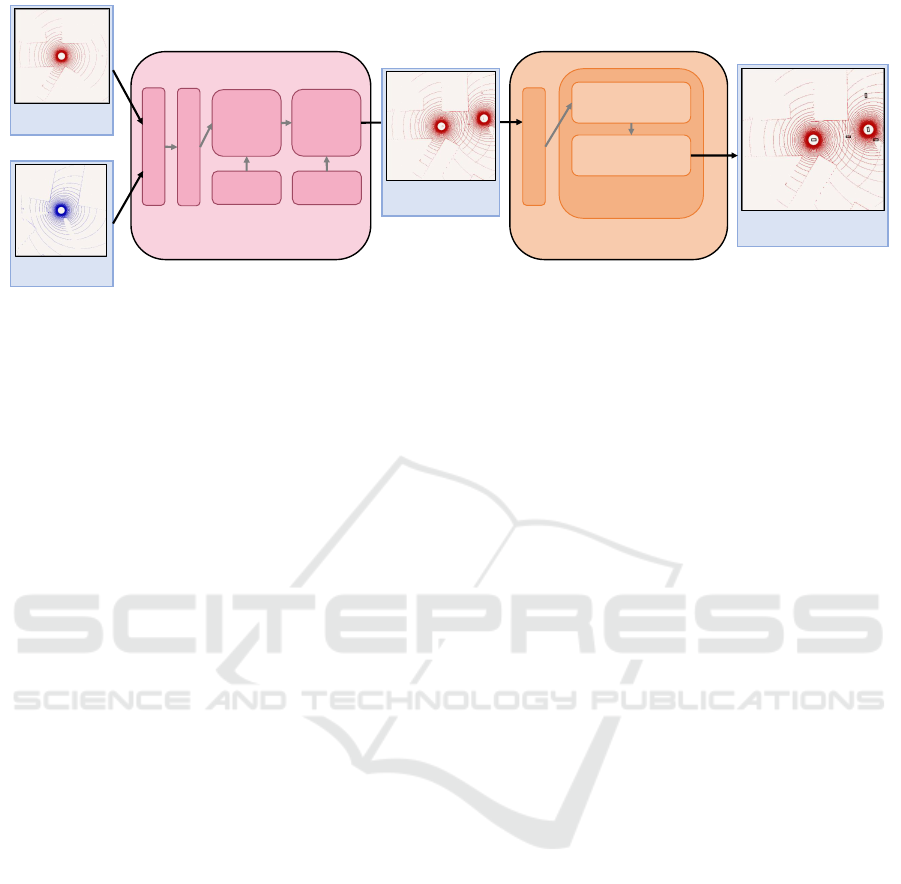
Figure 1: Detection Pipeline. LiDAR scans of individual vehicles are transmitted to the fusion services, queued and merged
together. An augmented scan is passed to the detection service, which transforms the point cloud into a three-layered grid,
which is afterwards processed by a neural network performing the detection based on InceptionV2 and an SSD. The fusion
and detection are done for each vehicle which participates in the data collection.
3.1 Object Detection in Fused Point
Clouds
The process of merging multiple point clouds in-
volves combining LiDAR scans captured from differ-
ent perspectives (vehicles) to create a comprehensive
and accurate 3D representation of an environment.
Our implementation of this fusion and detection sys-
tem is shown in Figure 1. The connector handles the
input connection and queues each point cloud in or-
der of arrival. These point clouds are processed and
merged into a point cloud storage according to time-
dependent constraints. A garbage collector ensures
that point cloud storage remains minimal by remov-
ing outdated data. The trigger initiates the generation
of cut-outs of regions of interest which are sent to the
next stage, the detector.
The fusion is a union of at least two point clouds,
called global point cloud. The relative position of the
point clouds is derived by the GNSS and the odome-
try system of each sending vehicle. Hence, each point
cloud is tagged with its creation position and rotation
with respect to a global reference, which is the ba-
sis for the correct fusion of the points. However, the
entire detection challenge is time-dependent. Each
point cloud is sent via a cellular network, which de-
lays the reception at the fusion service slightly, lead-
ing to an improper environment representation with
effects like double edges of moving objects. To mini-
mize the occurrence of blurred point clouds, it is cru-
cial to perform the merging within a constrained time
frame. Each point cloud is tagged with a creation
timestamp, which is used to determine whether the
point cloud is located in a merge window. By con-
sidering only the creation times, the algorithm en-
sures that point clouds recorded within a close tem-
poral proximity are merged, whereas those with sig-
nificant delays are excluded. In addition to that, only
the newest point cloud of each participating vehicle
is considered, which leads to further reduction of blur
while preserving the augmentation by multiple views.
Having a region around a vehicle cut out of the global
point cloud, an augmented point cloud is generated
which will be fed into out detection service.
The detection is implemented in two steps as
shown in Figure 1. First, the point cloud is projected
onto a two-dimensional grid in a bird eye view (BEV).
According to a typical radial LiDAR range of 100 m,
we use a grid with an edge length of 150 m with the
sensing vehicle in the center of the grid. All points
within a grid cell are reduced to three values: the max-
imum height, the minimum height, and the maximum
of the reflectance of all points. Hereby, the reflectance
is the ratio between the reflected light power and the
incident light power in the case of a LiDAR scan. This
reflectance mainly depends on the surface material.
Secondly, this BEV grid is used as input of a neural
network which generates bounding boxes of detected
objects. The grid format is similar to an RGB image
with three channels. Thus, common image recogni-
tion using neural network architectures can be used,
which we have done as second step. The network
consists of a feature extraction part defined by (Ioffe
and Szegedy, 2015) and called InceptionV2. Detec-
tion on the features is performed by a single-shot de-
tector (SSD) (Liu et al., 2016). This SSD uses anchor
boxes as reference points for detection and generates
multiple two-dimensional detection boxes. In recent
work, newer object detection approaches have been
developed, yet the architecture used based on Incep-
tionV2 and SSD is considered well established in the
area of image recognition.
VEHITS 2025 - 11th International Conference on Vehicle Technology and Intelligent Transport Systems
450
3.2 Detection Training
The network architecture described before has to be
trained with a sufficiently labeled data set to produce
the detector model, ready for inference. We faced
the challenge that the available datasets contain only
point clouds from the point of view of a single vehi-
cle. Therefore, more extensive data are required with
multiple vehicles with overlapping scan areas. To pro-
duce these scans, we implemented simulations depict-
ing various traffic situations (see Section 4). The gen-
erated point clouds from the simulations are shuffled
and split into 70 % for training and 30 % for valida-
tion. In addition, a dedicated scenario is left out for
later testing and evaluation, as described in Section 5.
As loss function, the L
1
norm is used and
optimized by the RMSProp implementation of
TensorFlow (Abadi et al., 2015), which is a gradient-
free optimization algorithm with an adaptive learning
rate. The training process used batches of size 1 and
was aborted after a specific number of training itera-
tions.
3.3 Fusion Challenges
Blurred point clouds due to fusion lead to a lower de-
tection quality. To reduce this issue, an extended se-
lection of point clouds according to their timestamp is
important. Assume two vehicles sending point clouds
as an example scenario as shown in Figure 2. Here,
each point cloud is received at the fusion service after
its transmission delay, leading to three different cases:
1. The delay is less than the length of the merge win-
dow and the point cloud is the newest point cloud
received from a single vehicle.
2. The delay is less than the length of the merge win-
dow and the point cloud is not the newest point
cloud received from a single vehicle.
3. The delay is greater than the length of the merge
window.
The cases 2 and 3 lead to a discard of the point cloud
because of an updated or outdated information. Only
the case 1 accepts a point cloud for the fusion process.
Explicit research by our simulation evaluation is later
discussed in Section 5.3.
An additional challenge is a deviation of the point
cloud position from the true position, specifically the
positioning error of the vehicle GNSS and odometry
system. This again leads to blurred point clouds be-
cause of the merge with a shifted reference. The ef-
fects of this positioning error are discussed and sup-
ported by the experimental results in Section 5.2.
veh_0
veh_1
PCPC
Aggregation Interval
PC
Fusion Service
PC
time
outdated replaced
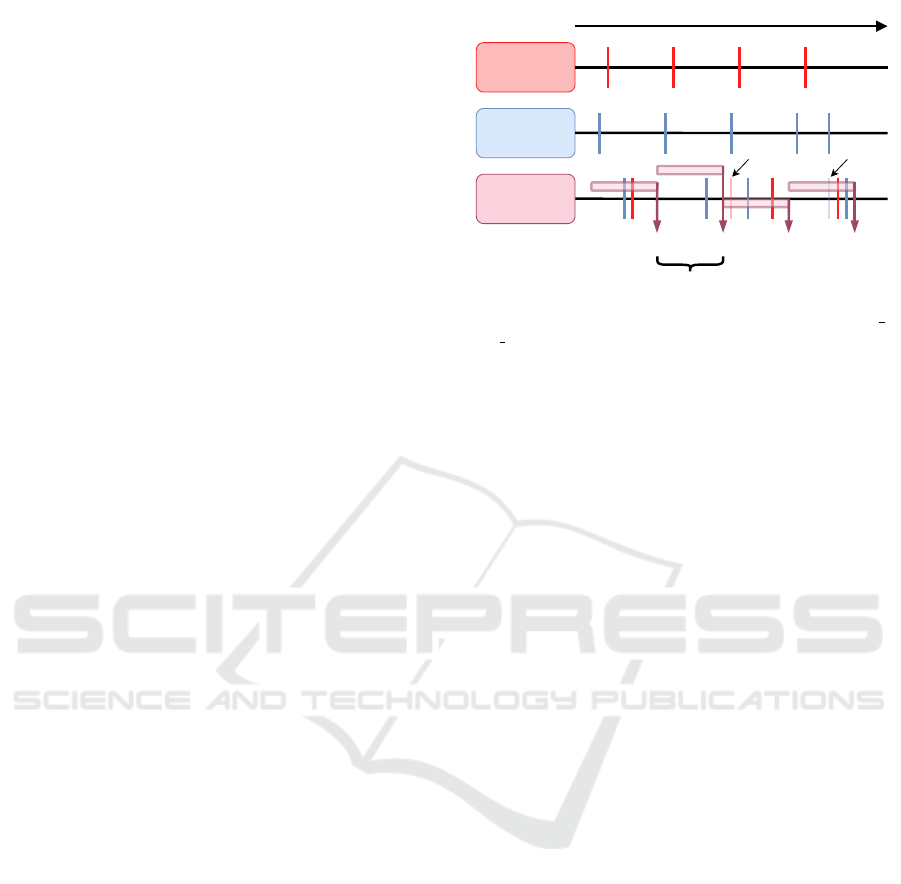
Figure 2: Point cloud transmission of two vehicles (veh 0,
veh 1) with respect to time. Each point cloud sending event
is rendered as a perpendicular line. The reception of each
point cloud is displayed at the fusion service row using the
vehicle’s color. The fused output is marked as a maroon-
colored arrow pointing downwards, whereas the time range
of considered point cloud for the merge process is marked as
a maroon horizontal bar at the corresponding output arrow.
4 SIMULATION
METHODOLOGY
The open-source co-simulation framework
Eclipse MOSAIC (Schrab et al., 2023) is a suit-
able tool to model a system that includes vehicle
movements, sensor data generation, application inter-
actions, and communication links. With MOSAIC,
simulators from different domains such as applica-
tion, traffic, vehicle dynamics, and communication
can be coupled toward a holistic system simulation.
For example, the traffic domain is usually modeled
using the Eclipse SUMO simulator. For commu-
nication, various simulators can be used, such as
OMNeT++ or ns-3, or integrated simulators SNS or
Cell for rather heuristic modeling. In the commercial
version, MOSAIC comes with the vehicle simulator
PHABMACS, which includes physically accurate
modeling of vehicle dynamics, a procedural gener-
ated 3D environment, and high resolution sensor data
such as LiDAR point clouds. Due to its flexibility, it
is also possible to bundle further simulators by im-
plementing an HLA-inspired interface. For example,
we also tested coupling the vehicle simulator Carla
for sensor data generation.
In this work, we use Eclipse MOSAIC to develop
and test the proposed algorithms in an integrated man-
ner. We use the vehicle simulator PHABMACS to
collect synthetic LiDAR sensor data for individual ve-
hicles, which are fed into the sensor fusion and object
detection. The MOSAIC application simulator serial-
izes the point cloud data of equipped vehicles using
Improving Object Detection Through Multi-Perspective LiDAR Fusion
451
Application
Simulator
ECLIPSE MOSAIC RTI
Virtual
Real
Analytics / Processing Cluster
Broker
Point Clouds
Merged
Point Clouds
Detections
Sensor
Fusion
Object
Detection
Vehicle
Simulator
Traffic
Simulator
Cell
Simulator
Transmission
Handover
Delay
Core
Client
App
Client
App
Client
App
Server
Proxy
Surrounding
City Traffic
LiDAR
Vehicle
Dynamics
Point
Cloud
Pose
Objects
Vehicle Control
GPS
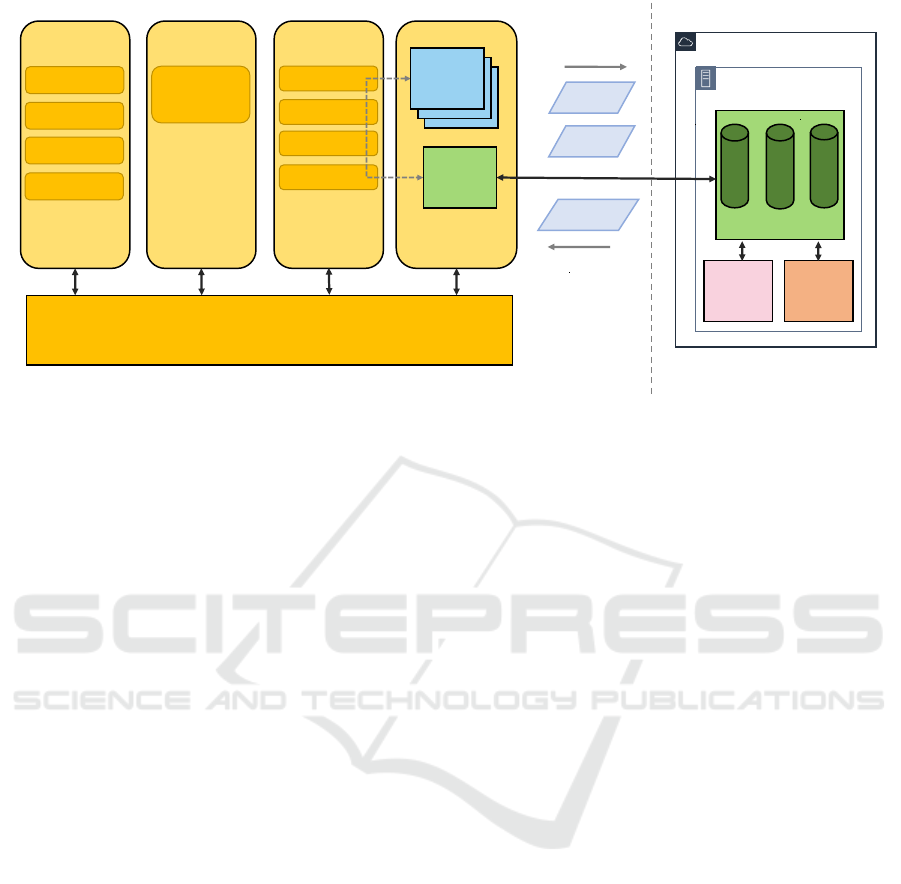
Figure 3: Integrated setup of simulation and fusion and detection services. The left part, marked as virtual, is our simulation
environment based on Eclipse MOSAIC, the right part (real) contains the message broker, fusion and detection services and
is designed to run in an edge-cloud. The virtual part may be exchanged by real vehicles connected via a cell network.
Protobuf for a memory efficient format. For the de-
velopment and training of the fusion and detection
services, we use this setup to generate point cloud
and ground truth data. Here, the ground truth con-
sists of all existing objects in the simulation for each
time step, which serves as labels for the training pro-
cess, as well as basis for calculating metrics for the
evaluation of conducted experiments.
We furthermore extended this setup by integrat-
ing the fusion and detection into the simulation sys-
tem. All required data generated by the simulation
(e.g., point clouds from LiDAR scans) are fed into a
MQTT-based message broker. The fusion and detec-
tion algorithms are wrapped into separate microser-
vices and receive incoming sensor data via the mes-
sage broker for processing. We intentionally designed
this as a microservice pattern to make real deployment
in the (edge) cloud easier. Figure 3 shows the setup
that we used for our integrated development and test-
ing approach.
4.1 Sensor Modeling
For the creation of synthetic sensor data, we use the
PHABMACS vehicle simulator. PHABMACS main
focus is on rapid prototyping advanced driver as-
sistance systems (ADAS) with the help of realistic
models for vehicle dynamics and sensor data gen-
eration, and a scenario description language in the
form of a domain-specific language (DSL), called
ScenarioSE (Massow and Radusch, 2018).
PHABMACS generates its 3D environment in a
procedural way based on OpenStreetMap data. This
includes roads, buildings, and trees. However, in
contrast to hand-crafted environments as provided in
Carla, no further road furniture is generated, such as
curbs, lamp posts, poles, bushes, and benches. For
vehicles, detailed 3D assets that resemble real vehi-
cle chassis are used. For this work, which focuses
on the detection of vehicles on the road, this level
of 3D modeling is sufficient. The main advantage of
the procedural nature is therefore, that varying simu-
lation scenarios can be generated very easily and no
exhausting manual work on modeling the 3D environ-
ment is required.
The integrated LiDAR model is fully configurable
in its field of view, resolution, range, sampling rate,
and location on the vehicle. Each vehicle can also be
equipped with several individual scanners. For our
tests, we configured one central LiDAR scanner po-
sitioned on the top of the vehicle with a 360
◦
field
of view. The scanner samples the 3D environment
with a rate of 10 Hz and is configured with a hori-
zontal resolution of 0.1
◦
, scanning a full circle, and
vertical resolution of 0.427
◦
using 64 sampling rows,
resulting in a total resolution of 230,400 points per
scan. During the scan, all objects within the 3D en-
vironment are considered, including vehicles, build-
ings, and trees. Laser beams cannot pass through ob-
jects (or windows) and are neither multiply scattered
nor multiply reflected by any material, thus creating
no reflection artifacts. Due to the event-based archi-
tecture of the simulator, for each complete scan the
simulation is ”frozen”, that is, no potential artifacts
by movements of the vehicle during a scan are con-
sidered. For a fast and efficient calculation of the
VEHITS 2025 - 11th International Conference on Vehicle Technology and Intelligent Transport Systems
452
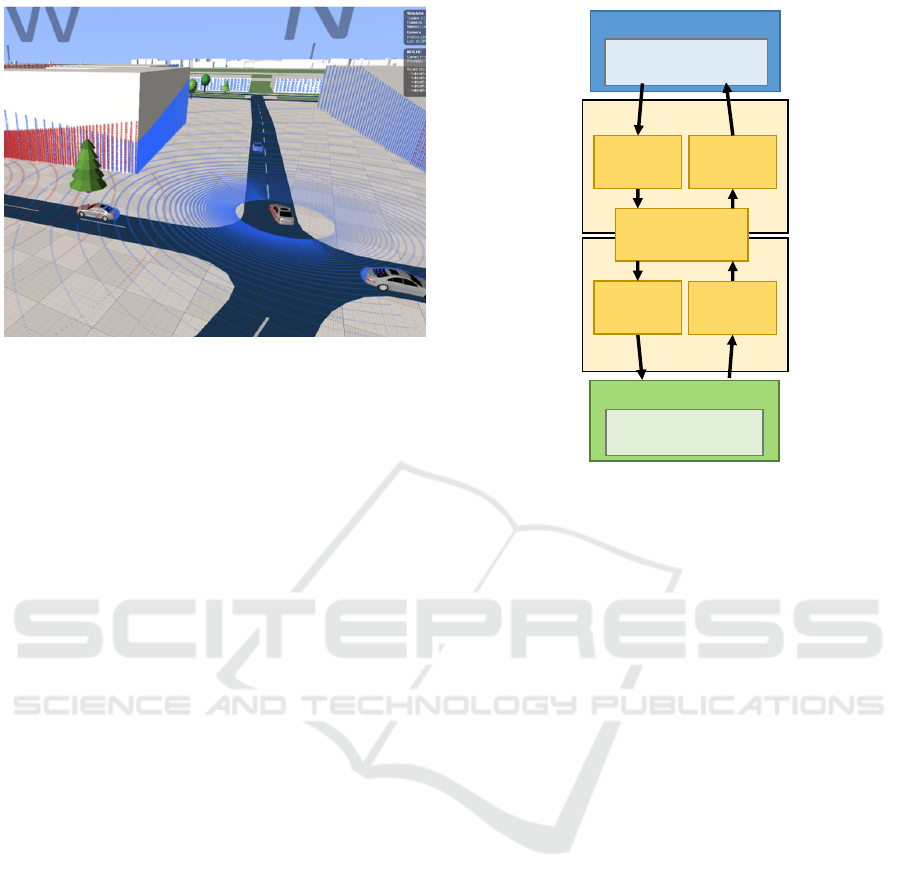
Figure 4: Example screenshot of the LiDAR sensor model
in the PHABMACS simulator, with two vehicles scanning
the environment.
scanning process, PHABMACS uses the PhysX en-
gine to find potential environment objects in the path
of each laser ray using simple box geometries, and
refines each hit by calculating the actual hit with the
detailed geometry. Figure 4 shows an example point
cloud obtained through the PHABMACS simulator.
PHABMACS also comes with a GNSS sensor
model that includes atmospheric error, shadowing er-
ror, noise, and delay. This allows us to retrieve po-
sitions of the vehicles that may differ from the true
positions in the 3D space. We used this error model
to find its effects on collaborative object detection in
one of our experiments (see Section 5). For all other
experiments, we assumed perfect absolute positions
for all vehicles.
4.2 Network Modeling
Communication between vehicles and (edge) cloud
services utilizes cellular-based communication
(V2N). For this work, a simplification of the commu-
nication stack is sufficient, and a detailed simulation
of PHY, MAC, and modeling other parts of the
stack is not required for our experiments. We use
the MOSAIC Cell simulator here, but thanks to
the flexibility of MOSAIC, it would be possible to
exchange it with a more detailed network simulator,
such as ns-3 or OMNeT++.
The radio access and the core network part can
be configured separately in the MOSAIC Cell sim-
ulator. This allows us to have different properties
for both parts of the network, including delay, packet
loss, and capacity. Figure 5 briefly shows the com-
ponents of the communication stack modeled by the
simulator (Protzmann et al., 2017). For the core net-
work, we assumed that there were no packet losses,
RAN
CORE
Vehicle
Vehicle Application
(e.g. LidarTransmission)
Uplink
(Delay, Loss,
Capacity)
Downlink
(Delay, Loss,
Capacity)
Addressing
Routing
DC
Server Application
(Fusion/Object Detection)
Uplink
(Delay, Loss,
Capacity)
Downlink
(Delay, Loss,
Capacity)
Figure 5: The communication between vehicles and the
edge-server is modeled using different delay and packet-
loss configurations for the radio access and core part of the
network, by utilizing the MOSAIC Cell simulator.
unlimited capacity, and a short constant delay of one
millisecond. This delay includes transport through all
components within the core network. For the radio
access, we assumed network properties typical for 5G
networks. On average, the point cloud data measures
3 MB to 4 MB in size for each frame in our config-
uration. Assuming a throughput of 400 Mbit/s (e.g.,
(Xu et al., 2020) measured an available throughput
of 800 Mbit/s), this would result in a total transmis-
sion duration of 8 ms per frame plus end-to-end de-
lays in the radio access and core network. There-
fore, depending on the experiments we conducted, we
assumed different total transmission delays ranging
from 10 to 30 ms (see Section 5.3).
4.3 Simulation Scenarios
For testing and training the fusion/detection services,
we implemented various simulation scenarios with a
variety of different traffic situations. All of those
scenarios were implemented in the Urban Tech Re-
public area, a future living and research campus lo-
cated on the site of former Tegel airport in Berlin.
The model area was created by hand using Open-
StreetMap to place roads, buildings, and trees that
match the blueprints for the future campus. Figure 6
shows an overview of the generated map.
Based on this, we implemented 16 different sim-
ulation scenarios with all different definitions of ve-
Improving Object Detection Through Multi-Perspective LiDAR Fusion
453
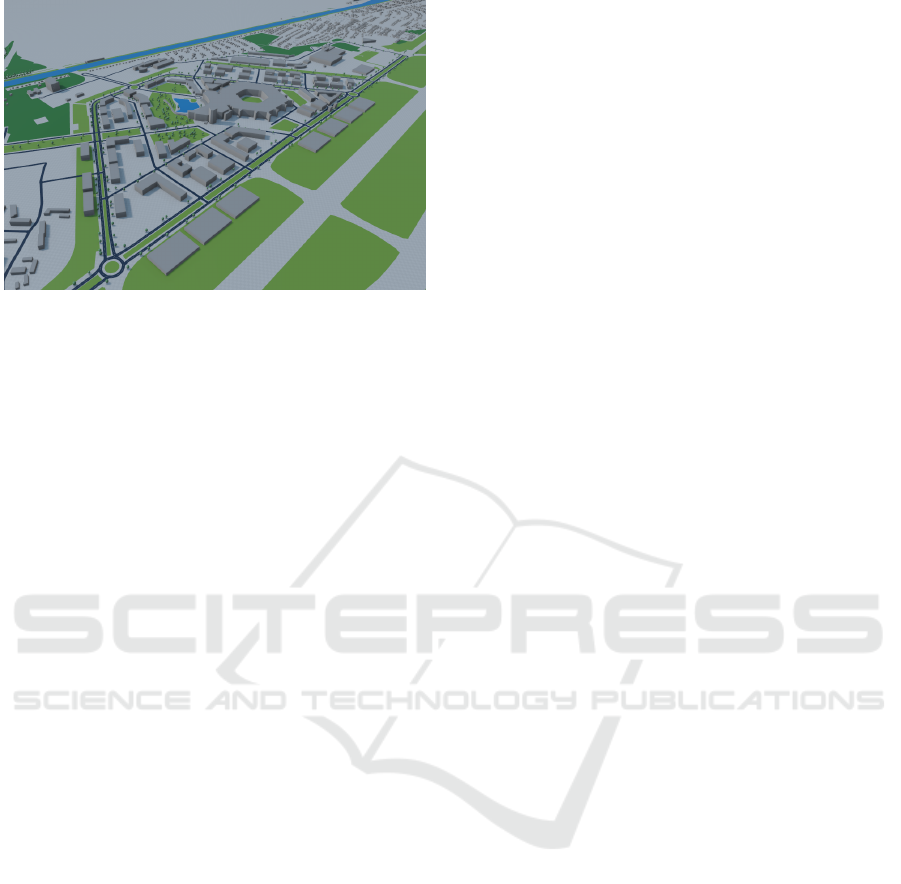
Figure 6: An aerial view of the simulation environment
which was used to generate synthetic LiDAR data for train-
ing as well as for the evaluation.
hicular traffic. In each scenario, one or more vehicles
have been configured with LiDAR scanners to gen-
erate synthetic point cloud frames. The selection of
these vehicles was chosen so that the equipped vehi-
cles are driving close to each other or meet each other
during simulation. Especially for training the detec-
tor on fused data, it was important that there is a rough
equilibrium of frames with single vehicle sources, and
with multiple vehicle sources in the same area. In to-
tal, we generated 41,687 different LiDAR frames to
be used partially for training and evaluation.
5 EXPERIMENTS & RESULTS
For an evaluation of the multi-perspective based de-
tection we compare box predictions gathered from
merged and unmerged point clouds with the ground
truth from the simulation. Here we apply proven met-
rics such as precision and recall for measuring detec-
tion quality, whereas we think that a high recall is
more important. We calculate the recall as the ratio
of actual detections compared to all existing objects
within the vehicle range (the assigned grid). Further-
more, only detections with an Intersection over Union
(IoU) value greater than 0.5 are considered. This has
the effect that position inaccuracies already negatively
affect recall.
We use this metric to measure the effects of trans-
mission delay and positioning inaccuracies on detec-
tion quality. For the experiments carried out here, we
used two versions of a Testdata scenario consisting of
two and three vehicles equipped with a LiDAR scan-
ner. In total, this simulation scenario generates 2858
LiDAR frames from two equipped vehicles, or 4287
from three equipped vehicles. The paths of the vehi-
cles were chosen in a way that they follow or meet
each other several times during the simulation.
Before diving into the evaluation, we explain the
concept of Occlusion States inspired by the KITTI
Object Detection Challenge (Geiger et al., 2012). We
differ between four classes of occlusion for objects
(vehicles), which are in range of the equipped vehi-
cle, but might not be fully visible due to occlusion by
other objects.
• Fully Visible: The object is fully visible, no oc-
clusion at all.
• Partly Occluded: The object is partially visible,
but should still be detectable by a start-of-the-art
detection.
• Largely Occluded: The object is almost fully oc-
cluded and would be hard to detect.
• Fully Occluded/Unknown: The object is fully oc-
cluded and not visible, or there is no information
available about occlusion.
We classified all labeled objects in the ground truth
accordingly. For that we calculated a number of ex-
pected hits if no occlusion would occur and assigned
an occlusion state according to the ratio of the actual
number of hits. With a ratio of ≥ 60 %, an object is
classified as fully visible, with ≥ 20% it is partially
occluded, and with > 0 % it is largely occluded. Ev-
erything else is classified as fully occluded or not vis-
ible. Improvements due to point cloud fusion depend
mainly on the occlusion states. Detection for objects,
which are already detectable by using the local point
cloud, can not be improved by our fusion approach.
The main goal is that largely or fully occluded objects
become visible. Therefore, a classification of results
based on these occlusion states makes sense to bet-
ter understand the operational range of the proposed
algorithms.
5.1 Point Cloud Fusion
First, we look at the main improvements that a fusion
of multiple views has on object detection. For this ini-
tial evaluation, we assume perfect conditions in terms
of positioning and sensor data transmission. In order
to measure the improvement, we calculate the average
over all recall values from the interference of each
LiDAR frame. By calculating the recall in relation
to the occlusion state, we can measure whether more
vehicles are detected when using the fusion approach.
For the case No Fusion, we use the raw frames
produced by every equipped vehicle and calculate the
recall of our detection. For the Fusion case, for each
equipped vehicle, we merge the point cloud(s) of the
other equipped vehicle(s) in range, if existing. For
each merged frame, we run the interference and use
VEHITS 2025 - 11th International Conference on Vehicle Technology and Intelligent Transport Systems
454
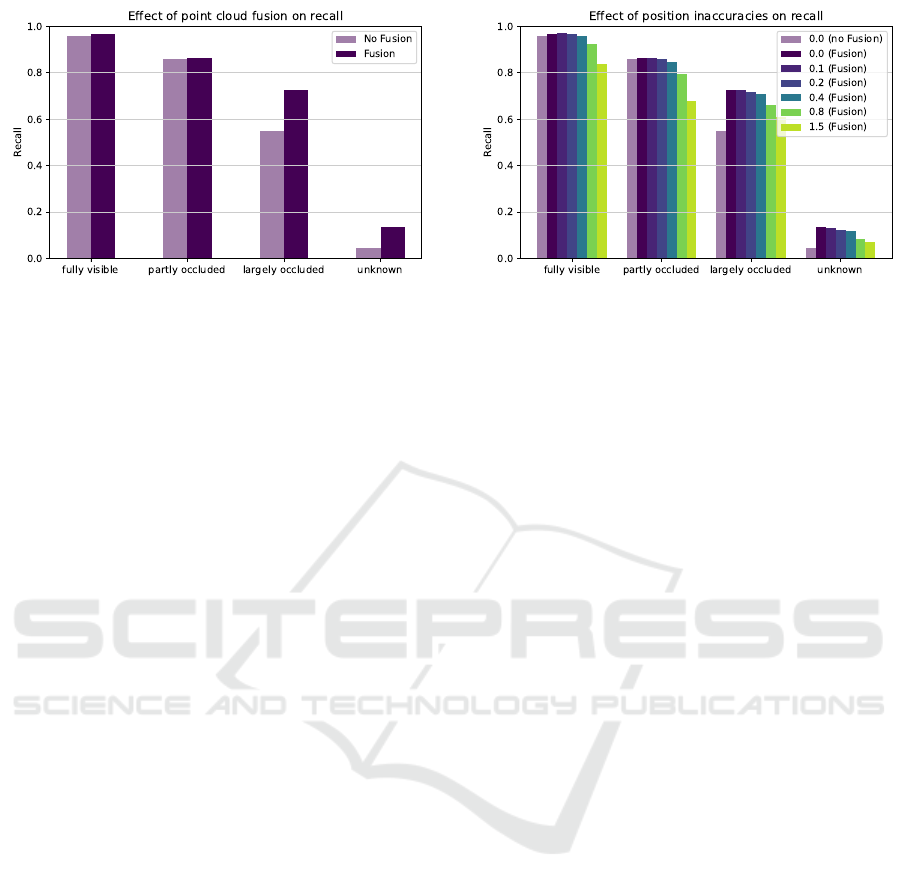
Figure 7: The recall - the ratio of detections compared to
existing objects - increases significantly for largely and fully
occluded objects when fusion is enabled.
the resulting recall value. Here, we calculate the recall
value for each occlusion state separately.
Figure 7 shows the effects of fusion on the aver-
age recall of our object detection. As expected, fu-
sion does not improve already well visible objects.
The main improvement can be seen in detection of
largely occluded objects. Here, the number of detec-
tions significantly increases to almost the same level
as for partly occluded objects. Furthermore, a signifi-
cant amount of previously almost invisible objects can
be detected using the fusion approach.
5.2 Positioning Errors
In a perfect environment without transmission de-
lays or positioning inaccuracies, the fusion approach
works well. Yet, in reality, vehicles cannot measure
their absolute position perfectly. Even with the best
positioning technology, a certain deviation compared
to the real position of the vehicle must be assumed.
Therefore, we test the robustness of our approach in
the context of localization inaccuracies. We used the
GNSS sensor module implemented in PHABMACS
(see Section 4) to include error models for atmo-
spheric error and shadowing, resulting in positioning
inaccuracies in the range of 0 to 1.5 m around the
original position, depending on the parameterization
of the error model. We assumed only deviations in
the position and not in the orientation of the vehicles.
During the merging of frames of two or more vehicles
within range, no additional algorithms are applied to
improve the alignment of shifted frames.
Figure 8 displays the average recall of the interfer-
ence based on the new erroneous input frames. De-
pending on the strength of the positioning error, the
recall drops accordingly. Up to a deviation of 0.8 m
to the original position, the fusion still works well.
Above this value, the fusion still shows improvements
Figure 8: The recall declines with larger positioning inac-
curacies. Still, detection benefits from the fusion if the de-
viation to the true position does not exceed 0.8 m.
for largely occluded or invisible objects, but disturbs
detection of closer objects.
5.3 Transmission Delays
In addition to positioning, a major problem in that
system is caused by communication between the ve-
hicles and the cloud instance that provides the fu-
sion and detection services. Vehicles move until point
cloud data are fully transmitted; therefore, transmis-
sion delays affect the merging process as well as de-
tection. To test the effects, we configured our commu-
nication model to produce different delays for sending
a full LiDAR scan to the fusion and detection server,
ranging from 10 to 30 ms.
Evaluating the effects of transmission delay on the
recall can be tricky, especially choosing the correct
labeled object and its ground truth position when cal-
culating the recall. For a fair comparison, we choose
to calculate the recall using ground truth positions of
the detected objects at the time the interference is ex-
ecuted. With that in mind, we expect that even in-
terference on unmerged point clouds results in worse
recall with larger delays, since ground-truth objects
have been moved since the original LiDAR scan was
recorded. Therefore, we calculate the recall for dif-
ferent expected delays for both cases No Fusion and
Fusion to compare them with each other.
By looking at Figure 9 it is apparent that short
transmission delays of up to 10 ms still lead to ap-
propriate detection and high recall. As expected,
with larger delays the recall decreases due to vehicles,
which moved during the time the scan was recorded
until the time of interference. Nevertheless, a fusion
of the point cloud data always results in better re-
call values than no fusion, except for fully visible ob-
jects. We therefore conclude, that the interference on
merged sensor data works well, as long the transmis-
Improving Object Detection Through Multi-Perspective LiDAR Fusion
455
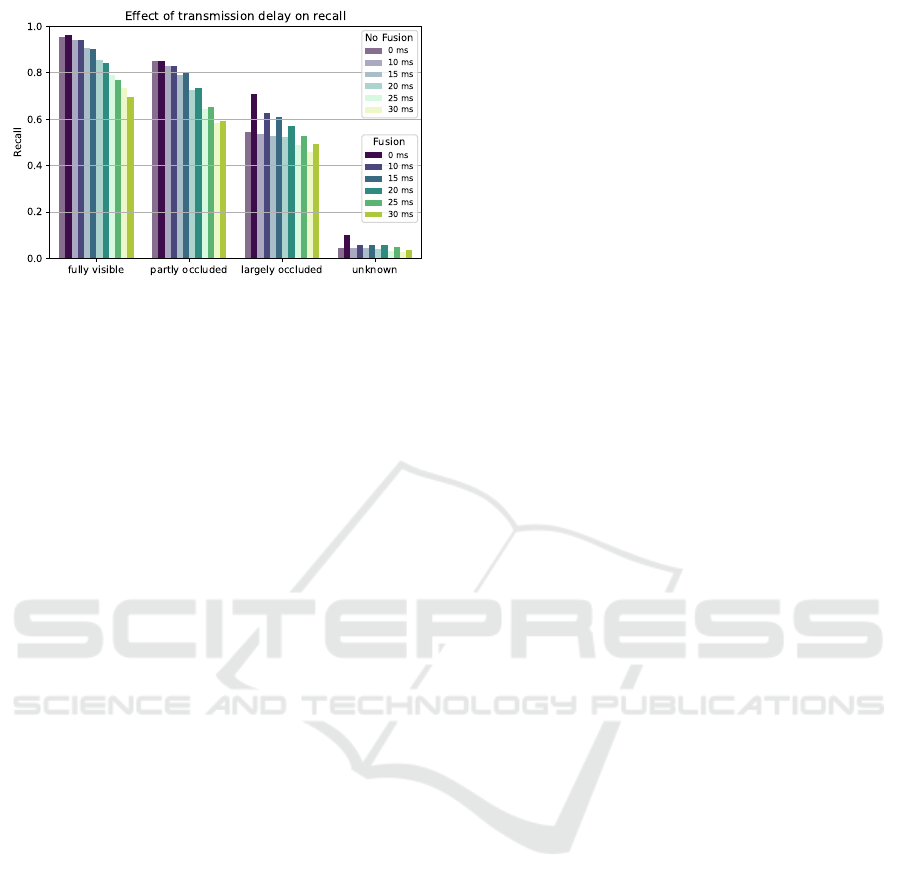
Figure 9: Recall is also negatively affected by transmission
delays, but relatively stable with in the range of 10 ms to
15 ms. The recall also declines in the non-fusion cases,
since ground truth vehicles move until detection takes place.
sion delays do not exceed 15 ms.
6 DISCUSSION
Our experiments showed that our approach can im-
prove the detectability of objects within certain
boundaries. In this initial work, we used syntheti-
cally generated LiDAR data from simulations, as our
approach requires sensor data from multiple perspec-
tives (existing data, such as KITTI, provide only sen-
sor data from the perspective of one vehicle). When
generating point clouds, we made various simplifica-
tions, such as neglecting reflectivity issues or weather
conditions, and adopt a rather basic 3D environment.
Therefore, our approach should also be tested with
real LiDAR data, e.g., by collecting sensor data from
test drives involving multiple vehicles.
The beneficial range of our approach is clearly
at largely occluded or invisible objects. For the de-
tection of objects that are already well visible, there
are limited enhancements. In order to improve de-
tectability of largely occluded objects, good localiza-
tion techniques are required since the approach itself
does not include point cloud matching. State-of-the-
art approaches could ensure the accuracy of the ab-
solute position within a range of 0.8 m of deviation
to the original position of the equipped vehicles. For
example, by applying localization techniques to raw
GNSS sensor data, such as point cloud alignment with
pole-like features (Li et al., 2022), the required local-
ization accuracy could be reached.
With transmission delays of up to 10 or 15 ms our
approach still works well; above that, deviations of
detections to the real object positions might become
too large. These transmission delays are mainly de-
pendent on the size of the point cloud data. Therefore,
enough throughput of the physical medium as well as
connection to the (edge) data center is required. We
found that a throughput of 400 Mbit/s would be re-
quired for one V2N connection to meet the delay re-
quirements. With the current and future 5G communi-
cation stack and an efficient edge-cloud architecture,
these requirements are achievable from our perspec-
tive. We also believe that this approach would work
within an ITS-G5 environment, by sending the point
cloud data to designated roadside units with enough
computing power. In that case, a roadside unit would
apply the fusion and detection only for a fixed area in
which it is located, e.g., a junction.
7 CONCLUSION & OUTLOOK
In this paper, we presented a novel approach for en-
hancing object detection by merging LiDAR point
clouds from multiple vehicles. The proposed method
involves the centralized fusion of point clouds from
multiple perspectives, allowing for a holistic under-
standing of the driving environment. We separated
the approach into two steps, fusion and detection. In
the fusion process, we applied time-aware selection
techniques to deal with latencies introduced by the
transmission of large LiDAR data packets. For de-
tection, we applied proven methods for image recog-
nition which work on RGB images generated by pro-
jecting the merged point cloud data on grid cells. Our
simulation-based experiments showed that the pro-
posed centralized fusion approach works well within
limits in terms of transmission delays and localization
accuracy. Our approach improves the detectability of
largely occluded or invisible objects.
However, we recognize that further advancements
are necessary to refine the fusion and detection al-
gorithms. For example, a SLAM based approach
could help to eliminate relative positioning inaccura-
cies. We also intend to make detection more robust by
implementing object classification and object tracking
techniques. Furthermore, in the context of sensor data
generation, more realistic models and / or real multi-
perspective LiDAR data would be beneficial, in order
to make the detection model transferable to real-world
scenarios.
ACKNOWLEDGEMENTS
This work was carried out as part of the “AI-NET
ANTILLAS” project (funding number 16KIS1311),
which was funded by the Federal Ministry of Ed-
ucation and Research (BMBF), Germany. Further-
VEHITS 2025 - 11th International Conference on Vehicle Technology and Intelligent Transport Systems
456

more, the authors thank Franziska Vogt for her valu-
able work on implementation and evaluation of the
fusion and detection algorithms.
REFERENCES
Abadi, M., Agarwal, A., Barham, P., Brevdo, E., Chen, Z.,
Citro, C., Corrado, G. S., Davis, A., Dean, J., Devin,
M., Ghemawat, S., Goodfellow, I., Harp, A., Irving,
G., Isard, M., Jia, Y., Jozefowicz, R., Kaiser, L., Kud-
lur, M., Levenberg, J., Man
´
e, D., Monga, R., Moore,
S., Murray, D., Olah, C., Schuster, M., Shlens, J.,
Steiner, B., Sutskever, I., Talwar, K., Tucker, P., Van-
houcke, V., Vasudevan, V., Vi
´
egas, F., Vinyals, O.,
Warden, P., Wattenberg, M., Wicke, M., Yu, Y., and
Zheng, X. (2015). TensorFlow: Large-scale machine
learning on heterogeneous systems. http://download.
tensorflow.org/paper/whitepaper2015.pdf.
Caesar, H., Bankiti, V., Lang, A. H., Vora, S., Liong, V. E.,
Xu, Q., Krishnan, A., Pan, Y., Baldan, G., and Bei-
jbom, O. (2020). nuScenes: A Multimodal Dataset
for Autonomous Driving. pages 11621–11631.
Charles, R. Q., Su, H., Kaichun, M., and Guibas, L. J.
(2017). PointNet: Deep Learning on Point Sets for 3D
Classification and Segmentation. In 2017 IEEE Con-
ference on Computer Vision and Pattern Recognition
(CVPR), pages 77–85. ISSN: 1063-6919.
Fang, S. and Li, H. (2024). Multi-Vehicle Cooperative Si-
multaneous LiDAR SLAM and Object Tracking in
Dynamic Environments. IEEE Transactions on In-
telligent Transportation Systems, 25(9):11411–11421.
Conference Name: IEEE Transactions on Intelligent
Transportation Systems.
Geiger, A., Lenz, P., Stiller, C., and Urtasun, R. (2013).
Vision meets robotics: The KITTI dataset. The Inter-
national Journal of Robotics Research, 32(11):1231–
1237. Publisher: SAGE Publications Ltd STM.
Geiger, A., Lenz, P., and Urtasun, R. (2012). Are we ready
for autonomous driving? the kitti vision benchmark
suite. In Conference on Computer Vision and Pattern
Recognition (CVPR).
He, K., Zhang, X., Ren, S., and Sun, J. (2016). Deep Resid-
ual Learning for Image Recognition. pages 770–778.
Ioffe, S. and Szegedy, C. (2015). Batch normalization: Ac-
celerating deep network training by reducing internal
covariate shift. pages 448–456.
Li, L., Yang, M., Weng, L., and Wang, C. (2022). Robust
localization for intelligent vehicles based on pole-like
features using the point cloud. IEEE Transactions
on Automation Science and Engineering, 19(2):1095–
1108.
Liu, W., Anguelov, D., Erhan, D., Szegedy, C., Reed, S.,
Fu, C.-Y., and Berg, A. C. (2016). SSD: Single
Shot MultiBox Detector. In Leibe, B., Matas, J.,
Sebe, N., and Welling, M., editors, Computer Vision
– ECCV 2016, pages 21–37, Cham. Springer Interna-
tional Publishing.
Massow, K. and Radusch, I. (2018). A rapid prototyp-
ing environment for cooperative advanced driver as-
sistance systems. Journal of Advanced Transporta-
tion, 2018(1):2586520.
Protzmann, R., Sch
¨
unemann, B., and Radusch, I. (2017).
Simulation of Convergent Networks for Intelligent
Transport Systems with VSimRTI, chapter 1, pages 1–
28. John Wiley & Sons, Ltd.
Royo, S. and Ballesta-Garcia, M. (2019). An Overview of
Lidar Imaging Systems for Autonomous Vehicles. Ap-
plied Sciences, 9(19):4093. Number: 19 Publisher:
Multidisciplinary Digital Publishing Institute.
Schrab, K., Neubauer, M., Protzmann, R., Radusch, I.,
Manganiaris, S., Lytrivis, P., and Amditis, A. J.
(2023). Modeling an ITS Management Solution for
Mixed Highway Traffic with Eclipse MOSAIC. IEEE
Transactions on Intelligent Transportation Systems,
24(6):6575–6585.
Strunz, M., Protzmann, R., and Radusch, I. (2024). Cross-
dataset generalization: Bridging the gap between real
and synthetic lidar data. In International Conference
on Simulation Tools and Techniques. Springer.
Sun, P., Kretzschmar, H., Dotiwalla, X., Chouard, A., Pat-
naik, V., Tsui, P., Guo, J., Zhou, Y., Chai, Y., Caine,
B., Vasudevan, V., Han, W., Ngiam, J., Zhao, H., Tim-
ofeev, A., Ettinger, S., Krivokon, M., Gao, A., Joshi,
A., Zhang, Y., Shlens, J., Chen, Z., and Anguelov,
D. (2020). Scalability in Perception for Autonomous
Driving: Waymo Open Dataset. pages 2446–2454.
Wu, Y., Wang, Y., Zhang, S., and Ogai, H. (2021). Deep
3D Object Detection Networks Using LiDAR Data:
A Review. IEEE Sensors Journal, 21(2):1152–1171.
Conference Name: IEEE Sensors Journal.
Xu, D., Zhou, A., Zhang, X., Wang, G., Liu, X., An, C.,
Shi, Y., Liu, L., and Ma, H. (2020). Understanding
operational 5g: A first measurement study on its cov-
erage, performance and energy consumption. In Pro-
ceedings of the Annual Conference of the ACM Spe-
cial Interest Group on Data Communication on the
Applications, Technologies, Architectures, and Proto-
cols for Computer Communication, SIGCOMM ’20,
page 479–494, New York, NY, USA. Association for
Computing Machinery.
Zhu, X., Su, W., Lu, L., Li, B., Wang, X., and Dai, J. (2021).
Deformable DETR: Deformable Transformers for
End-to-End Object Detection. arXiv:2010.04159.
Zou, Z., Chen, K., Shi, Z., Guo, Y., and Ye, J. (2023). Ob-
ject Detection in 20 Years: A Survey. Proceedings of
the IEEE, 111(3):257–276. Conference Name: Pro-
ceedings of the IEEE.
Improving Object Detection Through Multi-Perspective LiDAR Fusion
457
