
Benchmarking Efficiency in Mediterranean Ports:
A DEA-Based Analysis of Connectivity and Operational Performance
Chariton Tsakalidis
a
, Eirini Liani, George Tsakalidis
b
, Kostas Vergidis
c
and Michael Madas
d
Department of Applied Informatics, University of Macedonia, Thessaloniki, Greece
Keywords: Port Performance, Mediterranean Ports, Data Envelopment Analysis, Compare Port Efficiency,
Benchmarking Performance, Port KPIs.
Abstract: This study investigates the operational performance of major Mediterranean ports through a tailored Data
Envelopment Analysis (DEA) framework. Recognizing the underrepresentation of these ports in existing
benchmarking studies, this research emphasizes both connectivity and efficiency. Utilizing advanced DEA
methodologies—Constant Returns to Scale (CCR), Variable Returns to Scale (BCC) and Window Analysis—
the study evaluates efficiency trends over time, providing actionable insights for enhancement. Key input
variables such as terminal size, berth length and equipment count are analyzed alongside output metrics like
annual container throughput to ensure a comprehensive assessment of port performance. The findings reveal
significant efficiency disparities among Mediterranean ports, with transshipment hubs like Tanger Med and
Piraeus achieving optimal efficiency scores due to strategic investments and infrastructure upgrades.
Conversely, many ports operate below optimal levels, indicating opportunities for technical and managerial
improvements. This research contributes substantially to the field by introducing a novel benchmarking
framework tailored to the unique geopolitical dynamics of the Mediterranean region. It highlights the critical
role of connectivity, infrastructure and technology in driving efficiency while offering a valuable foundation
for policymakers and port authorities to implement targeted strategies that enhance competitiveness and foster
sustainable growth.
1 INTRODUCTION
Maritime trade has long served as a fundamental
pillar of global commerce and the establishment of
supply chains worldwide, facilitating the
transportation of vast quantities of goods across
various regions. The combined advantages of cost-
efficiency and reliability have positioned shipping as
a primary driver of growth in the era of globalization,
particularly in the Mediterranean area—a region of
geopolitical gravity where shipping has expanded its
market share relative to other European regions, as
noted by the European Commission's Internal Market
report. The Mediterranean container market
expanded to reach 55 million TEUs in 2014, driven
by the surge in world trade and higher
containerization rates. Containerized cargo thrives in
a
https://orcid.org/0009-0001-1572-439X
b
https://orcid.org/0000-0002-0889-7946
c
https://orcid.org/0000-0002-2755-499X
d
https://orcid.org/0000-0002-9809-8485
transfer hubs across the Mediterranean, while roll-
on/roll-off (RoRo) services also play an important
role, especially in Short Sea Shipping (SSS)
(Beizhen, 2021). The region acts as a vital link,
connecting South European ports with Africa, the
Americas, Northern Europe and Asia.
Despite a substantial imbalance in cargo volume
between the northern and southern Mediterranean due
to differing economic development levels,
Mediterranean ports have maintained their relevance
on the global stage (Colombo & Soler Lecha, 2020).
They have consistently accounted for approximately
9% of global container traffic over the past two
decades. Enhanced connectivity reinforces these
ports' competitive advantage by facilitating proximity
to major shipping routes (Martinez-Moya et al.,
2024), such as the Suez Canal and the Strait of
Tsakalidis, C., Liani, E., Tsakalidis, G., Vergidis, K. and Madas, M.
Benchmarking Efficiency in Mediterranean Ports: A DEA-Based Analysis of Connectivity and Operational Performance.
DOI: 10.5220/0013284600003929
Paper published under CC license (CC BY-NC-ND 4.0)
In Proceedings of the 27th International Conference on Enterprise Information Systems (ICEIS 2025) - Volume 2, pages 837-844
ISBN: 978-989-758-749-8; ISSN: 2184-4992
Proceedings Copyright © 2025 by SCITEPRESS – Science and Technology Publications, Lda.
837

Gibraltar, while also allowing for value-added
services like warehousing and repackaging.
Ports at the Mediterranean’s edge tend to perform
better in global trade than in local contexts, with
notable examples like Tanger Med, Port Said and
Algeciras leveraging strategic locations. These ports
capitalize on their proximity to important maritime
corridors to support regional and global economies
effectively.
The Mediterranean region, historically a vital
channel for goods transportation, has gained
increasing prominence in global trade, particularly
with the strategic importance of the Suez Canal and
the Strait of Gibraltar (Arvis et al., 2018). Despite its
consistent share of approximately 9% in global
container traffic over the last two decades, the region
faces substantial imbalances in cargo volumes
between its northern and southern ports, largely due
to differing levels of economic development. This
disparity underscores the need for comprehensive
port performance assessments.
While Northern Mediterranean ports have
benefited from economic and political stability, many
southern Mediterranean ports remain less integrated
into global trade networks. Furthermore, competition
among ports has intensified as modern technological
advancements and intermodal systems have reduced
reliance on immediate hinterland cargo, creating new
performance pressures (Pinto et al., 2017).
Previous research on port performance has often
focused on Northern European ports, leaving
Mediterranean ports underrepresented in
benchmarking studies. The growing shipping
volumes in the region and the emergence of
transshipment hubs and gateways demand a rigorous,
data-driven approach to assess the operational
efficiency and competitiveness of Mediterranean
ports. Addressing these gaps is essential for fostering
balanced development and ensuring that
Mediterranean ports remain integral to global supply
chains.
Based on this research gap, this paper aims to
benchmark the operational efficiency of major
Mediterranean ports using a Data Envelopment
Analysis (DEA) framework. This study seeks to
provide a comprehensive assessment of port
connectivity and performance, addressing critical
gaps in regional benchmarking data. The primary
objectives of the paper are: (1) To analyse
connectivity patterns in the Mediterranean Sea,
emphasizing the geopolitical and port-specific
characteristics that shape port performance. (2) To
address the underrepresentation of Mediterranean
ports in performance benchmarking studies by
employing a dynamic efficiency measurement
approach based on panel data. (3) To develop and
implement a tailored DEA model to evaluate the
operational efficiency of major Mediterranean ports,
including the selection of input-output variables and
comparative analysis across model variations. (4) To
investigate the relationship between key
determinants, such as port infrastructure and location,
and the efficiency scores obtained from the DEA
model, providing actionable insights for port
performance improvement.
This paper contributes to the field by applying a
tailored DEA framework to benchmark the efficiency
of major Mediterranean ports. It offers insights into
port connectivity and operational performance while
addressing the region's underrepresentation in
existing benchmarking studies. By analysing key
determinants of efficiency, the paper provides
actionable findings that can guide policy and strategic
improvements for port authorities and stakeholders in
the Mediterranean.
2 LITERATURE REVIEW
2.1 Port Performance and
Benchmarking
The performance of ports is assessed through various
metrics and methodologies. Key performance
indicators (KPIs) such as throughput in TEUs, berth
utilization rates and service times are used widely to
capture aspects of operational efficiency and
productivity (Cullinane & Wang, 2010). Frontier
analysis techniques, particularly DEA and Stochastic
Frontier Analysis (SFA), have become prominent for
benchmarking performance across ports (Cullinane &
Wang, 2010). DEA, a non-parametric method, is
popular for determining efficiency by comparing
Decision-Making Units (DMUs) under the
assumption of exact input-output relationships. It is
commonly used to identify underperformance by
establishing a best-practice frontier based on
observed data.
Comparative studies on ports frequently
categorize them by various attributes such as location,
annual throughput and terminal characteristics. For
example, studies using DEA models have segmented
ports based on TEU volumes or distinguished
between transshipment and gateway ports to
understand performance differentials and the impact
of specific port attributes. These benchmarking
analyses often highlight important efficiency
disparities, even among geographically proximate
ICEIS 2025 - 27th International Conference on Enterprise Information Systems
838

ports, due to differences in infrastructure, equipment
and management practices.
In recent years, multi-step DEA approaches have
been implemented, combining DEA with methods
such as SFA to account for noise in data and enhance
accuracy. For instance, studies comparing ports in
developing countries with their counterparts in
developed regions utilize hybrid models to isolate
technical efficiency from environmental effects. The
DEA-Malmquist index is also employed to track
changes in productivity over time, addressing both
technical and scale efficiencies.
Benchmarking port performance enables
authorities to adopt best practices and focus on
continuous improvement across multiple
performance dimensions, including operational,
financial, environmental and customer satisfaction
metrics. These methodologies allow for the
comparison of port operations in a structured manner,
driving a competitive and systematic approach to
efficiency improvements.
2.2 Key Performance Indicators (KPIs)
KPIs are established as quantifiable metrics used to
evaluate port efficiency across various dimensions,
including operational, financial and environmental
aspects (Duru et al., 2020). Initially, port KPIs
focused on operational aspects such as crane
movements per hour and container throughput,
providing a basis for comparative performance
analysis among terminals. Over time, however, the
scope of KPIs has expanded to include indicators that
account for logistical, customer-oriented, and
sustainability-related factors to reflect the evolving
needs of global port stakeholders (Woo et al., 2011).
The framework for categorizing KPIs often
considers both internal and external performance
dimensions, as different stakeholders—such as port
authorities, customers and environmental agencies—
prioritize various aspects of port efficiency.
Categories may include operational KPIs, like berth
occupancy and average container dwell time, as well
as financial KPIs, such as cost per TEU and revenue
per ton managed.
Modern approaches to KPI development
incorporate complex modelling techniques. For
instance, tools like the fuzzy-Delphi method (Wang
et al., 2014) and the Analytical Hierarchy Process
(AHP) (Ha et al., 2019) are utilized to weigh and
prioritize KPIs based on stakeholder importance,
ensuring that the metrics align with strategic
objectives across the operational landscape.
2.3 Benchmarking Methods
Benchmarking methods for port performance can be
broadly classified into index methods, frontier
analysis and process approaches (Bichou, 2013).
Index methods often involve financial ratios,
snapshot indicators and Total Factor Productivity
(TFP), offering straightforward metrics, but limited in
addressing comprehensive operational contexts.
Frontier analysis, encompassing DEA and SFA,
remains one of the most widely applied techniques
(De Borger B. et al., 2002). DEA employs linear
programming to construct a non-parametric frontier,
enabling the evaluation of multiple inputs and outputs
without assuming specific functional relationships.
Its variants, such as DEA-CCR for constant returns to
scale and DEA-BCC for variable returns, allow for
flexibility in capturing technical and scale efficiency.
Meanwhile, SFA provides a parametric approach that
incorporates stochastic factors to account for
environmental influences and data variability (Chang
& Tovar, 2014).
Advanced applications, like the Malmquist
Productivity Index, integrate DEA to analyze
productivity changes over time, distinguishing
between technical efficiency improvements and
technological advancements (Suárez-Alemán et al.,
2015). Additionally, hybrid approaches combining
DEA with methods like SFA or regression models
enhance robustness by addressing the limitations of
individual techniques.
Process approaches, including Total Quality
Management (TQM) and perception surveys,
contribute qualitative insights by incorporating
stakeholder feedback and expert judgment. These
approaches complement quantitative methods,
ensuring a holistic assessment of port performance.
The selection of a suitable benchmarking
methodology depends on the specific objectives, data
availability and contextual constraints of the analysis.
By employing these methods, researchers and
practitioners can derive actionable insights to drive
port efficiency and competitiveness (Feng et al., 2012).
3 METHODOLOGY
3.1 Benchmarking Framework
To systematically evaluate port performance, this
study employs a comprehensive benchmarking
framework, with Data Envelopment Analysis (DEA)
as the primary methodology. DEA is a linear
programming technique used to assess the efficiency
Benchmarking Efficiency in Mediterranean Ports: A DEA-Based Analysis of Connectivity and Operational Performance
839
of Decision-Making Units (DMUs) (Cooper et al.,
2007). It constructs a non-parametric efficiency
frontier based on multiple input and output variables,
allowing for comparative benchmarking without
requiring a predefined functional relationship
(Mustafa et al., 2021). Two primary DEA models—
Constant Returns to Scale (CCR) and Variable
Returns to Scale (BCC)—are implemented. The CCR
model assumes a fixed input-output ratio across all
DMUs, while the BCC model introduces flexibility
for scale efficiencies (Benicio & De Mello, 2019).
This framework integrates methodologies such as the
Malmquist Productivity Index to measure
productivity changes over time and combines DEA
with techniques like Stochastic Frontier Analysis
(SFA) to enhance robustness against environmental
factors and data variability. Key input variables include
berth length, terminal area and equipment quantity,
while output variables focus on container throughput
and other operational metrics. The selection of
variables is guided by expert screening and prior
studies to ensure relevance in the benchmarking
analysis. By leveraging this framework, the study aims
to identify efficiency drivers and provide actionable
insights for port performance optimization. This
approach allows for examining both technical and
scale efficiencies while accommodating diverse
operational contexts. This revision maintains all
critical references and information while making the
text more concise and focused.
3.2 Dataset
The dataset used in this study includes detailed
operational data from various Mediterranean ports,
sourced from publicly accessible databases, port
authorities’ records and commercial maritime reports.
Primary input variables encompass terminal
dimensions, berth length and equipment count, while
output variables include annual container throughput,
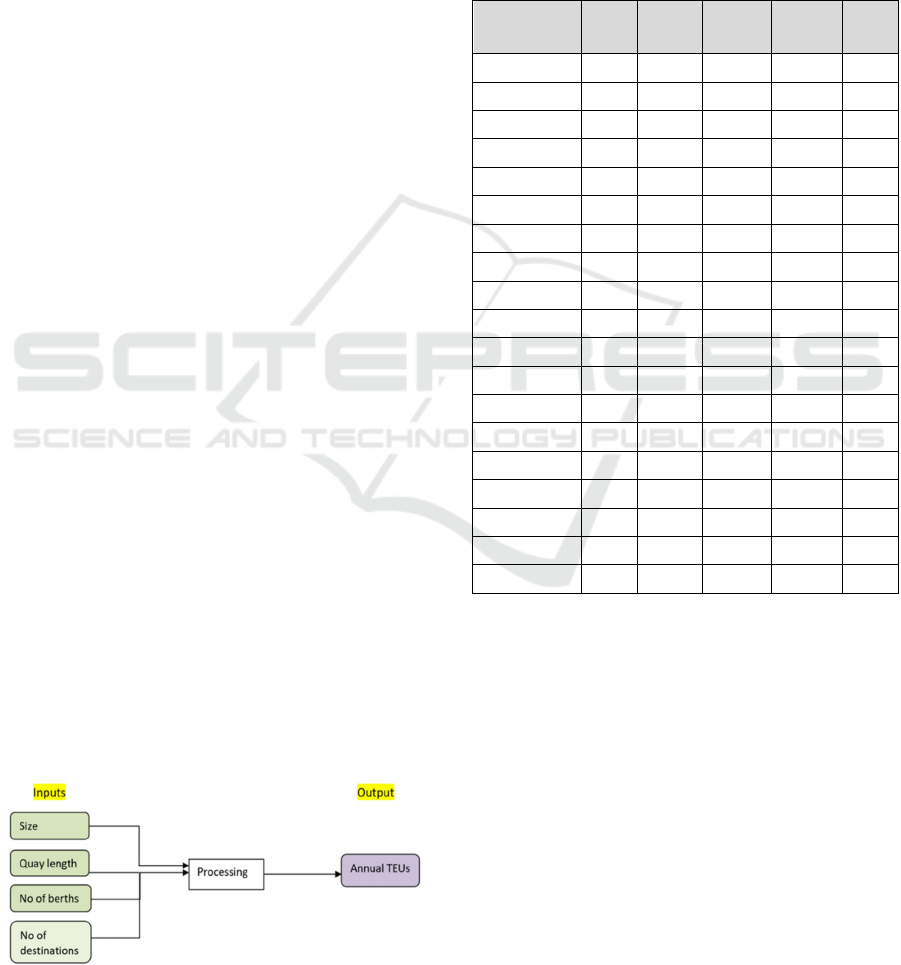
expressed in TEUs. Figure 1 illustrates the
relationship between input variables (e.g., terminal
size, berth length, and equipment count) and output
variables (e.g., annual throughput in TEUs) as
utilized in the DEA model.
Figure 1: DEA Graph with Inputs and Outputs.
Supplementary information, such as the year of
data capture and handling capacity, is used to ensure
uniform benchmarking across diverse ports. These
inputs were selected based on industry standards and
prior benchmarking studies to allow accurate
efficiency assessment across comparable contexts.
Table 1 presents the key input-output variables for the
DEA-CCR and DEA-BCC models, detailing the
dimensions of the dataset across multiple ports.
Table 1: Input data for DEA-CCR & BCC.
Sample-Ports (I) Size (I) Berths
(I) Quay
Length
(I)
Int. Tr.
Dest/tions
(O)
An. Teus
(2019)
Alexandria 200 4 732 47 851
Algeciras 306 9 4034 56 5125
Ambarli 95 6 2602 27 3104
Barcelona 1065 11 3000 56 3324
Casablanca 257 12 1500 42 6040
Genoa 700 6 1433 37 2621
Gioia Tauro 440 8 3391 8 2523
Haifa 158 4 1360 46 1470
Izmit (Evyap) 65 4 656 24 1715
La Spezia 150 8 1400 15 1409
Livorno 112 3 1858 27 789
Marsaxlokk 77 5 2801 40 2722
Marseilles 316 17 2798 41 1454
Mersin 112 9 1020 49 1854
Piraeus 220 9 2774 63 5648
Port Said 130 8 947 33 3816
Sines 151 6 1040 10 1420
Tanger Med 335 6 1200 55 4801
Valencia 456 11 3600 68 5439
3.3 Evaluation Metrics
Performance evaluation metrics focus on efficiency
scores derived from DEA using both the CCR and
BCC models. The study also employs technical
efficiency and scale efficiency scores to distinguish
managerial efficiency from size-driven advantages.
Additionally, dynamic metrics like Window Analysis
enable the comparison of port efficiency trends over
time by considering each port as a distinct Decision-
Making Unit (DMU) at different time intervals.
3.4 Procedures
The analysis follows a systematic application of
DEA, beginning with the standard DEA-CCR and
ICEIS 2025 - 27th International Conference on Enterprise Information Systems
840

DEA-BCC models to assess ports under constant and
variable returns to scale. The Malmquist Productivity
Index supplement this process to evaluate efficiency
changes over time. For each port, DEA models are
calibrated based on operational inputs and container
throughput, while Window Analysis is applied for
longitudinal efficiency comparison. The DEA Solver
software facilitates the computation, allowing for
consistent application of both CCR and BCC models
across the dataset (Cooper et al., 2007).
4 EXPERIMENTAL SETUP AND
BASELINE MODELS
4.1 Model Specifications
The analysis employs DEA models, specifically the
output-oriented CCR (constant returns to scale) and
BCC (variable returns to scale) approaches, to
evaluate the relative efficiency of Mediterranean
ports. The DEA framework incorporates inputs such
as terminal size, quay length and the number of
container berths, while the primary output is annual
container throughput in TEUs. The study also
includes time-dependent DEA through Window
Analysis, treating each port as a different DMU
across time periods. This enhances the discrimination
power of the model, identifying trends in port
performance over the observation period.
Key control variables are included to account for
external factors influencing port efficiency. These
variables include: (1) Port connectivity: Measured
through the number of intermodal destinations
served. (2) Economic indicators: Such as regional
GDP and trade openness. (3) Port size: Categories
based on terminal area to examine scale effects. These
variables ensure that the DEA results accurately
reflect operational efficiencies, minimizing biases
caused by external and contextual differences among
ports.
Baseline models include both standard DEA and
its advanced variations for robust comparison:
Standard DEA Models: CCR and BCC
models to evaluate technical and scale
efficiency.
Window DEA Analysis: To capture dynamic
performance trends over time.
Two-Stage DEA: Integrating regression
analysis in the second stage to investigate the
impact of exogenous factors, such as port
governance and hinterland connectivity.
Table 2 provides descriptive statistics for the
input and output variables used in the DEA analysis,
summarizing averages, minimums, and maximums
for terminal dimensions and throughput.
Table 2: Descriptive Statistics of Variables.
Variable Avg. Min Max Std. Dev.
Terminal Area
(hectares)
281.31 65.00 1065.00 248.74
No of berths
(container)
7.68 3.00 17.00 3.44
Quay Length
(meters)
2078.55 656.00 4034.00 1044.85
No of
transshipment
destinations
39.15 8.00 68.00 17.33
Annual
Throughput
(TEUs, 2019)
2953.94 789.00 6040.00 1722.09
5 RESULTS AND ANALYSIS
The results from the DEA analysis show average
efficiency scores of 0.744 and 0.835 for the CCR and
BCC models, respectively. This implies potential
output increases of 62.64% for the CCR model and
36.87% for the BCC model, without requiring
additional inputs. Table 3 summarizes the DEA
results, highlighting that a substantial number of ports
are operating below optimal efficiency levels.
For example, the BCC model identifies ten ports
as efficient, while the CCR model identifies 7,
indicating room for performance improvements
among most ports. The analysis by port type and size
shows that while transshipment ports tend to achieve
higher efficiency, the statistical weight is not robust.
An ANOVA test reveals that the efficiency
differences based on TEUs are statistically important
(p = 0.005), while those based on port type are not (p
= 0.064). The three-group size comparison (small,
medium, large) yields no statistically important
differences, indicating that port size alone does not
determine efficiency outcomes.
For temporal analysis, the Window Analysis
method reveals stability in efficiency scores across
most ports, with the notable exception of ports like
Piraeus, which shows a consistent upward trend due
to strategic improvements and investment. This
method allows for nuanced insights into efficiency
trends over time by treating each period as a different
observation for each port. Table 4 presents the
efficiency scores and ranks for ports under the BCC
model, highlighting performance variations driven by
variable returns to scale. In the reference set column
Benchmarking Efficiency in Mediterranean Ports: A DEA-Based Analysis of Connectivity and Operational Performance
841

in Tables 3 and 4, the ports that are used as reference
points are used. These ports are being used as a scale
for the inefficient ports to evaluate their efficiency.
When the ports reach maximum efficiency, i.e. 1,
their reference set is only themselves. The ports of
Casablanca and Tanger Med are used more often than
the others as reference ports, i.e., 8 times.
Table 3: DEA statistics, CCR-focused.
No DMU
CCR-
Score
CCR-
Rank
Reference
Set
Sum of
Lambdas
BCC-
Score
BCC-
rank
CCR
1 Ambarli 1 1 {1} 1 1 1 Constant
2 Casablanca 1 1 {2} 1 1 1 Constant
3 Gioia Tauro 1 1 {3} 1 1 1 Constant
4 Marsaxlokk 1 1 {4} 1 1 1 Constant
5 Piraeus 1 1 {5} 1 1 1 Constant
6 Port Said 1 1 {6} 1 1 1 Constant
7 Tanger Med 1 1 {7} 1 1 1 Constant
8 Algeciras 0.8994 8 {2,7,5} 1,065 0.9254 11 DRS
9 Izmit (Evyap) 0.8836 9 {5,4} 0,529 1 1 IRS
10 Sines 0.8161 10 {2,3} 0,416 1 1 IRS
11 Valencia 0.768 11 {2,7} 1,351 0.9204 12 DRS
12 Genoa 0.6793 12 {2,7} 1,91 0.7384 13 DRS
13 La Spezia 0.5967 13 {2,3} 0,478 0.697 15 IRS
14 Mersin 0.5568 14 {4,6} 0,899 0.5653 16 IRS
15 Haifa 0.5174 15 {5,7} 0,531 0.7314 14 IRS
16 Barcelona 0.5151 16 {2,7} 1,174 0.5625 17 DRS
17 Livorno 0.3766 17 {5,7} 0,401 1 1 IRS
18 Alexandria 0.2903 18 {2,7} 0,592 0.4872 18 IRS
19 Marseilles 0.2374 19 {2,3} 1,512 0.2449 19 DRS
No of efficient DMUs 7 10
Average efficiency 0.744 0.8354
Table 4: DEA statistics, BCC-focused.
No DMU
BCC-
Score
BCC-
Rank
Reference
Set
Scale Efficiency BCC
1 Ambarli 1 1 {1} 1 Constant
2 Casablanca 1 1
{
2
}
1 Constant
3 Gioia Tauro 1 1
{
3
}
1 Constant
4 Izmit
(
Ev
y
a
p)
1 1
{
4
}
0.8836 IRS
5 Livorno 1 1 {5} 0.3766 IRS
6 Marsaxlok
k
1 1 {6} 1 Constant
7 Piraeus 1 1 {7} 1 Constant
8 Port Sai
d
1 1
{
8
}
1 Constant
9 Sines 1 1
{
9
}
0.8161 IRS
10 Tan
g
er Me
d
1 1
{
10
}
1 Constant
11 Algeciras 0.9254 11 {2,7,10} 0.9719 Constant
12 Valencia 0.9204 12 {10} 0.8344 Constant
13 Genoa 0.7384 13
{
1,2,4,10
}
0.9199 IRS
14 Haifa 0.7314 14
{
4,5,10
}
0.7074 IRS
15 La S
p
ezia 0.697 15
{
1,2,9
}
0.8546 IRS
16 Mersin 0.5653 16 {4,6,10} 0.9849 IRS
17 Barcelona 0.5625 17 {2,7} 0.9158 Constant
18 Alexandria 0.4872 18 {4,5,10} 0.5958 IRS
19 Marseilles 0.2449 19
{
2,3
}
0.9693 Constant
ICEIS 2025 - 27th International Conference on Enterprise Information Systems
842

Table 5: Summary of DEA results.
Division CCR BCC
Scale
Efficiency
DMU
Efficient 7 (37%) 10 (53%) CRS
Inefficient 12 (63%) 9 (47%) DRS
Total 19 (100%) 19 (100%) IRS
Average Efficiency 0.744 0.835 0.885805
The results underscore the sensitivity of DEA to
data variations and missing values, particularly with
respect to underperforming ports. For example, data
errors or omissions in terminal area and berth length
measurements may affect efficiency scores. To
address these limitations, methods such as SFA and
super-efficient DEA could be integrated to adjust for
data inaccuracies and enhance the robustness of
findings. Future research could explore interval
models and regional comparisons to refine
benchmarks and expand insights.
6 DISCUSSION
The findings of this study highlight important
disparities in the operational efficiency of
Mediterranean ports, emphasizing the value of
benchmarking practices in driving improvements.
Ports such as Tanger Med and Piraeus demonstrate
how targeted investments in infrastructure and
technology can yield substantial efficiency gains,
aligning operations with the demands of global
supply chains. Their strategic use of location and
optimized input-output relationships sets benchmarks
for the region.
Conversely, many Mediterranean ports operate
below potential efficiency levels, indicating the need
for managerial and technical improvements. Focusing
on pure technical efficiency—maximizing outputs
from given inputs—is more critical than merely
scaling operations. This includes adopting resource
optimization through automation, smart terminal
operations, and intermodal connectivity to mitigate
bottlenecks, reduce idle time, and enhance throughput
capacity. Ports that integrate such technologies
perform better overall.
Intermodal connectivity also plays a pivotal role.
Ports with robust links to rail, road, and inland
waterways exhibit higher efficiency, showcasing the
importance of seamless logistics. For southern
Mediterranean ports, developmental and competitive
challenges compared to northern counterparts could
be addressed through enhanced hinterland
connectivity. This would better integrate these ports
into global trade networks and leverage their
geographic advantages.
These findings underscore the necessity for port
managers to optimize terminal layouts, invest in
advanced equipment, and adopt data-driven decision-
making. Collaborative efforts among ports can
generate synergies, sharing best practices and
infrastructure. Policymakers must support these
advancements through financial incentives and
favourable regulations, enabling operational
improvements. For instance, encouraging sustainable
practices, such as energy-efficient technologies,
addresses both efficiency and environmental
concerns.
While the study provides valuable insights, its
reliance on DEA methodology introduces limitations,
particularly its sensitivity to data quality. Future
research could address this by integrating stochastic
methods like SFA, which account for random
variations and external influences. Additionally,
leveraging advanced data collection tools, such as IoT
sensors, could enrich datasets with real-time
performance metrics. Addressing these aspects would
yield a more comprehensive understanding of port
operations.
Overall, this study emphasizes the importance of
strategic investments, technological innovation, and
regional collaboration in driving port efficiency. Ports
adopting dynamic benchmarking approaches and
prioritizing continuous improvement are better
positioned to remain competitive in the evolving
global trade landscape.
7 CONCLUSION
This study provides a comprehensive analysis of
Mediterranean port performance using DEA models,
highlighting critical insights into efficiency drivers
and benchmarking practices. Key findings include:
(a) Efficiency Scores, the average efficiency across
the ports analysed is 74.4% (CCR) and 83.5% (BCC),
indicating significant room for improvement. Ports
such as Tanger Med, Piraeus, and Marsaxlokk
consistently achieve efficiency frontier status. (b)
Role of Port Type and Scale, transshipment ports
demonstrate higher efficiency levels compared to
gateway ports, leveraging economies of scale and
strategic location advantages. However, the size of
the port was found to have an unimportant impact on
Benchmarking Efficiency in Mediterranean Ports: A DEA-Based Analysis of Connectivity and Operational Performance
843

efficiency. (c) Temporal Trends, Window Analysis
revealed stable efficiency scores over time, with
notable improvements in ports undergoing strategic
investments. These results emphasize the importance
of managerial practices and technological adoption in
achieving and sustaining efficiency. The implications
of this research extend beyond individual ports,
providing actionable insights for regional and global
port management.
REFERENCES
Arvis, J.-F., Vesin, V., Carruthers, R., Ducruet, C., &
Langen, P. W. de. (2018). Maritime networks, port
efficiency, and hinterland connectivity in the
Mediterranean.
Beizhen, J. (2021). Sustainable Short Sea Roll-on Roll-off
Shipping through Optimization of Cargo Stowage and
Operations [Aalborg University].
https://doi.org/10.54337/aau459967434
Benicio, J., & De Mello, J. C. S. (2019). Different types of
return to scale in dea. Pesquisa Operacional, 39(2),
245–260. https://doi.org/10.1590/0101-7438.2019.03
9.02.0245
Bichou, K. (2013). An empirical study of the impacts of
operating and market conditions on container-port
efficiency and benchmarking. Research in
Transportation Economics, 42(1), 28–37.
https://doi.org/10.1016/j.retrec.2012.11.009
Chang, V., & Tovar, B. (2014). Efficiency and productivity
changes for Peruvian and Chilean ports terminals: A
parametric distance functions approach. Transport
Policy, 31, 83–94. https://doi.org/10.1016/j.tranpol.20
13.11.007
Colombo, S., & Soler Lecha, E. (2020). Infrastructures and
Power In The Middle East And North Africa.
Cooper, W. W. (William W., Seiford, L. M., & Tone, K.
(2007). Data envelopment analysis: a comprehensive
text with models, applications, references and DEA-
solver software. Springer.
Cullinane, K., & Wang, T. (2010). The efficiency analysis
of container port production using DEA panel data
approaches. OR Spectrum, 32(3), 717–738.
https://doi.org/10.1007/s00291-010-0202-7
De Borger B., B., Kerstens, K., & Costa, Á. (2002). Public
transit performance: What does one learn from frontier
studies? Transport Reviews, 22(1), 1–38.
https://doi.org/10.1080/01441640010020313
Duru, O., Galvao, C. B., Mileski, J., Robles, L. T., &
Gharehgozli, A. (2020). Developing a comprehensive
approach to port performance assessment. Asian
Journal of Shipping and Logistics, 36(4), 169–180.
https://doi.org/10.1016/j.ajsl.2020.03.001
Feng, M., Mangan, J., & Lalwani, C. (2012). Comparing
port performance: Western European versus Eastern
Asian ports. In International Journal of Physical
Distribution and Logistics Management (Vol. 42, Issue
5, pp. 490–512). https://doi.org/10.1108/0960003121
1246537
Ha, M. H., Yang, Z., & Lam, J. S. L. (2019). Port
performance in container transport logistics: A multi-
stakeholder perspective. Transport Policy, 73, 25–40.
https://doi.org/10.1016/j.tranpol.2018.09.021
Martinez-Moya, J., Mestre-Alcover, A., & Sala-Garrido, R.
(2024). Connectivity and competitiveness of the major
Mediterranean container ports using ‘Benefit-of-the-
Doubt’ and ‘Common Sets of Weights’ methods in
Data Envelopment Analysis. Maritime Economics and
Logistics, 26(2), 261–282. https://doi.org/10.1057/s412
78-023-00258-w
Mustafa, F. S., Khan, R. U., & Mustafa, T. (2021).
Technical efficiency comparison of container ports in
Asian and Middle East region using DEA. Asian
Journal of Shipping and Logistics, 37(1), 12–19.
https://doi.org/10.1016/j.ajsl.2020.04.004
Pinto, M. M. O., Goldberg, D. J. K., & Cardoso, J. S. L.
(2017). Benchmarking operational efficiency of port
terminals using the OEE indicator. Maritime
Economics and Logistics, 19(3), 504–517.
https://doi.org/10.1057/mel.2016.6
Suárez-Alemán, A., Morales Sarriera, J., Serebrisky, T., &
Trujillo, L. (2015). When It Comes to Container Port
Efficiency, Are All Developing Regions Equal?
Standard-Nutzungsbedingungen.
http://creativecommons.org/licenses/by-nc-
nd/3.0/igo/legalcode
Wang, Y., Yeo, G. T., & Ng, A. K. Y. (2014). Choosing
optimal bunkering ports for liner shipping companies:
A hybrid Fuzzy-Delphi-TOPSIS approach. Transport
Policy, 35, 358–365. https://doi.org/10.1016/j.tranpol.2
014.04.009
Woo, S. H., Pettit, S., & Beresford, A. K. C. (2011). Port
evolution and performance in changing logistics
environments. Maritime Economics and Logistics,
13(3), 250–277. https://doi.org/10.1057/mel.2011.12
ICEIS 2025 - 27th International Conference on Enterprise Information Systems
844
