
Data Smells Are Sneaky
Nicolas Hahn
a
and Afonso Sales
b
School of Technology, PUCRS, Porto Alegre, RS, Brazil
Keywords:
Data Smells, Simulation, Technical Debt in AI, Data Debt, Data Quality, Anomaly Detection.
Abstract:
Data is the primary source for developing AI-based systems, and poor-quality data can lead to technical debt
and negatively impact performance. Inspired by the concept of code smells in software engineering, data
smells have been introduced as indicators of potential data quality issues, and can be used to evaluate data
quality. This paper presents a simulation aimed at identifying specific data smells introduced in the unstruc-
tured format and detected in a tabular form. By introducing and analyzing specific data smells, the research
examines the challenges in their detectability. The results underscore the need for robust detection mechanisms
to address data smells across different stages of a data pipeline. This work expands the understanding of data
smells and their implications, provinding new foundations for future improvements in data quality assurance
for AI-driven systems.
1 INTRODUCTION
Data is the primary source for developing AI-based
systems, where data analysis and validation are es-
sential first steps for machine learning practitioners.
Data quality issues can arise from multiple sources,
including data entry errors, insufficient cleaning or
inherent biases. Mitigating these issues requires a
well-structured data quality management approach,
encompassing profiling, cleansing, and data enrich-
ment (Munappy et al., 2019). Despite the availability
of tools and techniques supporting feature engineer-
ing and data transformation in AI pipelines (Recu-
pito et al., 2022), the demand for robust quality assur-
ance practices continues to grow (Ehrlinger and W
¨
oß,
2022). Poor data quality not only diminishes imme-
diate analytics effectiveness but also introduces data
debt - a form of technical debt specific to data - which
can degrade overall system performance and cascade
issues throughout the pipeline (Foidl and Felderer,
2019). This data debt, particularly when driven by
data quality issues or anomalies, significantly impacts
AI-enabled systems, reducing model accuracy and af-
fecting downstream processes (Bogner et al., 2021).
In analyzing technical debt specific to data, data
smells can be viewed through an analogy to code
smells. Code smells are warning signs in code, often
indicating suboptimal design or programming prac-
a
https://orcid.org/0009-0001-2551-1574
b
https://orcid.org/0000-0001-6962-3706
tices that increase the likelihood of future issues (San-
tos et al., 2018). Such smells are widely recognized
as markers of potential faults that may accumulate
over time, leading to technical debt within codebases
(Fowler and Beck, 1999; Van Emden and Moonen,
2012). In a similar manner, data smells signal latent
data quality issues that arises from ineffective data
management practices, posing risks that may compro-
mise data reliability and usability in the future (Foidl
et al., 2022). Although many other types of data qual-
ity issues have been extensively studied and addressed
in research (Gong et al., 2019; Gray et al., 2011; Man-
souri et al., 2021; Wang and Abraham, 2015), un-
derstanding of data smells - along with their impact
and precise definitions - remains an evolving area.
Recent contributions have expanded the foundational
data smells catalog proposed by Foidl et al. (2022),
with additional classifications introduced by Recupito
et al. (2024) to further explore these indicators.
In contrast to traditional software, where changes
primarily occur in code, machine learning systems
mature through changes in data, models, and code
(Sato et al., 2019). The feedback loop in machine
learning systems is also generally longer, and, given
their highly interconnected nature, any change within
one stage of the lifecycle can trigger ripple effects
across the entire pipeline (Sculley et al., 2015). While
data pipelines can improve productivity and enhance
data quality (Munappy et al., 2020), poorly designed
or error-prone pipelines may fail to detect data qual-
Hahn, N. and Sales, A.
Data Smells Are Sneaky.
DOI: 10.5220/0013285500003929
In Proceedings of the 27th International Conference on Enterprise Information Systems (ICEIS 2025) - Volume 1, pages 479-488
ISBN: 978-989-758-749-8; ISSN: 2184-4992
Copyright © 2025 by Paper published under CC license (CC BY-NC-ND 4.0)
479

ity issues, potentially leading to low-quality data out-
put (Zhang et al., 2022). Such issues can propagate
through various processing stages, remaining unde-
tected until they eventually impact results. Testing
these changes poses an additional challenge, as all
three components - data, model, and code - require
evaluation, and a full training and testing cycle may
require substantial time, resource, and financial costs.
As machine learning pipelines scale to production en-
vironments, the supporting infrastructure becomes in-
creasingly complex. Therefore, identifying and ad-
dressing potential issues early in the data analysis
phase becomes highly valuable, as this enables faster,
easier, and more cost-effective remediation.
This paper aims to investigate data smells through
a simulation study. By controlling the data generation
process, we specify which data smells are introduced
and examine how these are detected. Additionally, we
include non-tabular data to observe how data smells
originating in unstructured formats are affected once
transformed into tabular form. For the detection pro-
cess, we use the open-source detectors provided by
Foidl et al. (2022) for tabular data, and we mapped
these same smells in the unstructured data before tab-
ular conversion. This study is guided by the following
research questions:
• RQ1: Do data smells present in unstructured data
remain detectable when the data is converted into
tabular form?
• RQ2: Does the detection process accurately re-
flect the data smells present within the data?
The remaining paper is structured as follows. Sec-
tion 2 provides the background, detailing the concept
of data smells, data debt, and the probability distribu-
tions employed in the data generation process, and it
also reviews related works, establishing connections
to this study and identifying gaps addressed by our
approach. Section 3 outlines the simulation study
methodology, including the specific data smells in-
troduced and the detection mechanism used. Section
4 presents the results, highlighting key findings and
their implications for data quality assurance. In Sec-
tion 5, we discuss threats to validity, addressing the
limitations of the tools and methods employed and
how they impact the study’s conclusions while pro-
viding insights into the replicability and future exten-
sion of the research. And, finally, Section 6 concludes
the paper with a concise summary of the findings and
proposes directions for future research.
2 BACKGROUND
This section begins by defining key concepts central
to this study, including data smells and data debt,
in Section 2.1, highlighting their significance in data
quality and AI systems. Following this, Section 2.2
reviews related works, providing context and identi-
fying gaps that this research aims to address.
2.1 Data Smells and Data Debt
Data smells are indicators of potential data quality is-
sues, characterized by data values that suggest prob-
lems regardless of context, and are often a result of
suboptimal practices. Poor data management prac-
tices, commonly observed in early-stage startups, can
exacerbate the emergence of data smells, acting as
barriers to maintaining data quality (Melegati et al.,
2019). The term first appeared in the grey literature
in 2014, introduced by Harris (2014), who empha-
sized the importance of critically evaluating data prior
to deriving results and conclusions. Shortly there-
after, Iubel (2014) adopted the term and proposed 13
data smells specific to the data journalism domain
on GitHub. A more comprehensive catalog was in-
troduced by Foidl et al. (2022), identifying 36 data
smells organized into four main categories: Believ-
ability Smells, Consistency Smells, Encoding Smells,
and Syntactic Smells. Later, Recupito et al. (2024)
expanded this catalog, adding 12 new data smells and
three additional categories: Redundant Value Smells,
Distribution Smells, and Miscellaneous Smells. Fig-
ure 1 illustrates the catalog from Foidl et al. (2022),
with new additions from Recupito et al. (2024) high-
lighted in bold.
Data smells exhibit a moderate degree of suspi-
cion, meaning they are not immediately flagged as
problematic upon initial inspection. For example, the
word “Paris” might seem unremarkable, as it repre-
sents a well-known city. However, complications may
arise when specific geographical information is re-
quired, as there are at least two cities named Paris —
one in France and another in the USA. A key charac-
teristic of data smells is their context independence:
they represent universal issues that can manifest in
any domain, potentially affecting any data-driven sys-
tem. Additionally, data smells can remain unnoticed
for extended periods, only to cause problems later,
such as less accurate classification models or incorrect
descriptive statistics. Finally, data smells often arise
from poor data management and engineering prac-
tices. Therefore, the implementation of quality assur-
ance methods can significantly improve the quality of
processed data.
ICEIS 2025 - 27th International Conference on Enterprise Information Systems
480
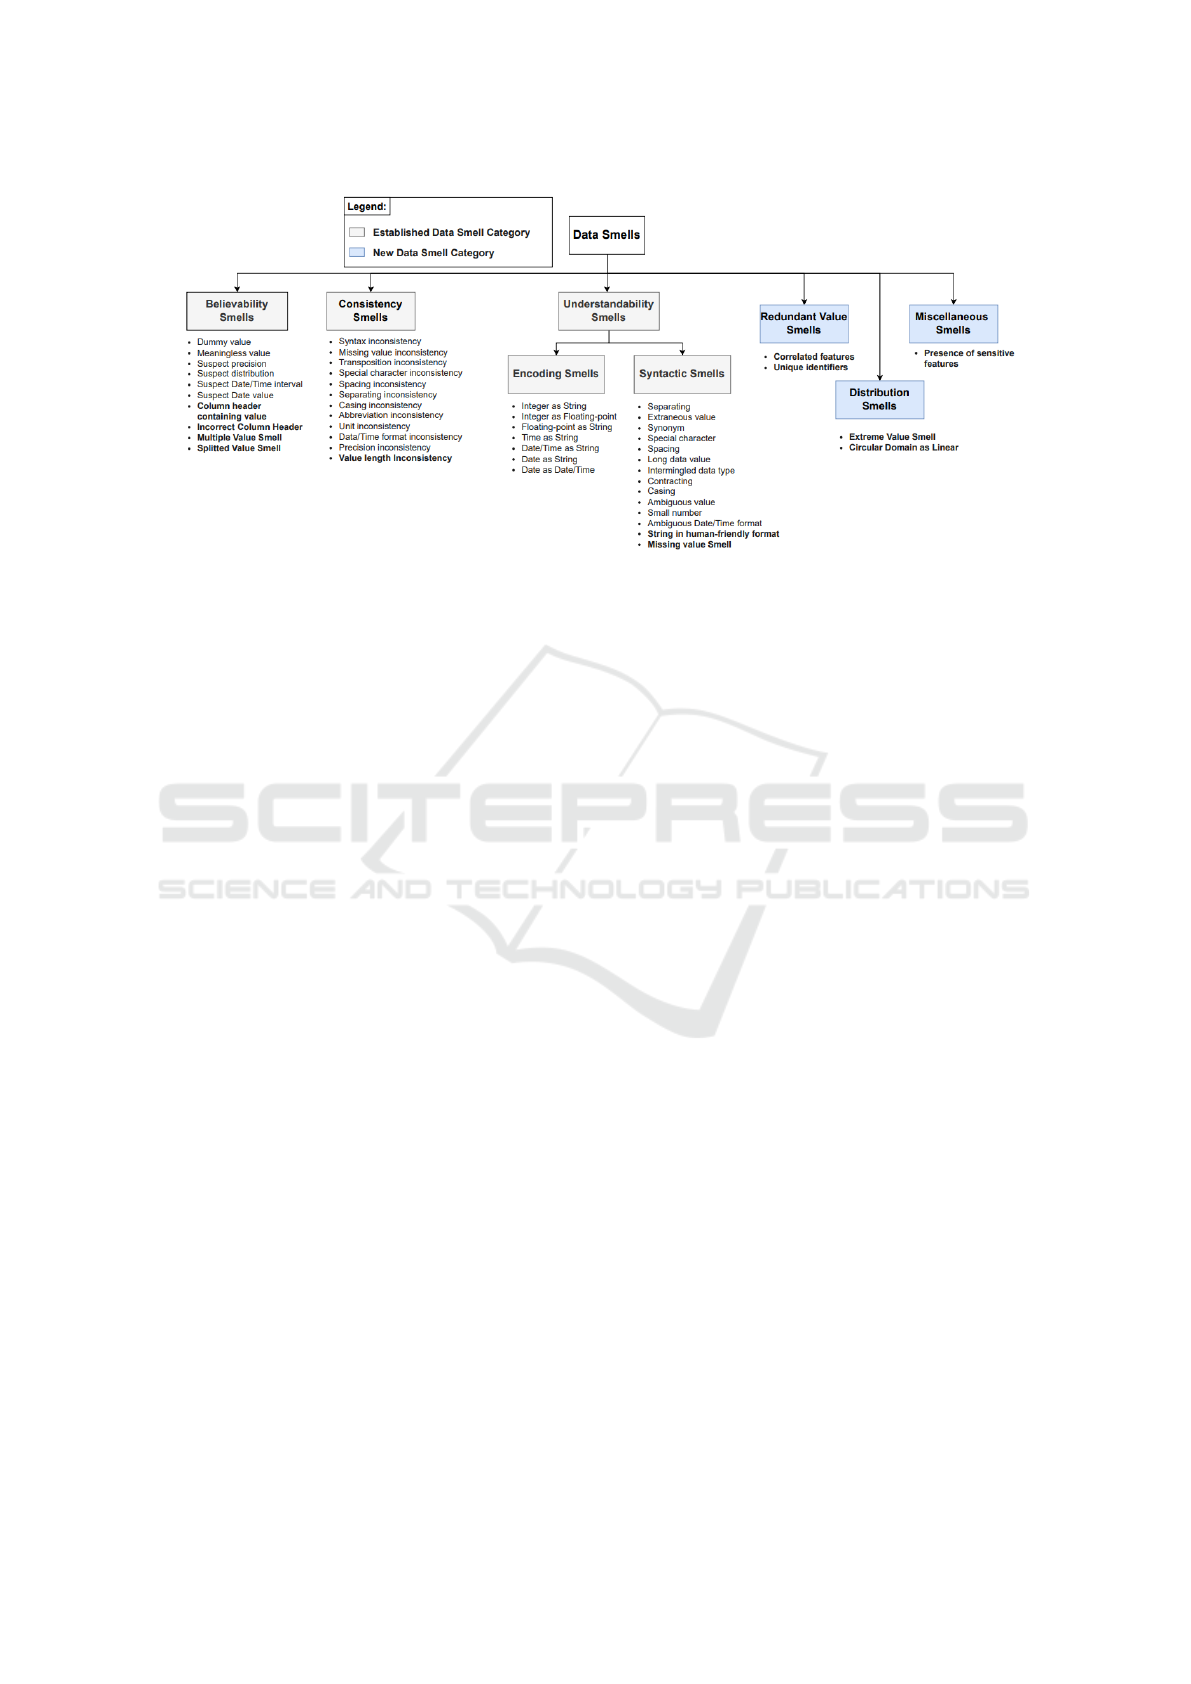
Figure 1: Data Smell Catalogue Expanded by Recupito et al. (2024).
Several studies have explored the concept of data
debt in AI-enabled systems. Sculley et al. (2015) in-
troduced the idea of technical debt in the context of
the data used to build AI models. They examined
the dependencies within data, highlighting the risks
posed by unstable data dependencies, where changes
could lead to unpredictable consequences for the en-
tire system, as well as underutilized data dependen-
cies within an AI pipeline. Bogner et al. (2021) sub-
sequently conducted a systematic mapping study to
explore the types of data smells. Data debt is the most
recurrent type of AI-specific debt of all the types of
technical debt explored for AI-enabled systems. In a
case study, Munappy et al. (2019) explored data man-
agement challenges in deep learning systems, focus-
ing on critical issues related to data structure, includ-
ing deduplication and the management of heteroge-
neous data in terms of encoding and format. Bosu and
MacDonell (2013) performed a systematic literature
review on data quality research within empirical soft-
ware engineering, revealing that only a small number
of 23 studies addressed the three key activities of data
quality management: data collection reporting, data
preprocessing, and the identification of data quality
issues. Yoon and Bae (2010) evaluated six different
techniques to face outliers anomalies in the context of
software project data, discovering that data cleaning
techniques on artificial datasets are a considerable so-
lution for this type of data quality issue. Liebchen
and Shepperd (2008) expanded on earlier literature
reviews, identifying new challenges in data quality
management for software engineering, and noted an
increasing interest among practitioners in exploring
techniques that can automatically detect data quality
issues. These studies put the basis for further investi-
gation into the complexities of data debt.
2.2 Related Work
Data problems are widely explored in the literature.
However, there is not a consensus on the terms that
are used to refer to these problems: dirty data (Kim
et al., 2003; Li et al., 2011), data error (Abedjan et al.,
2016), data defect (Josko et al., 2019), data anomaly
(Foorthuis, 2018; Sukhobok et al., 2017), data quality
problem (Oliveira et al., 2005). For a comprehensive
overview of the broader concepts of data quality and
data handling, refer to the works of Batini and Scan-
napieco (2016), as well as Ilyas and Chu (2019). Ad-
ditionally, Heck (2024) presents the current state of
data engineering focused on AI-based systems.
The work developed by Roman et al. (2022) in-
volved creating a demo site for data acquisition via
sensors in photovoltaic cells (solar panels), address-
ing data quality issues such as missing data, inconsis-
tent timing, unknown conditions, changes in the ex-
periment environment, and not large enough experi-
ment. This study intends to observe the behavior and
potential issues present in a real-world scenario. The
difference is that the authors work involved develop-
ing a small solar power generation station, while this
study was restricted to a computational simulation.
Bayram et al. (2023) presented a framework called
DQSOPs (Data Quality Scoring Operations), which
provides a quality score for data in production within
DataOps workflows. For the score, two approaches
are presented: ML prediction-based and standard-
based, involving data quality dimensions such as ac-
curacy, completeness, consistency, timeliness, and
skewness. Additionally, the cited data quality issues
involve only numerical values. Although a direct rela-
tionship is not presented, it is possible to identify the
connection between data quality dimensions and the
Data Smells Are Sneaky
481

data smells presented by Foidl et al. (2022) (e.g., data
anomaly).
Also, the work developed by Ter Hofstede et al.
(2023) presents a discussion on the challenges related
to data quality from both research and practical per-
spectives. Additionally, it is noteworthy that the au-
thors present the existing problems and possible solu-
tions for proper data cleaning.
The work presented by Shome et al. (2022) in-
volved analysis of 25 datasets from Kaggle - an online
repository - to identify recurrent data smells on pub-
lic datasets. The scope of their work was restricted
to structured data, i.e., tabular data. Also, their anal-
ysis revealed technical debt in the dataset due to lack
of best practices and standardised procedures in up-
stream processes.
Golendukhina et al. (2022) explored the impact of
data smells in a real-world business travel data sce-
nario, using the taxonomy from Foidl et al. (2022) to
identify data smells across the data pipeline. They
highlighted three stages where data smells occur:
1. Data Sources. Originally, some of the data smells
come from the raw data. Inconsistent data value
entries by different users, different sources and
differing data management methods.
2. Data Transformation. The next group of data
smells arises in the data transformation stage. Is-
sues like date/time represented as strings, num-
bers as strings, and inconsistent missing values
from different tools and programming languages
used.
3. Data Enrichment. The majority of data smells
are produced in the data enrichment phase, of-
ten due to insufficient validation in earlier phases.
However, data smells can also be produced from
clean data, e.g., if time zones are not consid-
ered. Although spotting data smells in some cases
might be challenging, analysis of the products of
such data can facilitate the process.
The study emphasizes the significant impact of the
data pipeline on data quality and suggests that data
validation strategies are needed on different stages of
the pipeline.
Finally, Recupito et al. (2024) extended the data
catalog from Foidl et al. (2022) up to 50 data smells,
including new categories. Also, using the data studied
by Le Quy et al. (2022) and a subset of the data qual-
ity metrics described by Elouataoui et al. (2022), they
identified a positive correlation between the presence
of Extreme Value Smells and the Readability quality
metric.
3 SIMULATION STUDY
To investigate data smells and address our research
questions, we conducted a simulation study of data
at different pipeline stages, considering correct data,
raw data, and tabular data. Figure 2 illustrates the en-
tire process, highlighting each phase from initial data
generation to the final detection step, allowing us to
analyze the presence of data smells.
We opted for numeric data due to its flexibility and
ease of controlled generation with variability. We start
by the generation phase, detailed as follows:
1. Choose Generation Process. Numeric data can
be generated in two primary types - integers and
floating-point numbers - using either arbitrary val-
ues or probability distributions. The strategy cho-
sen depends on the intended representation of the
data:
• sequential: For scenarios requiring simple
identifiers (e.g., user IDs), we generate arbi-
trary values as a sequence of positive integers,
such as 1, 2, 3, . . . .
• probability distribution: For data with specific
contextual meanings, such as the count or tim-
ing of system failures, we can use:
– The Poisson distribution (parameter λ) to
model the average number of failures per time
interval, generating non-negative integers.
– The Exponential distribution (parameter λ) for
estimating the average time between failures,
generating non-negative floating-point num-
bers.
– The Uniform distribution (continuous or dis-
crete) for generating values within a specified
range (e.g., (0, 1) or (1, 100)), which can be
integers or floating points as needed.
For further details on these probability distribu-
tions, refer to Casella and Berger (2001).
2. Choose Probability Distribution’s Parameters
Values. When generating data through probabil-
ity distributions, we specify distribution param-
eters based on the chosen distribution. For this
study, we limit our scope to Uniform, Poisson,
and Exponential distributions, as they are suffi-
cient to create varied, realistic numeric data.
Also, we will generate these data in batches to con-
sider a scenario that the data is not static, but on a
streaming environment, reflecting real-world scenar-
ios where data may change over time. The resulted
data values of these phase represents the category of
correct data, because they are the original data with-
out any intervention nor errors, and, consequently,
without any data smell.
ICEIS 2025 - 27th International Conference on Enterprise Information Systems
482
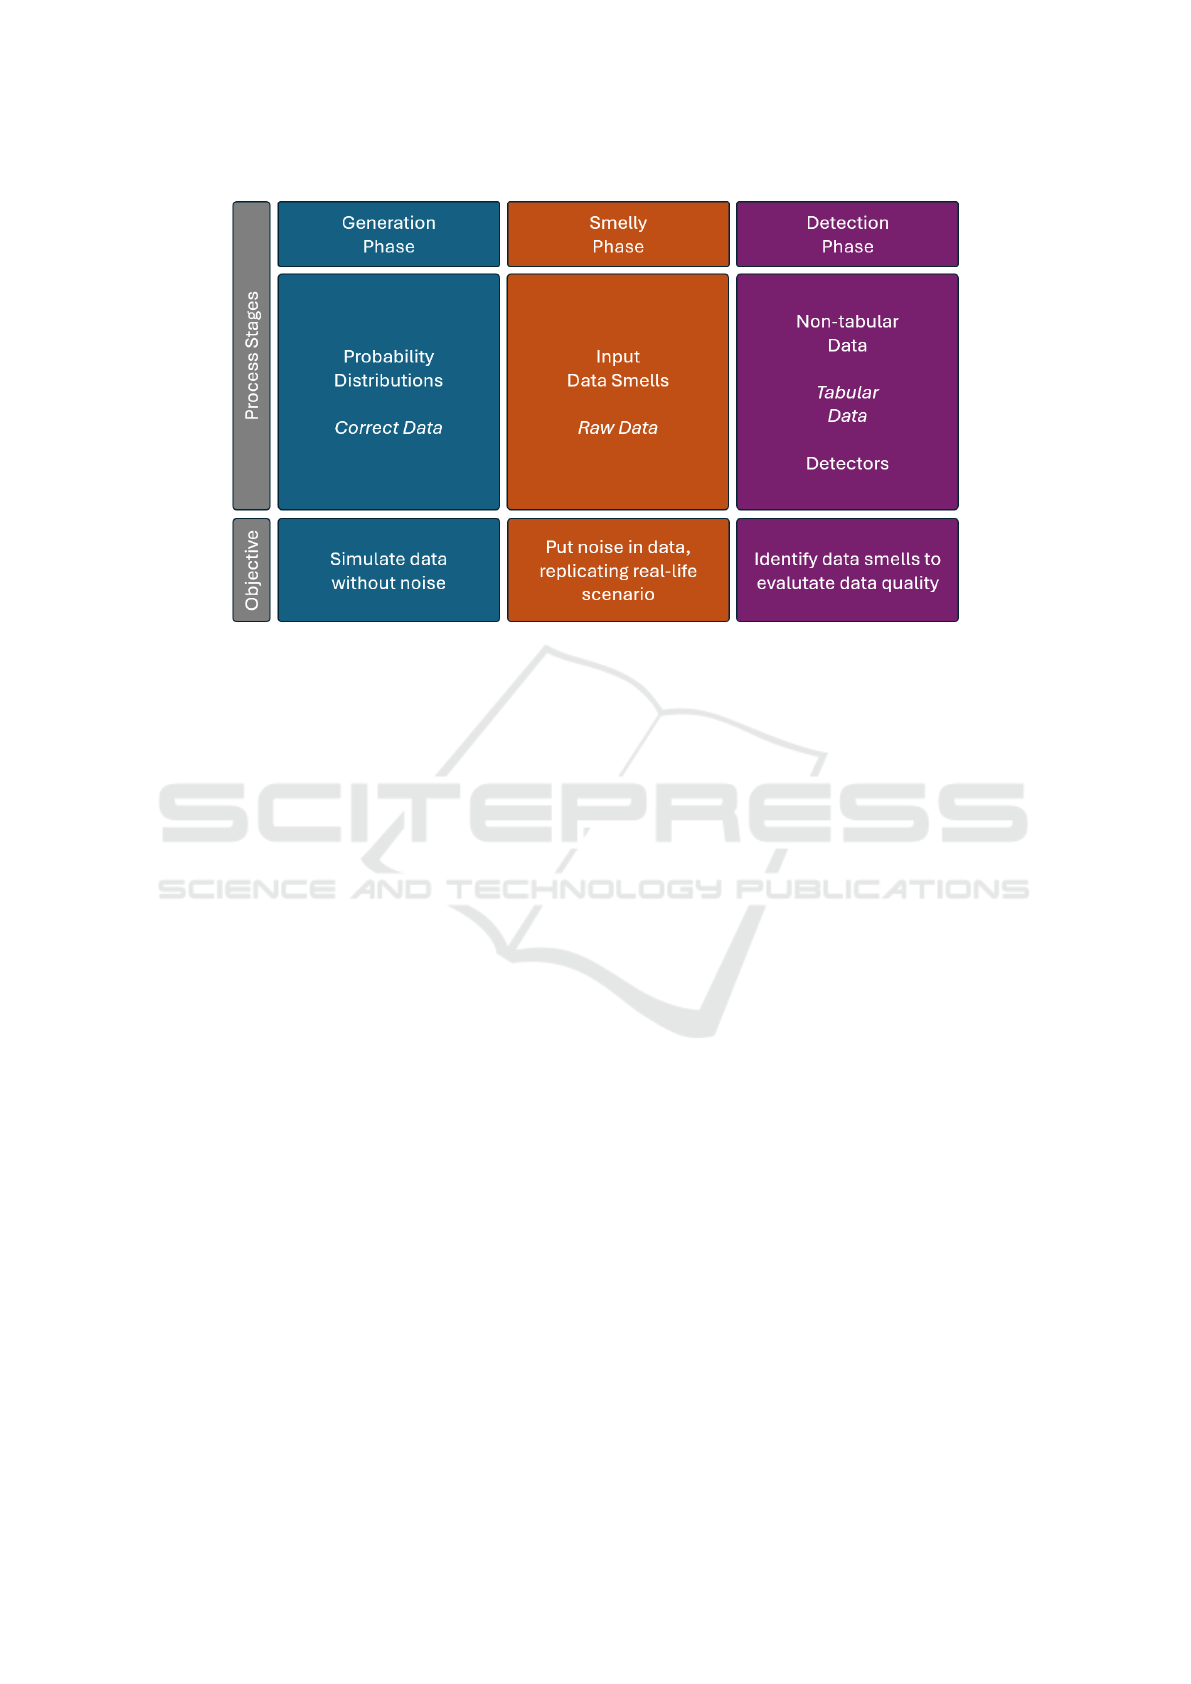
Figure 2: Methodology diagram ilustrating the entire process.
Next, we follow to the smelly phase, that we in-
troduce different data smells in the numeric vector
generated correct data. To avoid any transformation
that may occur when data is in a structured tabular
form (e.g., convert data values to attend a specific ta-
ble schema), we chose to put data smells on the nu-
meric vectors resulted by the generated phase. The
data smells considered are detailed below:
• Duplicate Value Smell (DupVS). This smell oc-
curs when the same data value is repeated multiple
times. They are detectable by instance and are ap-
plied at all data types. We imputed on the vector
by repeating the previous instance.
• Dummy Value Smell (DumVS). This smell char-
acterizes a situation in which a kind of substi-
tute value is used due to several reasons (e.g.,
unknown values, computation errors, surpassing
“not NULL” constraints, etc.). They are de-
tectable by instance and are applied at the data
types Text, Numeric, Date/Time. We imputed in
the vector by putting the values 999 (batch 1) and
−1 (batch 2).
• Suspect Precision Smell (SPS). This smell arises
when a data value has a large number of decimal
places. They are detectable by instance and are
applied at the data type Numeric. We imputed by
adding standard Gaussian noise on the 1e − 5 dec-
imal point.
• Integer/Floating-point Number as String
Smell (IFSS). This smell occurs when an
integer/floating-point number is encoded as a
string. They are detectable by instance and are
applied at the data type Numeric. We imputed by
converting the instance to string.
• Integer as Floating-Point Number (IFS). This
smell occurs when an integer is encoded as a
floating-point number. They are detectable by in-
stance and are applied at the data type Numeric.
We imputed by converting the instance to floating-
point number.
• Missing Value Smell (MVS). This smell occurs
when the data value is missing. They are de-
tectable by instance and are applied to all data
types. We imputed by removing the instance from
the vector.
• Extreme Value Smell (EVS). This smell occurs
when some of the values strongly differ from the
data distribution. They are detected by parti-
tion and are applied mainly at the data type Nu-
meric. We imputed by multiplying the respective
instance by 10,000.
• Suspect Sign Smell (SSS). This smell occurs
when there is a value with the opposite sign of the
majority of the data values. They are detected by
partition and are applied at the data type Numeric.
We did not imput, but it can be detected because
the dummy value −1 that we imputed.
The data generated in this phase is referred to as raw
data since it includes data collected at the source,
with smells present but without any transformations
applied. Later, we organize these values into a struc-
tured, tabular format, resulting on the tabular data.
Each batch is processed separately to prevent schema
overwriting.
Data Smells Are Sneaky
483

In the final phase, the detection phase, we aimed
to compare data smells present in both the raw data
and tabular data. For the tabular data, we utilized
the Rule-Based Data Smell Detection tool provided
by Foidl et al. (2022). For the raw data, we tracked
all introduced smells throughout the data generation
process, providing a direct reference for comparison.
4 RESULTS
We generated two batches of size n = 1, 000 for each
probability distribution. Our main goal was to have
numeric vectors that represent “realistic” data. Also,
imputing data smells on data before tabulate let us
compare the incidence of data smells on different
cases. Each of the seven data smells was imputed
with an incidence between 1% and 5%, and they were
mapped so we can compare them in both raw data
and tabular data. Table 1 ilustrates the setup for the
data generated with all the smells.
After tabulating the data, we utilized the Rule-
Based Data Smell Detection. In our tests, the only
smell that the tool was able to accurately detect all in-
stances was the Missing Value Smell. Figure 3 shows
the smells detected on batch 1 of the vector generated
by the Poisson distribution (remember that data gen-
erated from this distribution has non-negative integer
values). As we can see in Figure 3, the only smells
detected were MVS, EVS and IFS. However, the only
instance detected as an EVS was a combination of
the dummy value 999 multiplied by 10, 000. Also,
the IFS was overly detected, showing that the inte-
gers were converted to floating-point numbers when
they were processed by the tool. Next, we evaluated
the results for batch 2 of the vector generated by the
Poisson distribution (Figure 4). The smells detected
were MVS, SSS, EVS and IFS. The dummy value
−1 was detected as SSS instead of DumVS, and this
is expected because they were the only negative val-
ues of the vector. Again, the IFS was overly detected,
showing that the integers were converted to floating-
point numbers when they were processed by the tool.
However, the detection results for the EVS were bet-
ter than for batch 1, accurately detecting 31/35 of the
EVS imputed.
We repeated the detection process to all tabulated
data generated, and the results are shown in Tables 2
and 3.
It is noteworthy that no instances of IFSS were
detected, indicating that these smells were addressed
during the data tabulation process and the schema’s
conversion of string values to float. Also, it wasn’t de-
tected any instance with SPS, indicating that the tool
needs improvement to identify this smell.
With these results, we can answer our research
questions:
• RQ1. It depends. Even when data smells are
not explicitly detected, they may still be present.
Some, such as IFSS, are corrected during the
processing stages. Smells such as DumVS and
Missing Value persist and are easily identifiable
(though identifying the specific dummy value
used for DumVS may require additional analysis).
However, others, such as IFS, may even be inad-
vertently inserted into the vector.
• RQ2. Overall, no. As previously mentioned,
cases such as DumVS and MVS are relatively eas-
ier to detect. However, EVS can blend with the
data, rendering it “invisible” to detectors. Addi-
tionally, DupVS may be overly detected without
necessarily representing a “real” data smell, as
the original data might legitimately contain multi-
ple instances of the same value. Finally, IFS was
overly detected in our tests due to the conversion
of integers to floats.
5 THREATS TO VALIDITY
The choice of instrumentation is a critical factor af-
fecting the validity of the conclusions, particularly in
detecting data smells. This study utilized the rule-
based detection tool provided by Foidl et al. (2022)
for tabular data due to its standardized approach, but
the absence of comparable tools for non-tabular data
represents a significant limitation.
Another threat arises from the simulation-based
methodology, which may not fully capture the com-
plexities and variability of real-world data pipelines,
such as the development of Minimum Viable Products
(MVPs) in software startups (Melegati et al., 2020;
Chanin et al., 2018). While the controlled environ-
ment enabled precise analysis, it inherently lacks the
unpredictability and diversity of operational data sys-
tems. Additionally, the study focused exclusively on
numerical data and a limited set of data smells, which
restricts the generalizability of the findings to other
data types.
Finally, the reliance on specific probability dis-
tributions and parameter values in the data gener-
ation process may not encompass all possible sce-
narios encountered in practical applications. Future
work should address these limitations by expanding
the scope of data types, exploring detection tools for
unstructured data, and validating findings against di-
verse, real-world datasets to ensure broader applica-
bility and robustness of the conclusions.
ICEIS 2025 - 27th International Conference on Enterprise Information Systems
484
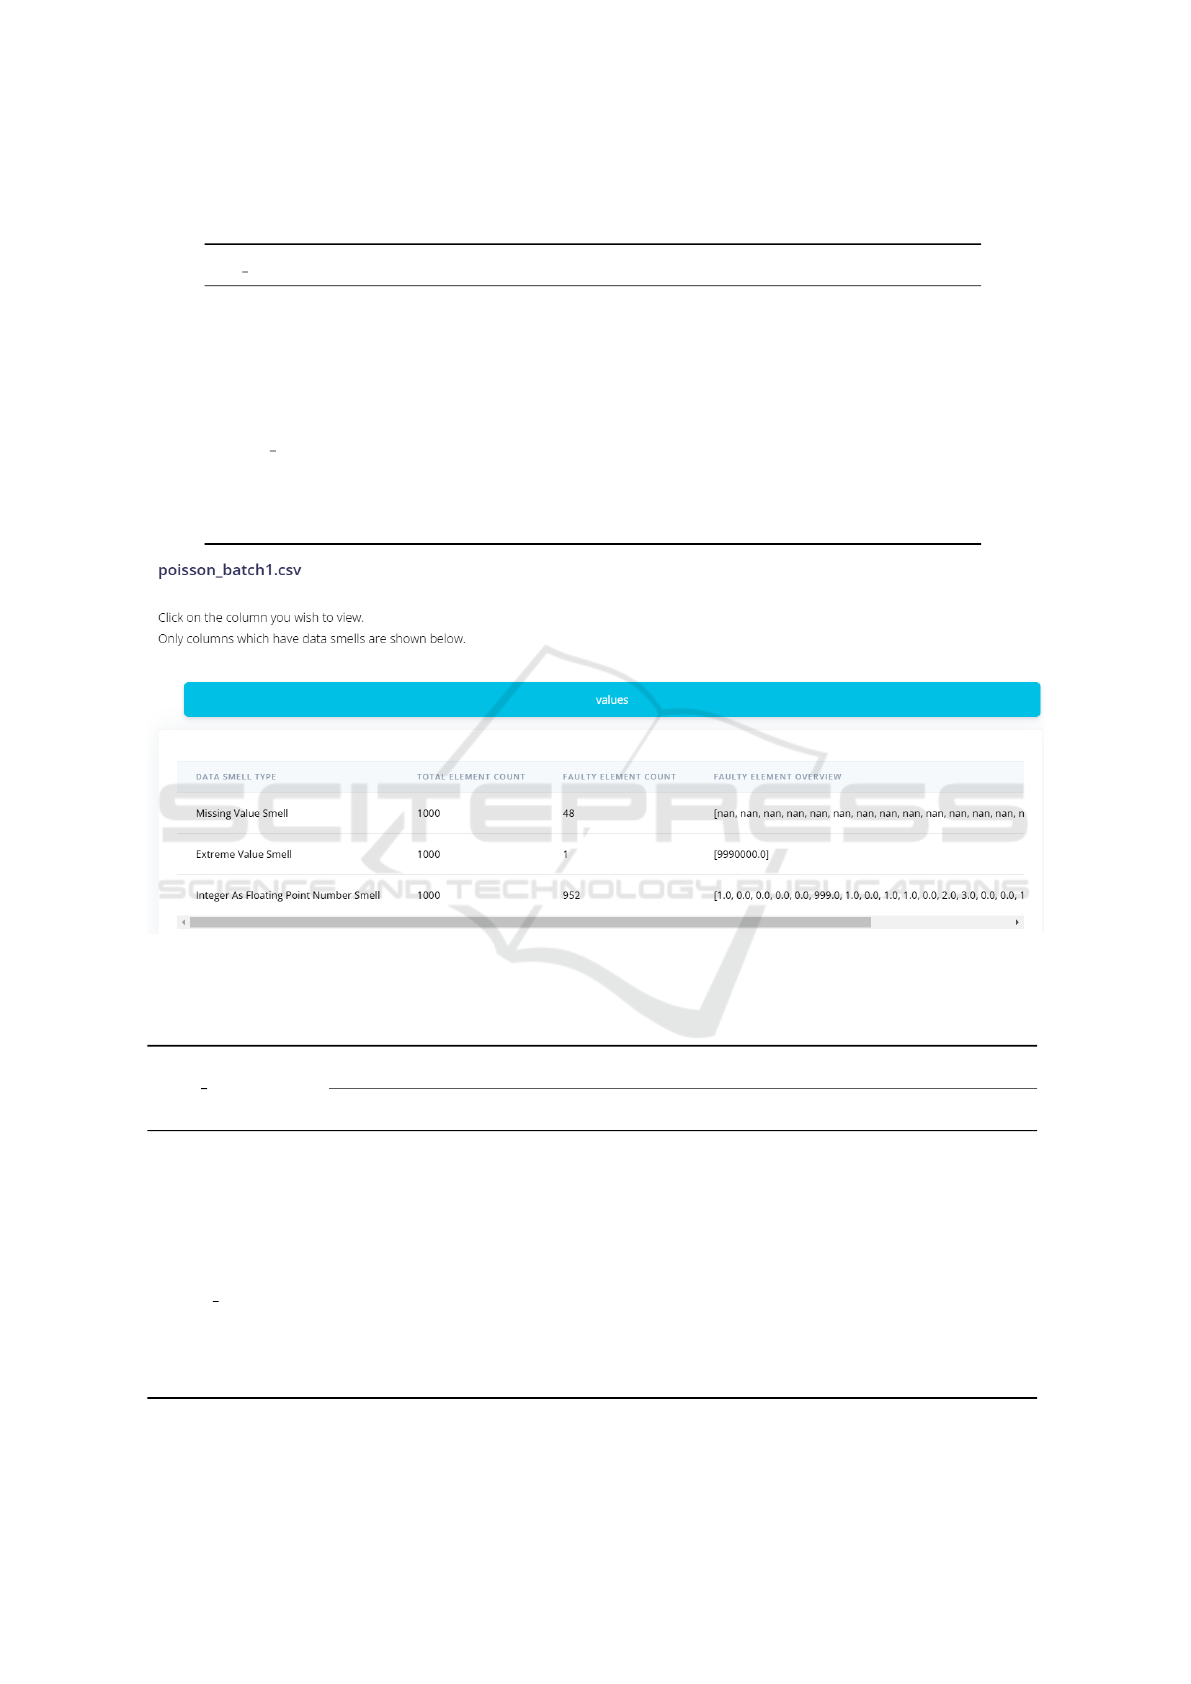
Table 1: Data generated with n = 1, 000 for each batch, with the respective parameter values of the probability distributions.
The frequency of each smell imputed is the same for all the vectors.
prob dist batch params DumVS DupVS SPS IFSS IFS MVS EVS
exponential
1 λ = 1 27 33 39 24 - 48 35
2 λ = 10 27 33 39 24 - 48 35
poisson
1 λ = 1 27 33 - 24 10 48 35
2 λ = 10 27 33 - 24 10 48 35
uniform int
1 a = - 1, b = 1 27 33 - 24 10 48 35
2 a = -10, b = 10 27 33 - 24 10 48 35
uniform
1 a = - 1, b = 1 27 33 39 24 - 48 35
2 a = -10, b = 10 27 33 39 24 - 48 35
Figure 3: Data smells detected by the Rule-Based Data Smell tool on batch 1 of the vector generated by the Poisson distribu-
tion.
Table 2: Results of the detection process for tabular data. For each data smell, we have the incidence imputed (originated
from raw data and detected).
prob dist batch
DumVS DupVS SPS IFSS
imputed detected imputed detected imputed detected imputed detected
exponential
1 27 0 33 0 39 0 24 0
2 27 0 33 0 39 0 24 0
poisson
1 27 0 33 0 - 0 24 0
2 27 0 33 0 - 0 24 0
uniform int
1 27 0 33 0 - 0 24 0
2 27 0 33 0 - 0 0 0
uniform
1 27 0 33 0 39 0 24 0
2 27 0 33 0 39 0 24 0
Data Smells Are Sneaky
485
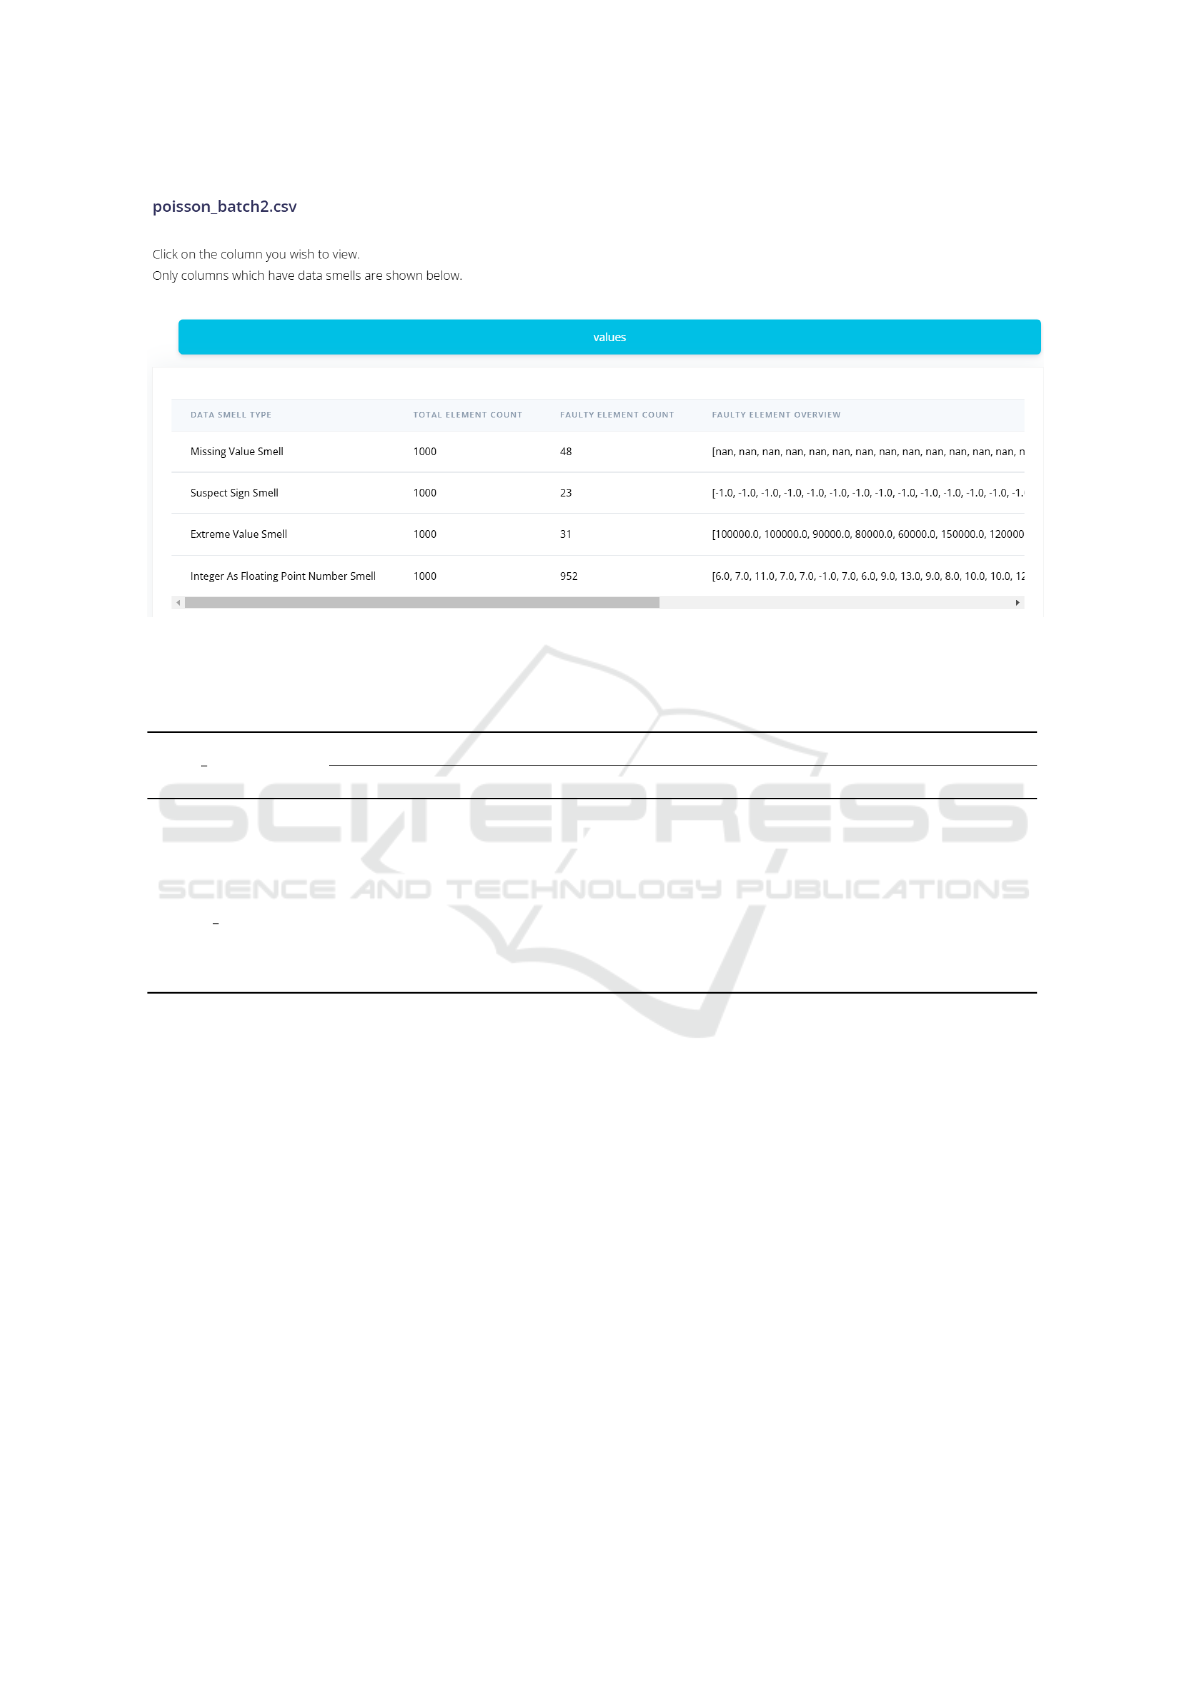
Figure 4: Data smells detected by the Rule-Based Data Smell tool on batch 2 of the vector generated by the Poisson distribu-
tion.
Table 3: Results of the detection process for tabular data. For each data smell, we have the incidence imputed (originated
from raw data and detected).
prob dist batch
IFS MVS EVS SSS
imputed detected imputed detected imputed detected imputed detected
exponential
1 - 0 48 48 35 1 - 0
2 - 0 48 48 35 16 - 23
poisson
1 10 952 48 48 35 1 - 0
2 10 952 48 48 35 31 - 23
uniform int
1 10 952 48 48 35 1 - 0
2 10 952 48 48 35 26 - 0
uniform
1 - 0 48 48 35 1 - 0
2 - 0 48 48 35 24 - 0
6 CONCLUSION
This study provided a comprehensive exploration of
data smells in numerical data, leveraging a controlled
simulation environment to examine their detectabil-
ity across unstructured and structured formats. The
findings reveal significant variability in detection out-
comes, with some smells, such as Missing Value
Smell, being accurately identified, while others, such
as Extreme Value Smell and Integer as Floating-point
Number Smell, differed markedly from the imputed
incidence, with misclassifications or over-detections.
These discrepancies points the challenges inherent in
ensuring data quality within AI pipelines and high-
light the need for more advanced detection mecha-
nisms.
The study’s focus was confined to numerical data
and a few types of data smells, using rule-based detec-
tors. Therefore, it was enough to ilustrate that these
smells are present in our data in both unstructured
and structured format, and, consequently, on differ-
ent stages of a data pipeline. Integrating agile prac-
tices, such as Behavior-Driven Development (BDD),
may facilitate improved collaboration and more effec-
tive identification of data quality issues (Nascimento
et al., 2020).
Future research could expand the scope to include
a broader array of data smells, explore and develop
better detection methods, and investigate other data
types, such as Text and Date/Time. By advancing
these areas, we can better understand and mitigate the
risks posed by data smells, ultimately enhancing the
reliability and quality of data-driven systems. This re-
search contributes to the understanding of data smells
ICEIS 2025 - 27th International Conference on Enterprise Information Systems
486

and their implications, creating opportunities for fu-
ture innovations in data quality assurance.
DATA AVAILABILITY
The scripts used to analyze and generate data, charts,
and tables discussed when addressing our research
goals are publicly available at GitHub: https://github.
com/nmhahn/sneaky smells.
ACKNOWLEDGEMENTS
This paper was supported by the Ministry of Science,
Technology, and Innovations, with resources from
Law No. 8.248, dated October 23, 1991, within the
scope of PPI-SOFTEX, coordinated by Softex, and
published in the Resid
ˆ
encia em TIC 02 - Aditivo, Of-
ficial Gazette 01245.012095/2020-56.
REFERENCES
Abedjan, Z., Chu, X., Deng, D., Fernandez, R. C., Ilyas,
I. F., Ouzzani, M., Papotti, P., Stonebraker, M., and
Tang, N. (2016). Detecting data errors: where are we
and what needs to be done? Proc. VLDB Endow.,
9(12):993–1004.
Batini, C. and Scannapieco, M. (2016). Data and Informa-
tion Quality: Dimensions, Principles and Techniques.
Springer Publishing Company, Incorporated, 1st edi-
tion.
Bayram, F., Ahmed, B. S., Hallin, E., and Engman, A.
(2023). Dqsops: Data quality scoring operations
framework for data-driven applications. In Proceed-
ings of the 27th International Conference on Evalua-
tion and Assessment in Software Engineering, EASE
’23, page 32–41, New York, NY, USA. Association
for Computing Machinery.
Bogner, J., Verdecchia, R., and Gerostathopoulos, I. (2021).
Characterizing technical debt and antipatterns in ai-
based systems: A systematic mapping study. 2021
IEEE/ACM International Conference on Technical
Debt (TechDebt), pages 64–73.
Bosu, M. F. and MacDonell, S. G. (2013). Data quality in
empirical software engineering: a targeted review. In
Proceedings of the 17th International Conference on
Evaluation and Assessment in Software Engineering,
pages 171–176.
Casella, G. and Berger, R. (2001). Statistical Inference.
Duxbury Resource Center, Australia ; Pacific Grove,
CA : Thomson Learning.
Chanin, R., Sales, A., Santos, A. R., Pompermaier, L. B.,
and Prikladnicki, R. (2018). A collaborative ap-
proach to teaching software startups: findings from
a study using challenge based learning. In Sharp,
H., de Souza, C. R. B., Graziotin, D., Levy, M.,
and Socha, D., editors, Proceedings of the 11th In-
ternational Workshop on Cooperative and Human As-
pects of Software Engineering, ICSE 2018, Gothen-
burg, Sweden, May 27 - June 03, 2018, pages 9–12.
ACM.
Ehrlinger, L. and W
¨
oß, W. (2022). A survey of data quality
measurement and monitoring tools. Frontiers in Big
Data, 5.
Elouataoui, W., El Alaoui, I., el Mendili, S., and Youssef,
G. (2022). An advanced big data quality framework
based on weighted metrics. Big Data and Cognitive
Computing, 13.
Foidl, H. and Felderer, M. (2019). Risk-based data valida-
tion in machine learning-based software systems. In
Proceedings of the 3rd ACM SIGSOFT International
Workshop on Machine earning Techniques for Soft-
ware Quality Evaluation, MaLTeSQuE 2019, page
13–18, New York, NY, USA. Association for Com-
puting Machinery.
Foidl, H., Felderer, M., and Ramler, R. (2022). Data smells:
categories, causes and consequences, and detection of
suspicious data in ai-based systems. In Proceedings
of the 1st International Conference on AI Engineer-
ing: Software Engineering for AI, CAIN ’22, page
229–239, New York, NY, USA. Association for Com-
puting Machinery.
Foorthuis, R. (2018). A typology of data anomalies. In
International Conference on Information Processing
and Management of Uncertainty in Knowledge-Based
Systems, pages 26–38. Springer.
Fowler, M. and Beck, K. (1999). Refactoring: Improving
the Design of Existing Code. Addison-Wesley object
technology series. Addison-Wesley.
Golendukhina, V., Foidl, H., Felderer, M., and Ramler, R.
(2022). Preliminary findings on the occurrence and
causes of data smells in a real-world business travel
data processing pipeline. In Proceedings of the 2nd
International Workshop on Software Engineering and
AI for Data Quality in Cyber-Physical Systems/Inter-
net of Things, SEA4DQ 2022, page 18–21, New York,
NY, USA. Association for Computing Machinery.
Gong, L., Jiang, S., and Jiang, L. (2019). Tackling class im-
balance problem in software defect prediction through
cluster-based over-sampling with filtering. IEEE Ac-
cess, 7:145725–145737.
Gray, D., Bowes, D., Davey, N., Sun, Y., and Christian-
son, B. (2011). The misuse of the nasa metrics data
program data sets for automated software defect pre-
diction. volume 2011.
Harris, J. (2014). Distrust your data.
https://source.opennews.org/articles/distrust-your-
data.
Heck, P. (2024). What about the data? a mapping study on
data engineering for ai systems. In Proceedings of the
IEEE/ACM 3rd International Conference on AI En-
gineering - Software Engineering for AI, CAIN ’24,
page 43–52, New York, NY, USA. Association for
Computing Machinery.
Ilyas, I. F. and Chu, X. (2019). Data Cleaning. Association
for Computing Machinery, New York, NY, USA.
Iubel, N. (2014). Ensuring accuracy in data jour-
nalism. https://github.com/nikeiubel/data-
smells/wiki/Ensuring-Accuracy-in-Data-Journalism.
Data Smells Are Sneaky
487

Josko, J. M. B., Ehrlinger, L., and W
¨
oß, W. (2019). To-
wards a knowledge graph to describe and process data
defects. DBKDA 2019, 65.
Kim, W., Choi, B.-J., Hong, E., Kim, S.-K., and Lee, D.
(2003). A taxonomy of dirty data. Data Min. Knowl.
Discov., 7:81–99.
Le Quy, T., Roy, A., Iosifidis, V., Zhang, W., and Ntoutsi, E.
(2022). A survey on datasets for fairness-aware ma-
chine learning. WIREs Data Mining and Knowledge
Discovery, 12(3):e1452.
Li, L., Peng, T., and Kennedy, J. (2011). A rule based tax-
onomy of dirty data. GSTF INTERNATIONAL JOUR-
NAL ON COMPUTING, 1.
Liebchen, G. and Shepperd, M. (2008). Data sets and data
quality in software engineering. Proceedings - Inter-
national Conference on Software Engineering.
Mansouri, T., Moghadam, M. R. S., Monshizadeh, F.,
and Zareravasan, A. (2021). Iot data quality issues
and potential solutions: A literature review. CoRR,
abs/2103.13303.
Melegati, J., Chanin, R., Sales, A., Prikladnicki, R., and
Wang, X. (2020). MVP and experimentation in soft-
ware startups: a qualitative survey. In 46th Euromicro
Conference on Software Engineering and Advanced
Applications, SEAA 2020, Portoroz, Slovenia, August
26-28, 2020, pages 322–325. IEEE.
Melegati, J., Chanin, R., Wang, X., Sales, A., and Prik-
ladnicki, R. (2019). Enablers and inhibitors of ex-
perimentation in early-stage software startups. In
Franch, X., M
¨
annist
¨
o, T., and Mart
´
ınez-Fern
´
andez, S.,
editors, Product-Focused Software Process Improve-
ment - 20th International Conference, PROFES 2019,
Barcelona, Spain, November 27-29, 2019, Proceed-
ings, volume 11915 of Lecture Notes in Computer
Science, pages 554–569. Springer.
Munappy, A., Bosch, J., Olsson, H. H., Arpteg, A., and
Brinne, B. (2019). Data management challenges for
deep learning. In 2019 45th Euromicro Conference
on Software Engineering and Advanced Applications
(SEAA), pages 140–147.
Munappy, A. R., Bosch, J., and Olsson, H. H. (2020). Data
pipeline management in practice: Challenges and op-
portunities. In Product-Focused Software Process Im-
provement: 21st International Conference, PROFES
2020, Turin, Italy, November 25–27, 2020, Proceed-
ings, page 168–184, Berlin, Heidelberg. Springer-
Verlag.
Nascimento, N., Santos, A. R., Sales, A., and Chanin, R.
(2020). Behavior-driven development: A case study
on its impacts on agile development teams. In ICSE
’20: 42nd International Conference on Software En-
gineering, Workshops, Seoul, Republic of Korea, 27
June - 19 July, 2020, pages 109–116. ACM.
Oliveira, P., Rodrigues, F., Rangel Henriques, P., and Gal-
hardas, H. (2005). A taxonomy of data quality prob-
lems. Journal of Data and Information Quality -
JDIQ.
Recupito, G., Pecorelli, F., Catolino, G., Moreschini, S.,
Nucci, D. D., Palomba, F., and Tamburri, D. A.
(2022). A multivocal literature review of mlops tools
and features. In 2022 48th Euromicro Conference
on Software Engineering and Advanced Applications
(SEAA), pages 84–91.
Recupito, G., Rapacciuolo, R., Di Nucci, D., and Palomba,
F. (2024). Unmasking data secrets: An empirical in-
vestigation into data smells and their impact on data
quality. In Proceedings of the IEEE/ACM 3rd Inter-
national Conference on AI Engineering - Software En-
gineering for AI, CAIN ’24, page 53–63, New York,
NY, USA. Association for Computing Machinery.
Roman, D., Pultier, A., Ma, X., Soylu, A., and Ulyashin,
A. G. (2022). Data quality issues in solar panels in-
stallations: a case study. In Proceedings of the 2nd
International Workshop on Software Engineering and
AI for Data Quality in Cyber-Physical Systems/Inter-
net of Things, SEA4DQ 2022, page 24–25, New York,
NY, USA. Association for Computing Machinery.
Santos, J. A. M., Rocha-Junior, J. B., Prates, L.
C. L., Do Nascimento, R. S., Freitas, M. F., and
De Mendonc¸a, M. G. (2018). A systematic review
on the code smell effect. Journal of Systems and Soft-
ware, 144:450–477.
Sato, D., Wider, A., and Windheuser, C. (2019).
Continuous delivery for machine learning.
https://martinfowler.com/articles/cd4ml.html.
Sculley, D., Holt, G., Golovin, D., Davydov, E., Phillips,
T., Ebner, D., Chaudhary, V., Young, M., Crespo, J.-
F., and Dennison, D. (2015). Hidden technical debt in
machine learning systems. In Cortes, C., Lawrence,
N., Lee, D., Sugiyama, M., and Garnett, R., editors,
Advances in Neural Information Processing Systems,
volume 28. Curran Associates, Inc.
Shome, A., Cruz, L., and van Deursen, A. (2022). Data
smells in public datasets. In Proceedings of the 1st In-
ternational Conference on AI Engineering: Software
Engineering for AI, CAIN ’22, page 205–216, New
York, NY, USA. Association for Computing Machin-
ery.
Sukhobok, D., Nikolov, N., and Roman, D. (2017). Tab-
ular data anomaly patterns. In 2017 International
Conference on Big Data Innovations and Applications
(Innovate-Data), pages 25–34.
Ter Hofstede, A. H. M., Koschmider, A., Marrella, A., An-
drews, R., Fischer, D. A., Sadeghianasl, S., Wynn,
M. T., Comuzzi, M., De Weerdt, J., Goel, K., Mar-
tin, N., and Soffer, P. (2023). Process-data quality:
The true frontier of process mining. J. Data and In-
formation Quality, 15(3).
Van Emden, E. and Moonen, L. (2012). Assuring software
quality by code smell detection. In 2012 19th Working
Conference on Reverse Engineering, pages xix–xix.
Citeseer.
Wang, H. and Abraham, Z. (2015). Concept drift detection
for streaming data. In 2015 international joint confer-
ence on neural networks (IJCNN), pages 1–9. IEEE.
Yoon, K.-A. and Bae, D.-H. (2010). A pattern-based out-
lier detection method identifying abnormal attributes
in software project data. Information and Software
Technology, 52(2):137–151.
Zhang, H., Cruz, L., and Van Deursen, A. (2022). Code
smells for machine learning applications. In Proceed-
ings of the 1st international conference on AI engi-
neering: software engineering for AI, pages 217–228.
ICEIS 2025 - 27th International Conference on Enterprise Information Systems
488
