
A Systematic Literature Review of Adaptive Collaborative Systems
Based on Dashboards
Kaouther Soltani, Nadia Hocine
a
and Karim Sehaba
b
CSTL laboratory, University of Mostaganem, Av. Hamadou Hossine, Mostaganem, Algeria
Keywords:
Dashboards, Computer-Supported Collaborative Learning, Learning Analytics, Adaptation.
Abstract:
Collaborative learning plays an important role in improving individuals’ critical 21st century skills including
teamwork, creativity, and critical thinking. Research studies in computer-supported collaborative learning
relied on multiple technologies and analytics methods to analyze team members’ interaction with the learning
system. They generally seek to assess and support collaborative learning and aid instructors to orchestrate
the classroom in co-located collaboration group settings. To enhance awareness among students and teachers
about collaboration, learning systems often offer dashboards with visual presentations of educational data and
collaborative work progress. Despite the growing research interest on adapting the systems for collaborative
learning support, only a few studies investigated how dashboards can be adapted to improve students’ learning
and collaboration skills. This paper systematically reviewed research studies on adaptive learning systems
based on dashboards, following the PRISMA protocol. The objective is to examine the role of dashboards
in customizing learning systems and enhancing collaborative learning and teaching. This could pave the way
for research opportunities in designing and developing future adaptive dashboards that foster collaborative
learning.
1 INTRODUCTION
Collaborative learning refers to methods where a
group of two or more students work together to per-
form tasks or solve problems in order to achieve a
common objective (Lipponen, 2002). In addition to
knowledge acquisition, collaborative learning helps
students acquire multiple teamwork and collabora-
tion skills. Many research studies in Computer-
Supported Collaborative Learning (CSCL) suggested
learning systems to support for instance communica-
tion, group awareness, and group monitoring. They
employed various methods, such as learning analyt-
ics, multimodal analytics, social network analysis,
and process mining, to examine behavioral patterns
by analyzing interaction data of group members with
the learning system. These methods often seek to help
both students and teachers understand the collabora-
tion process and assess the learning performance (Liu
and Nesbit, 2020).
Recent studies in CSCL have focused on identi-
fying the most relevant high-level constructs of edu-
a
https://orcid.org/0000-0001-7875-1064
b
https://orcid.org/0000-0002-6541-1877
cational and interaction data, also named indicators,
that can inform actionable insights (Jorno and Gyn-
ther, 2018). This consists for instance in providing
students with adaptive feedback and recommending
activities that can improve their reflection and group
awareness (Worsley et al., 2021). These indicators
were also used recently to support teachers in class-
room orchestration, especially in co-located collab-
oration group settings. However, interpreting these
indicators in real-time and using them to make deci-
sions can be challenging for both students and teach-
ers. This difficulty stems from the volume of real-time
data and indicators, which may not always align with
the needs of students and teachers during the collabo-
ration process.
Various learning systems emphasize dashboards
that are used to report and visually present relevant
collaborative learning indicators, using for instance
tables, network graphs, and bar charts. They provide
stakeholders with real-time feedback on students’
progress, performance, and group dynamics (Lippo-
nen, 2002). However, only a few studies dealt with
the adaptation of learning dashboards to meet stu-
dents and teachers needs along the collaboration pro-
cess. In fact, the real-time adaptation of dashboards
392
Soltani, K., Hocine, N. and Sehaba, K.
A Systematic Literature Review of Adaptive Collaborative Systems Based on Dashboards.
DOI: 10.5220/0013286300003932
In Proceedings of the 17th International Conference on Computer Supported Education (CSEDU 2025) - Volume 1, pages 392-399
ISBN: 978-989-758-746-7; ISSN: 2184-5026
Copyright © 2025 by Paper published under CC license (CC BY-NC-ND 4.0)
have shown promise in improving group awareness
and supporting teachers’ interventions (Amarasinghe
et al., 2021; Zamecnik et al., 2022).
The present review aims to study the adaptation
techniques and the role of dashboards in adaptive
learning systems that support collaborative learning.
Adaptation in this paper refers to the process of tailor-
ing the learning system content, feedback and inter-
face without the direct intervention of a human. Our
first research question is: RQ1. How have adaptive
learning systems based on dashboards contributed
to improving collaborative learning and classroom
orchestration?. We are also interested in the role
of dashboards in adapting the learning system. Our
second research question is: RQ2. How have dash-
boards been utilized to provide adaptive support
for collaborative learning?
This paper is organized as follows: In section
2, we introduce the review methodology. Section 3
presents the results of the review by answering the
previous research questions. Section 4 discusses the
obtained results and presents some opportunities to
advance research in adaptive systems based on dash-
boards.
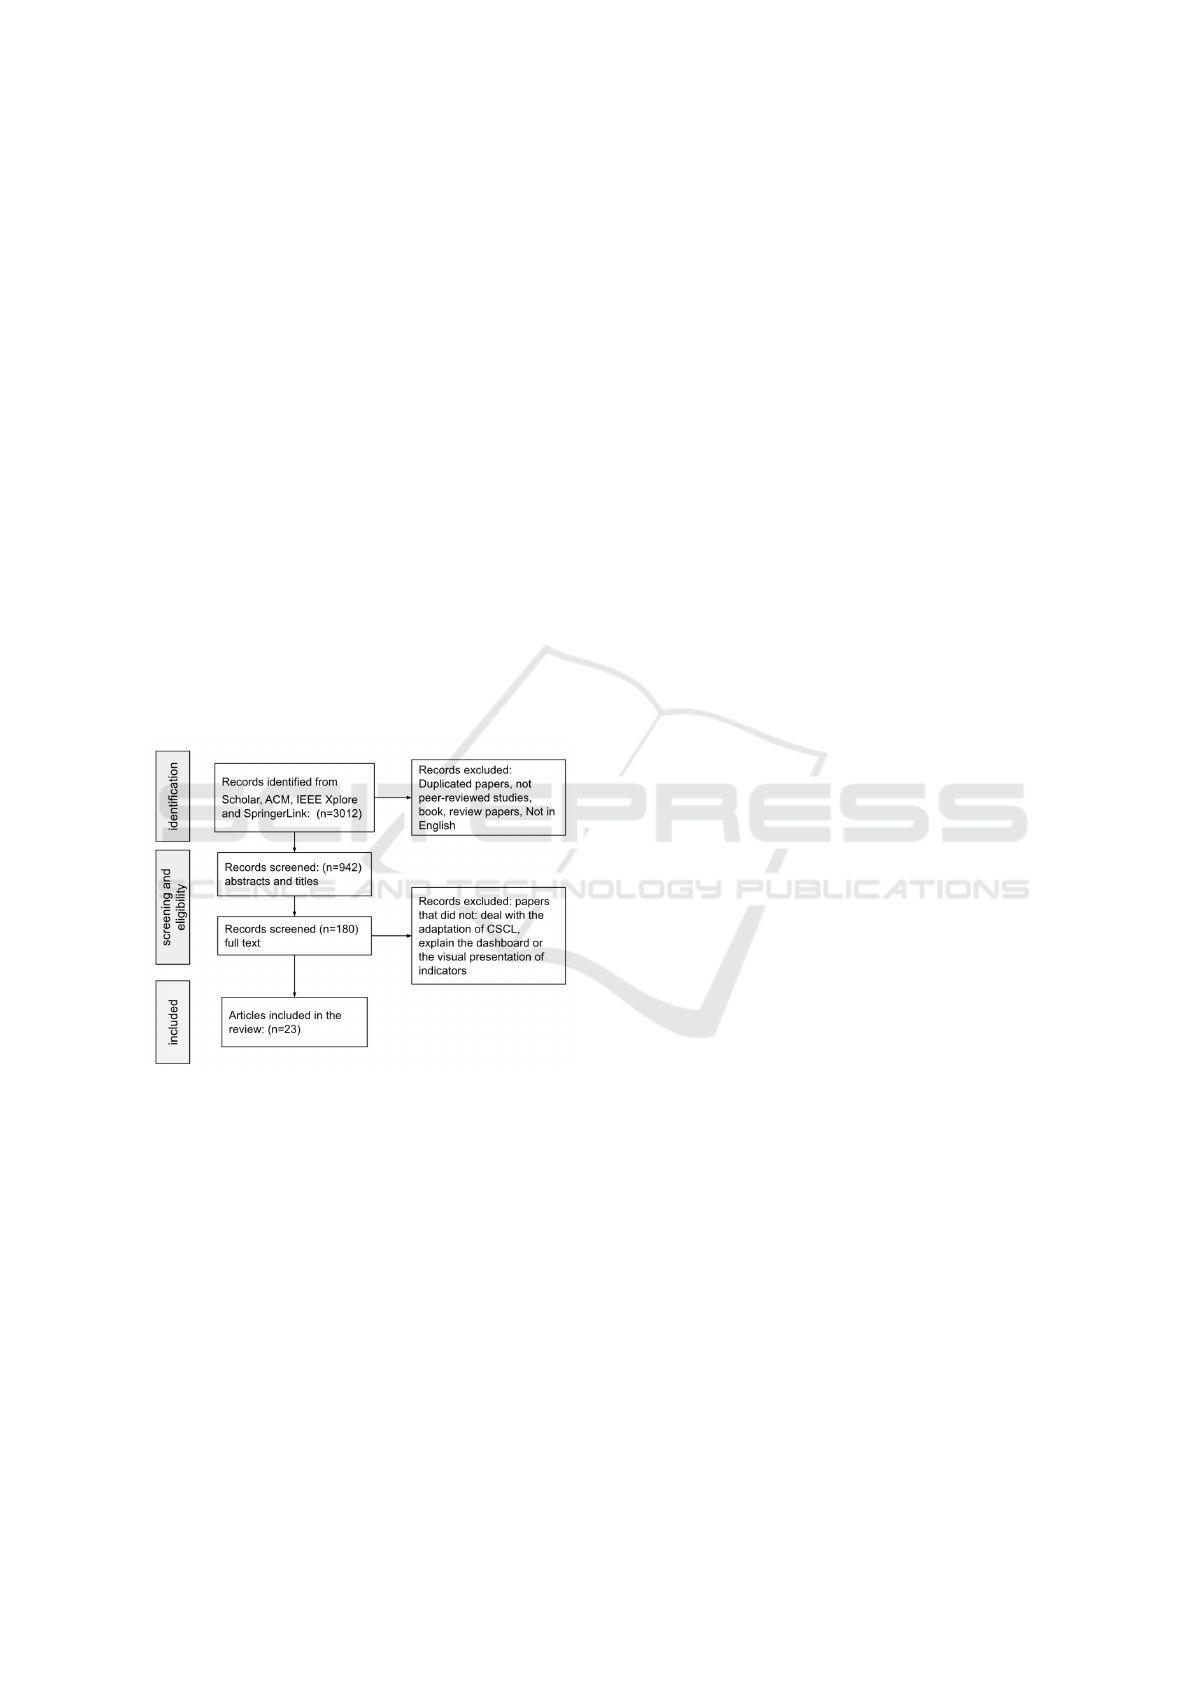
Figure 1: PRISMA paper selection process.
2 METHODOLOGY
The research methodology of the systematic review
is in accordance with PRISMA protocol that pro-
vides guidance for the reporting of systematic re-
views (Page et al., 2021). We followed the key steps
of this protocol, including: searching papers using
databases, screening the title and abstract of the pa-
pers to select eligible ones following exclusion and
inclusion criteria, and reviewing the full texts of the
most relevant papers. 23 research papers were found
relevant to our research questions and were included
in this review.
The general search process is shown in Figure
1. After formulating the research questions, we con-
ducted a search to select and analyze relevant articles
using inclusion and exclusion criteria. The search fo-
cused on different databases that are: IEEE-Xplore,
Springer, ACM digital library, and Google Scholar.
The general search query was: (adapt* OR personal*)
AND (”computer supported collaborative learning”
OR CSCL) AND (dashboard OR orchestr*). We
searched for the keywords in the title, abstract, and
keywords of the studies. Then, we skimmed inclusion
and analysis criteria to determine whether the papers
are eligible for our study.
We selected only papers published between 2017
and 2024 that are written in English. On the basis of
the title and the abstract, only articles that suggested
adaptive learning systems based on dashboards were
included. CSCL environments that rely on authoring
tools or adaptability (manual configuration of the sys-
tem) were excluded. We also considered the type of
articles as we excluded books, review papers, reports,
and papers that are not peer-reviewed. Additionally,
research studies that have not evaluated adaptive sys-
tems have been excluded, as they do not address our
research questions. We then read the full text of the
resulting papers to extract data following our analysis
criteria to answer our research questions.
To answer the first research question RQ1, we
have defined two analysis criteria:
• User Targets: we examine the stakeholders who
use the dashboard and for whom the system is
adapted.
• Study Results: this criterion investigates the ef-
fect of adaptive learning systems based on dash-
boards on collaborative learning and teaching.
We also defined the following two criteria to an-
swer the second research question RQ2.
• Adaptation Techniques: we are interested in the
adaptation techniques and how dashboards are in-
corporated into the adaptation process.
• Collaborative Work Indicators: we consider
quantitative measures of interaction data used to
assess the collaborative work as well as their vi-
sual presentation in the dashboard.
We identified 23 research papers that were rele-
vant to our research questions. The review results
indicate three kinds of dashboards that have been
utilized in adaptive systems for collaborative learn-
ing support: Learning Analytics Dashboards (LAD),
Multimodal Dashboards (MD), as well as Orchestra-
tion Dashboards (OD). In addition to LAD, which
provides students and teachers with visual presenta-
tions of learning analytics results, recent studies have
A Systematic Literature Review of Adaptive Collaborative Systems Based on Dashboards
393

suggested orchestration dashboards specifically de-
signed to monitor classrooms in co-located collabo-
ration. Furthermore, with the development of new in-
put sources of data, such as sensor data, audio and
video recording of students’ collaborative activities,
recent studies suggested adaptive multimodal dash-
boards. The latter is intended to help students obtain
meaningful indicators about their learning status and
collaboration process from the massive data generated
during their interactions with the learning system.
The objective of adaptive learning systems based
on dashboards was generally to improve students’
knowledge building (Yang et al., 2023), self-
regulation (Sedrakyan et al., 2020), teamwork skills
(Lin et al., 2018), and learning outcomes (Han et al.,
2021; Zamecnik et al., 2022). They also seek to pro-
vide teachers with adaptive support in orchestrating
teams and identifying students who need assistance
(Yang et al., 2023). The target users of the dashboards
were the students (the number of papers n=10) and
the instructors or teachers (n=10). Only in some re-
cent studies, the stakeholders were both students and
teachers. Teachers-facing dashboards have recently
emerged as a relevant tool to support instructors in su-
pervising and monitoring group members’ collabora-
tion process, track learning progress, and make deci-
sions to improve classroom orchestration (Echeverria
et al., 2023; Olsen et al., 2021).
As for students-facing dashboards, they were of-
ten designed to help students visualize their own per-
formance, learning status, team progress, and receive
feedback on their collaboration efforts (Sedrakyan
et al., 2020; Zamecnik et al., 2022). They have also
been used to monitor task distribution among team
members and maintain their shared understanding of
tasks (Han et al., 2021). Further, students-facing
dashboards have been employed to communicate with
instructors and ask help in the case of conflicting sit-
uations (Hadyaoui and Cheniti-Belcadhi, 2023).
2.1 Study Results
Table 1 summarizes the methods and main find-
ings of the research studies. The result of the re-
view shows that adaptive learning systems based on
dashboards generally have a positive impact on stu-
dents’ learning outcomes (Edson and Phillips, 2021;
Silva et al., 2023), team performance (Hadyaoui
and Cheniti-Belcadhi, 2023), reflection (Echeverria
et al., 2017) and social skills (Praharaj et al., 2022).
Teacher-facing dashboards were also found effec-
tive in supporting teachers’ intervention (Edson and
Phillips, 2021; Fernandez-Nieto et al., 2024), en-
hancing the learning content (Kaliisa and Dolonen,
2023), improving orchestration actions (Amarasinghe
et al., 2021), and reflection on orchestration strategies
(Olsen et al., 2021; Yang et al., 2022).
Many studies have investigated the effect of dash-
boards on collaborative learning and teaching (n=10).
Usability studies and comparisons between systems
with and without dashboards have helped identify the
role of dashboards in customizing and supporting col-
laborative learning and teaching. Studies showed the
usefulness and efficiency of adaptive dashboards in
supporting teams’ reflection on their actions (Ama-
rasinghe et al., 2020; Echeverria et al., 2017), par-
ticipation, and learning outcomes (Han et al., 2021).
They were also found useful for classroom orches-
tration to improve teacher awareness about team pro-
gression and collaboration issues (Yang et al., 2023)
and to support their interventions (Amarasinghe et al.,
2021; Edson and Phillips, 2021). Some studies also
studied students’ interaction with the dashboard and
distinguished engagement patterns (Zamecnik et al.,
2022) that can be used to improve the learning system
adaptation.
2.2 Adaptation Techniques
Adaptive learning systems utilizing dashboards em-
ployed various adaptation techniques. Table 2 de-
scribes how the learning systems in the studies have
been adapted. Learning systems often depend on
real-time adaptive feedback via the dashboard (n=10).
Adaptive feedback was suggested to assist team mem-
bers who did not meet learning objectives (Ser-
rano Iglesias et al., 2021; Zamecnik et al., 2022)
and to improve students’ social interaction (Hadyaoui
and Cheniti-Belcadhi, 2023; Praharaj et al., 2022)
and awareness of their learning progress (Aldosemani
and Al Khateeb, 2022). It has also been provided
to teachers in order, for example, to identify groups
that need support (Han et al., 2021). In some studies,
adaptive cognitive and reflective feedback was intro-
duced outside of the dashboard to regulate the stu-
dents’ behaviors (Sedrakyan et al., 2020; Zamecnik
et al., 2022) and to improve their self-regulation and
reflective skills (Edson and Phillips, 2021).
Research studies dealing with adaptive support to
teachers were generally focused on Artificial Intel-
ligence (AI) based co-orchestration strategies (n=6)
as well as group formation support (n=3). Teacher-
facing dashboards were often developed for the co-
orchestration of the classroom in co-located collabo-
ration group settings. Some studies suggested group
formation on the basis of the analysis of students’
progress and learning performance (Olsen et al.,
2021; Yang et al., 2021). Recent studies were in-
CSEDU 2025 - 17th International Conference on Computer Supported Education
394

Table 1: Research studies methods and findings.
Paper Research method Study findings
Learning analytics dashboards
(Lin et al., 2018)
Post study questionnaires, interactive visual analysis,
and a post-test
Improved learning achievement and interest as well as
visualizations usefulness
(Sedrakyan et al., 2020) A case study of dashboard visualizations Design recommendations
(Edson and Phillips, 2021) Observation and structured interviews with teachers
The effectiveness of the dashboard in supporting
teachers’ intervention and improving learning outcomes
(Han et al., 2021)
Experiment to compare system using a LAD with
a system without LAD
The dashboards improved students participation and
argumentation outcomes
(Zamecnik et al., 2022)
Quantitative analysis of logs and qualitative analysis
of students’ perceptions of the usefulness of the LAD
using surveys and focus groups
Different roles within teams have distinguished
engagement patterns with the LAD, team leaders are
actively more engaged with visualizations
(Aldosemani and Al Khateeb, 2022)
A design framework with examples of adaptive
feedback
Design recommendations and adaptation challenges
(Hadyaoui and Cheniti-Belcadhi, 2023)
Pre-post tests of students learning, evaluation of
predictive modeling approach
A positive impact of intra-group interactions on team
performance
(Kaliisa and Dolonen, 2023) Post study interviews with teachers
The dashboard usefulness and efficiency in monitoring
the learning designs
(Silva et al., 2023)
A single-blind randomized controlled trial on the basis of
logs and questionnaires to compare adaptive systems
with a control condition
Adaptive scaffolds improved students course grades but
without a significant impact on self-regulation skills
(Fernandez-Nieto et al., 2024)
A qualitative validation study using a retrospective
reflection technique
Teachers satisfaction of the automated feedback and the
generation of data stories that support student reflection
Orchestration dashboards
(Martinez-Maldonado, 2019)
Post-study semi-structured interviews and
questionnaires with teachers to evaluate the usefulness
of the dashboard
Highlighted the teachers perspectives and issues:
incompleteness of classroom data, feedback delay and
the orchestration load
(Amarasinghe et al., 2020)
Experiment to validate the orchestration dashboard
by analyzing logs data, video recording of experiment,
and questionnaires
Meaningfulness of dashboard data and usefulness to
support teams
(Amarasinghe et al., 2021)
A within-subject design to evaluate three conditions:
personalized guidance, mirroring, and control
condition (without dashboard)
The personalized guidance helped teachers to perform
more orchestration actions
(Olsen et al., 2021)
Short interviews with teachers’ to evaluate the
orchestration support and thematic analysis of
discourses
Improved teachers reflection on orchestration strategies
and usefulness of AI support
(Yang et al., 2021)
Simulation of teaming configurations to evaluate the
effectiveness and feasibility of dynamic group
formation policies
A trade-off between the required knowledge
heterogeneity and policy feasibility and a need for
policies customization
(Yang et al., 2022)
Usability of the system by analyzing log data and
observation
Teachers were able to manage the dynamic transitions
and valued them
(Lawrence et al., 2022)
Observation of collaborative co-design sessions with
the teacher and semi-structured interviews
Teachers preferred shared control with AI in pairing
students
(Echeverria et al., 2023)
Workshop with student and teachers to discuss their
experience through semi structured interview
The need for an hybrid control of the system by students
and teachers and improve system adaptation
(Yang et al., 2023) Post-study structured interviews and questionnaires Usefulness of the orchestration tool
(Lawrence et al., 2024)
An in-person Wizard-of-Oz probe study, semi-
structured interviews, and analysis of students
discourse transcripts
Co-orchestration facilitated the transitions between
individual and collaborative learning
Multimodal dashboards
(Echeverria et al., 2017)
Post-study questionnaire and semi-structured
interviews
The dashboard improved students post-hoc productive
reflection about their activity
(Serrano Iglesias et al., 2021) A use case of the integration of the system
A scenario to deploy and adopt MD in smart learning
environments
(Praharaj et al., 2022) Post-study analysis of team discourses and logs
Positive impact of role-role interactions on group’s
collaboration task
tended to support teachers in monitoring transitions
between individual and collaborative activities. These
studies usually employed intelligent tutoring systems
that considered students’ performance to make de-
cisions about their learning modes. The dashboard
played an important role in presenting the students’
learning states and enabling rapid intervention by the
instructor (Echeverria et al., 2023; Yang et al., 2023).
Visual presentations of indicators in the dash-
boards were also identified as a target of adapta-
tion in some research studies (n=5). Adaptive dash-
boards were designed to summarize group indica-
tors and discover hidden patterns from interaction
data (Martinez-Maldonado, 2019), aiding in visu-
alizing indicators of learning progress (Han et al.,
2021), participation, and social interaction in real-
time (Kaliisa and Dolonen, 2023). Other studies
have suggested network graphs with adaptive pre-
sentations that follow users’ exploration of epistemic
and social dimensions of group interaction (Echever-
A Systematic Literature Review of Adaptive Collaborative Systems Based on Dashboards
395

Table 2: The adaptation techniques.
Adaptation technique Description Paper
Adaptive feedback Adaptive cognitive and reflective feedback (Lin et al., 2018) (Fernandez-Nieto et al., 2024)
LAD with adaptive feedback to support team members who
did not meet requirements
(Zamecnik et al., 2022) (Serrano Iglesias et al., 2021)
Adaptive feedback through a dashboard to improve students
social interaction
(Hadyaoui and Cheniti-Belcadhi, 2023) (Praharaj et al., 2022)
Adaptive feedback based on regulation process phases
(cognitive and meta-cognitive feedback)
(Sedrakyan et al., 2020)
Real-time feedback to improve students thinking (Edson and Phillips, 2021)
Adaptive feedback for teachers to identify groups that need
help in real time using LAD
(Han et al., 2021)
Adaptive dashboard based on feedback on students’ level of
learning loss, preferences and instructional needs.
(Aldosemani and Al Khateeb, 2022)
Intelligent virtual tutor to
support classroom orchestration
AI-based orchestration tool that supports dynamic transitions
between individual and collaborative learning activities in the
classroom
(Yang et al., 2022) (Yang et al., 2021)
(Lawrence et al., 2022) (Echeverria et al., 2023)
(Yang et al., 2023)
AI co-orchestration tool using an adaptive tutoring system (Lawrence et al., 2024)
Adaptive visual presentations
of indicators
A radar chart for patterns of each label representing essential
elements of written argumentation
(Han et al., 2021)
Adaptive visual presentations of indicators about students
participation and social interaction in real-time
(Kaliisa and Dolonen, 2023)
Personalized dashboard with data storytelling elements (Fernandez-Nieto et al., 2024)
Adaptive visualization that summarizes group indicators and
to discover hidden patterns from interaction data
(Martinez-Maldonado, 2019)
Multimodal analytics dashboard with adaptive visualizations
(graphs) about epistemic and social aspects of collaboration
(Echeverria et al., 2017)
Adaptive scaffolds: guidance,
prompts, and hints
Adaptive guidance and different types of prompts (Lin et al., 2018) (Echeverria et al., 2023)
guide students through a regulatory support (scaffolds) and
tips that depends log data
(Silva et al., 2023)
Dashboard to guide orchestration based on Epistemic Network
Analysis and an alerting mechanism that fagged critical
moments in collaboration
(Amarasinghe et al., 2021)
Adaptive collaboration and
orchestration scripts
A teacher-facing dashboard that supports teachers in
orchestrating scripted collaboration
(Amarasinghe et al., 2020)
Adaptive collaboration scripts (Han et al., 2021)
Human-AI collaboration for
group formation
Human-AI collaboration to orchestrate the classroom and
support students who are struggling with an individual
activity by pairing them with other students
(Olsen et al., 2021) (Yang et al., 2023)
Dynamic group formation using various pairing policies (Yang et al., 2021)
ria et al., 2017). Recently, research has relied on sto-
rytelling techniques to summarize team progression
data (Fernandez-Nieto et al., 2024).
Finally, some studies put forward scaffolding or
collaboration scripts (n=6) based on guidance and
different types of prompts (Echeverria et al., 2023;
Lin et al., 2018). However, only a few studies have
integrated the scaffolds in the dashboard. For in-
stance, Amarasinghe, Ishari and colleagues devel-
oped an adaptive dashboard utilizing epistemic net-
work analysis to guide orchestration, alongside an
alert system highlighting critical collaboration mo-
ments (Amarasinghe et al., 2021).
2.3 Collaborative Work Indicators
Research studies were based on different quantitative
measures related to learning context and objectives
(see Figure 2). A wide range of studies investigated
team members’ participation in learning activities and
discussion forums to measure their engagement in
the collaborative work (Han et al., 2021; Kaliisa and
Figure 2: Collaborative work indicators.
CSEDU 2025 - 17th International Conference on Computer Supported Education
396

Dolonen, 2023). Other studies considered epistemic
aspects of collaboration, including team members’
individual performance (Edson and Phillips, 2021;
Olsen et al., 2021), learning progress (Lawrence et al.,
2022), and their contribution to the knowledge con-
struction (Hadyaoui and Cheniti-Belcadhi, 2023; Se-
drakyan et al., 2020). Only a few studies introduced
a quantitative measure of collaboration quality on the
basis of the analysis of students’ interaction with the
learning system (Han et al., 2021; Praharaj et al.,
2022) and the communication between team members
(Fernandez-Nieto et al., 2024; Silva et al., 2023).
Collaborative work indicators were generally pro-
vided to users through the dashboard using different
visual presentation techniques. In particular, network
graphs have been adopted by many recent studies as
they have the potential to visualize both the epistemic
and social dimensions of the interaction between team
members (Amarasinghe et al., 2021; Zamecnik et al.,
2022). Furthermore, simple shapes such as circles and
triangles with different sizes and colors (Aldosemani
and Al Khateeb, 2022; Silva et al., 2023), progress
bars (Silva et al., 2023), as well as tables were used to
highlight indicators of students’ progression, perfor-
mance, and contribution (Amarasinghe et al., 2020;
Echeverria et al., 2023). Other studies suggested dif-
ferent types of charts, including bar graphs (Aldose-
mani and Al Khateeb, 2022; Hadyaoui and Cheniti-
Belcadhi, 2023) and radar charts (Han et al., 2021).
3 DISCUSSION
Collaborative learning offers the opportunity to de-
velop teamwork and communication skills. However,
students may vary in terms of their prior knowledge,
engagement, and social skills, which can impact their
ability to work in a group. The review highlighted the
role of dashboards in adaptive learning systems that
can aid team reflection and improve participation and
learning outcomes (Amarasinghe et al., 2020; Echev-
erria et al., 2017; Han et al., 2021). Dashboards can
be also valuable for orchestrating classrooms, enhanc-
ing teacher awareness of team progress and collabo-
ration issues (Yang et al., 2023), and facilitating tar-
geted interventions (Amarasinghe et al., 2021; Fran-
cillette et al., 2012).
Adaptive learning systems using dashboards of-
ten emphasize real-time adaptive feedback and scaf-
folding based on prompts and hints (Hadyaoui and
Cheniti-Belcadhi, 2023; Serrano Iglesias et al., 2021).
However, some studies have not integrated feedback
and scaffolding into the dashboard. Limiting the role
of dashboards in adaptive scaffolding and collabora-
tion scripts can be attributed to the level of user con-
trol within the system and the objectives of the adap-
tation strategy (Brusilovsky, 2024). This strategy may
aim to either guide students or enhance their self-
regulation skills by reducing intervention from teach-
ers or the system and fostering reflective learning. In
fact, it is still challenging to determine how and when
to adapt collaborative learning support based on the
targeted skills of students to enhance their learning
and skills.
Other research studies were based on the adapta-
tion of the dashboard by selecting relevant indicators
of epistemic and social aspects of collaboration. In
addition to statistics charts, network graphs have been
adopted by many recent studies as they have the po-
tential to visualize different dimensions of the inter-
action between team members (Amarasinghe et al.,
2021; Zamecnik et al., 2022). However, there is a lack
of studies that examine the impact of visual presenta-
tions in the dashboard on the behavior and engage-
ment of students and teachers. Furthermore, dash-
boards in most cases were designed for specific learn-
ing contexts, presenting students with indicators of
their collaborative work without explaining how these
indicators could help them enhance their collaborative
learning.
A growing research interest has recently been de-
voted to improving the meaningfulness and explain-
ability of data and their visual presentations in the
dashboard. Recent studies focused for instance on
game-based strategies such as storytelling to summa-
rize team progression data (Fernandez-Nieto et al.,
2024). Research opportunities in this area can fo-
cus on developing dashboards that fulfill the needs
of learners and teachers during collaboration. These
dashboards should offer meaningful indicators and
explanations of their utility in enhancing learning out-
comes and skills.
Finally, teacher-facing dashboards in adaptive
learning systems generally focus on supporting teach-
ers in group formation and managing the learning
workflow, especially in scenarios combining individ-
ual and collaborative learning (Echeverria et al., 2023;
Yang et al., 2023). The system usually recommended
orchestration strategies while leaving control to the
teacher, potentially leading to overload when man-
aging multiple interventions in co-located collabora-
tion group settings (Amarasinghe et al., 2021; Hakami
et al., 2024). Future research studies should consider
designing and evaluating dashboards that incorporate
teachers’ orchestration and pedagogical strategies to
reduce the cognitive load associated with classroom
monitoring (Hocine et al., 2019).
A Systematic Literature Review of Adaptive Collaborative Systems Based on Dashboards
397

4 CONCLUSIONS
In this paper, we reviewed adaptive learning systems
based on dashboards that are designed to support col-
laborative learning and teaching. The results have
shown the potential of the dashboards in helping stu-
dents to improve their learning and to assist teach-
ers to monitor their classes. However, the adaptation
of dashboards to students and teachers needs is still
limited and more research studies should investigate
how to personalize the dashboard according to, for
instance students’ learning needs, as well as teachers
orchestration and pedagogical strategies. Moreover,
future research opportunities can deal with AI tech-
niques to support the analysis of students’ collabora-
tion issues and their assistance through the dashboard.
Finally, although the review provides insights of
the use of dashboards in CSCL, it has some limita-
tions. We focused solely on peer-reviewed studies of
adaptive learning systems to explore the role of dash-
boards. The search databases were limited because of
some access limitations. We reviewed only studies on
collaborative learning in education, excluding those
on professional development and cooperative learning
systems. Finally, future meta-reviews of dashboards
in adaptive and non-adaptive systems can facilitate
comparative analysis of study findings and assess the
impact of dashboards on learning outcomes as well as
teaching practices and strategies.
ACKNOWLEDGMENT
This research is funded by a research and train-
ing project [PRFU, C00L07UN270120230005,
2022/2023 to 2027] on the co-design and adaptation
of collaborative learning systems.
REFERENCES
Aldosemani, T. I. and Al Khateeb, A. (2022). Learning
loss recovery dashboard: A proposed design to miti-
gate learning loss post schools closure. Sustainability,
14(10):5944.
Amarasinghe, I., Hern
´
andez-Leo, D., Michos, K., and Vu-
jovic, M. (2020). An actionable orchestration dash-
board to enhance collaboration in the classroom. IEEE
Transactions on Learning Technologies, 13(4):662–
675.
Amarasinghe, I., Hern
´
andez-Leo, D., and Ulrich Hoppe, H.
(2021). Deconstructing orchestration load: comparing
teacher support through mirroring and guiding. Inter-
national Journal of Computer-Supported Collabora-
tive Learning, 16(3):307–338.
Brusilovsky, P. (2024). Ai in education, learner control, and
human-ai collaboration. International Journal of Ar-
tificial Intelligence in Education, 34(1):122–135.
Echeverria, V., Martinez-Maldonado, R., Chiluiza, K., and
Buckingham Shum, S. (2017). Dbcollab: Automated
feedback for face-to-face group database design. In
for Computers in Education, A.-P. S., editor, Proceed-
ings of the 25th International Conference on Com-
puters in Education, ICCE 2017, Christchurch, New
Zealand, pages 56–165. ACM Press.
Echeverria, V., Yang, K., Lawrence, L., Rummel, N., and
Aleven, V. (2023). Designing hybrid human–ai or-
chestration tools for individual and collaborative ac-
tivities: A technology probe study. IEEE Transactions
on Learning Technologies, 16(2):191–205.
Edson, A. J. and Phillips, E. D. (2021). Connecting a
teacher dashboard to a student digital collaborative en-
vironment: Supporting teacher enactment of problem-
based mathematics curriculum. ZDM–Mathematics
Education, 53(6):1285–1298.
Fernandez-Nieto, G. M., Martinez-Maldonado, R., Echev-
erria, V., Kitto, K., Ga
ˇ
sevi
´
c, D., and Bucking-
ham Shum, S. (2024). Data storytelling editor: A
teacher-centred tool for customising learning analyt-
ics dashboard narratives. In Proceedings of the 14th
Learning Analytics and Knowledge Conference, LAK
2024, Kyoto, Japan, pages 678–689.
Francillette, Y., Goua
¨
ıch, A., Hocine, N., and Pons, J.
(2012). A gameplay loops formal language. In 2012
17th International Conference on Computer Games
(CGAMES), pages 94–101.
Hadyaoui, A. and Cheniti-Belcadhi, L. (2023). Ontology-
based group assessment analytics framework for per-
formances prediction in project-based collaborative
learning. Smart Learning Environments, 10(1):43.
Hakami, L., Hern
´
andez-Leo, D., Amarasinghe, I., and
Sayis, B. (2024). Investigating teacher orchestration
load in scripted cscl: A multimodal data analysis per-
spective. British Journal of Educational Technology.
Han, J., Kim, K. H., Rhee, W., and Cho, Y. H. (2021).
Learning analytics dashboards for adaptive support in
face-to-face collaborative argumentation. Computers
and Education, 163:104041.
Hocine, N., Ameur, M., and Ziani, W. (2019). Keep atten-
tion: A personalized serious game for attention train-
ing. In GamiLearn.
Jorno, R. L. and Gynther, K. (2018). What constitutes an
actionable insight in learning analytics? Journal of
Learning Analytics, 5(3):198–221.
Kaliisa, R. and Dolonen, J. A. (2023). Cada: a teacher-
facing learning analytics dashboard to foster teach-
ers’ awareness of students’ participation and discourse
patterns in online discussions. Technology, Knowledge
and Learning, 28(3):937–958.
Lawrence, L. E. M., Echeverria, V., Yang, K., Aleven, V.,
and Rummel, N. (2024). How teachers conceptualise
shared control with an ai co-orchestration tool: A mul-
tiyear teacher-centred design process. British Journal
of Educational Technology, 55(3):823–844.
CSEDU 2025 - 17th International Conference on Computer Supported Education
398

Lawrence, L. E. M., Guo, B., Yang, K., Echeverria, V.,
Kang, Z., Bathala, V., Li, C., Huang, W., Aleven, V.,
and Rummel, N. (2022). Co-designing ai-based or-
chestration tools to support dynamic transitions: De-
sign narratives through conjecture mapping. In Inter-
national Conference on Computer-Supported Collab-
orative Learning 2022, Hiroshima, Japan, pages 139–
146. International Society of the Learning Sciences.
Lin, Y. L., Lee, M. W., and Hsiao, I. H. (2018). An ex-
ploratory study on programming orchestration tech-
nology. In Proceedings of the 22nd Pacific Asia
Conference on Information Systems - Opportunities
and Challenges for the Digitized Society, Yokohama,
Japan, Proceedings of the 22nd Pacific Asia Con-
ference on Information Systems - Opportunities and
Challenges for the Digitized Society: Are We Ready?,
PACIS 2018. Association for Information Systems.
22nd Pacific Asia Conference on Information Systems
- Opportunities and Challenges for the Digitized Soci-
ety.
Lipponen, L. (2002). Exploring foundations for computer-
supported collaborative learning. In CSCL ’02: Pro-
ceedings of the Conference on Computer Support for
Collaborative Learning: Foundations for a CSCL
Community, Boulder Colorado, pages 72–81. Rout-
ledge, International Society of the Learning Sciences.
Liu, A. L. and Nesbit, J. C. (2020). Dashboards for
computer-supported collaborative learning. Machine
learning paradigms: Advances in learning analytics,
pages 157–182.
Martinez-Maldonado, R. (2019). A handheld classroom
dashboard: Teachers’ perspectives on the use of real-
time collaborative learning analytics. International
Journal of Computer-Supported Collaborative Learn-
ing, 14:383–411.
Olsen, J. K., Rummel, N., and Aleven, V. (2021). Design-
ing for the co-orchestration of social transitions be-
tween individual, small-group and whole-class learn-
ing in the classroom. International Journal of Artifi-
cial Intelligence in Education, 31(1):24–56.
Page, M., Mckenzie, J., Bossuyt, P., Boutron, I., and Hoff-
mann, T. (2021). The prisma 2020 statement: an up-
dated guideline for reporting systematic reviews. Sys-
tematic reviews, 10(1):1–11.
Praharaj, S., Scheffel, M., Schmitz, M., Specht, M., and
Drachsler, H. (2022). Towards collaborative conver-
gence: Quantifying collaboration quality with auto-
mated co-located collaboration analytics. In LAK22:
12th International Learning Analytics and Knowledge
Conference, Online, USA, page 358–369, New York,
NY, USA. Association for Computing Machinery.
Sedrakyan, G., Malmberg, J., Verbert, K., Jarvela, S., and
Kirschner, P. A. (2020). Linking learning behavior
analytics and learning science concepts: Designing a
learning analytics dashboard for feedback to support
learning regulation. Computers in Human Behavior,
107:105512.
Serrano Iglesias, S., Spikol, D., Bote Lorenzo, M. L.,
Ouhaichi, H., Gomez Sanchez, E., and Vogel, B.
(2021). Adaptable smart learning environments sup-
ported by multimodal learning analytics. In Pro-
ceedings of the LA4SLE 2021 Workshop : Learn-
ing Analytics for Smart Learning Environments co-
located with the 16th European Conference on Tech-
nology Enhanced Learning 2021 (ECTEL 2021), On-
line (Bozen-Bolzano, Italy), pages 24–30.
Silva, L., Mendes, A., Gomes, A., and Fortes, G. (2023).
Fostering regulatory processes using computational
scaffolding. International Journal of Computer-
Supported Collaborative Learning, 18(1):67–100.
Worsley, M., Anderson, K., Melo, N., and Jang, J. (2021).
Designing analytics for collaboration literacy and stu-
dent empowerment. Journal of Learning Analytics,
8(1):30–48.
Yang, K. B., Echeverria, V., Lu, Z., Mao, H., Holstein, K.,
Rummel, N., and Aleven, V. (2023). Pair-up: proto-
typing human-ai co-orchestration of dynamic transi-
tions between individual and collaborative learning in
the classroom. In Proceedings of the 2023 CHI con-
ference on human factors in computing systems CHI
2023, Hamburg, Germany. Association for Comput-
ing Machinery.
Yang, K. B., Echeverria, V., Wang, X., Lawrence, L., Hol-
stein, K., Rummel, N., and Aleven, V. (2021). Ex-
ploring policies for dynamically teaming up students
through log data simulation. International Educa-
tional Data Mining Society.
Yang, K. B., Lu, Z., Echeverria, V., Sewall, J., Lawrence,
L., Rummel, N., and Aleven, V. (2022). Technology
ecosystem for orchestrating dynamic transitions be-
tween individual and collaborative ai-tutored problem
solving. In International Conference on Artificial In-
telligence in Education, AIED 2022, Springer, Cham,
pages 673–678. Springer.
Zamecnik, A., Kovanovic, V., Grossmann, G., Joksimovic,
S., Jolliffe, G., Gibson, D., and Pardo, A. (2022).
Team interactions with learning analytics dashboards.
Computers and Education, 185:104514.
A Systematic Literature Review of Adaptive Collaborative Systems Based on Dashboards
399
