
Unsupervised Motif and Discord Discovery in ECG
Lucas Peres
1
, Livia Almada Cruz
1
, Ticiana Coelho da Silva
1
, Regis Pires Magalh
˜
aes
1
,
Jo
˜
ao Paulo Madeiro
2
and Jos
´
e Mac
ˆ
edo
1
1
Insight Data Science Lab, Brazil
2
Federal University of Cear
´
a, Brazil
Keywords:
ECG Processing, Matrix Profile, Motifs.
Abstract:
Cardiovascular disease stands as the leading global cause of morbidity and mortality. Electrocardiograms
(ECGs) are among the most effective tools for detecting arrhythmia and other cardiovascular diseases, as well
as other applications like emotion recognition and stress level stratification. The ECG-based diagnostic relies
on specialized physicians to manually explore the whole signal. This paper presents an unsupervised solution
for ECG analysis, obviating specialists’ need to manually run over the entire dataset to identify representative
segments (motifs) or non-repeated patterns (discords). The method was experimented with an open dataset
and showed promising results.
1 INTRODUCTION
Cardiovascular disease stands as the leading global
cause of morbidity and mortality, as documented in
a comprehensive study (Abbas et al., 2023). The situ-
ation took a turn for the worse following the COVID-
19 pandemic. Extensive research on COVID-19 pa-
tients has revealed inflammation, cardio myocyte in-
jury, and microvascular thrombosis within the ventric-
ular myocardium (Wu et al., 2023). Besides, numer-
ous investigations have highlighted cardiac arrhyth-
mias as the most prevalent cardiovascular disorders
(Berkaya et al., 2018). Electrocardiograms (ECGs)
are among the most effective tools for detecting ar-
rhythmias and other cardiovascular diseases. ECGs
provide swift, non-invasive, and painless means of as-
sessing heart rate and rhythm.
In addition to their crucial role in analyzing car-
diovascular diseases, ECG signals are useful in emo-
tion recognition, particularly for detecting stress lev-
els, alongside various other indicators like skin tem-
perature, blood pressure, heart rate variability, and
cortisol levels. Researchers collect ECG data dur-
ing stressful situations, including student oral exams,
post-holiday periods, office settings for workers, and
while individuals are engaged in driving tasks. The
outcomes of these studies consistently demonstrate
that ECG features are effective in discerning distinc-
tions among various mental workloads and stress lev-
els (Berkaya et al., 2018), (Hemakom et al., 2023).
Nonetheless, the ECG-based diagnostic system
demands precise and immediate responses, relying
on specialized physicians to manually annotate each
beat. Machine Learning approaches can aid health-
care professionals in streamlining this process and
expediting diagnoses. However, as highlighted in
(Wang et al., 2021), several challenges must be ad-
dressed. To sum up, ECG data collection is compli-
cated due to privacy concerns. Establishing a stan-
dardized ECG database is a substantial, long-term in-
vestment. Large ECG datasets have limited practical-
ity due to time and resource constraints in reviewing
extensive recordings. ECG annotation includes beat,
rhythm, morphology, and conclusive annotations.
Going even further on ECG studies, it is also im-
portant to mention pattern and anomaly detection,
aiming to identify segments in the signal that do (and
do not) correspond to the common pattern. In the
context of ECG, an anomaly could be some change
in the cardiac rhythm or a malformed heartbeat that
happened once (or a few) in the time series. There
are several studies that combine different techniques
to achieve such a goal (Li and Boulanger, 2020). The
advances in the deep-learning field also helped to de-
rive solutions using generative models (Wang et al.,
2021) and use generated signals to compare and iden-
tify the anomalies (Wang et al., 2023). Other works
based on Matrix Profile (Yeh et al., 2016) tackle this
problem by comparing the segments in a time series
among them.
Peres, L., Cruz, L. A., Coelho da Silva, T., Magalhães, R. P., Madeiro, J. P. and Macêdo, J.
Unsupervised Motif and Discord Discovery in ECG.
DOI: 10.5220/0013287900003929
In Proceedings of the 27th International Conference on Enterprise Information Systems (ICEIS 2025) - Volume 1, pages 243-250
ISBN: 978-989-758-749-8; ISSN: 2184-4992
Copyright © 2025 by Paper published under CC license (CC BY-NC-ND 4.0)
243

Developing innovative and reliable algorithms ca-
pable of automatically detecting cardiac anomalies is
essential. Such algorithms will empower healthcare
professionals to explore the extensive dataset more
efficiently. In this paper, our primary objective is to
present an unsupervised solution for ECG analysis,
obviating specialists’ need to manually run over the
entire dataset to identify representative segments (mo-
tifs) or non-repeated patterns (discords). The key con-
tributions of this paper can be summarized as follows:
(1) This paper proposes a human-machine integrated
ECG analysis system that can free experts from heavy
manual exploration to identify points of interest over
the time series (like the most common cardiac rhythm
or some sort of anomaly). Experts will have access to
a summary of some key subsequences extracted from
the signal; (2) This paper enriches the Pan Matrix Pro-
file (PMP) algorithm by applying a density analysis
over its results, thereby extending its ability to detect
relevant motifs and discords within ECG data.
2 BACKGROUND
In this section, we explain key concepts relevant to
this work.
ECG. A typical cardiac rhythm consists of several
sequential segments in an ECG: (1) P Wave which
is generated by the atrial depolarization, representing
the electrical activity as the atria contract; (2) QRS
Complex which results from ventricular depolariza-
tion, indicating the initiation of ventricular contrac-
tion; (3) T Wave that results of ventricular repolar-
ization, signifying the electrical recovery of the ven-
tricles.
A typical ECG signal comprises numerous regu-
larly occurring beats, each characterized by a consis-
tent waveform (PQRST complex). Abnormal ECG
signals can be classified into three categories: Firstly,
anomalies that manifest in every beat across a lead;
secondly, anomalies restricted to a subset of beats;
and thirdly, anomalies spanning multiple beats, de-
tectable when examined alongside preceding and sub-
sequent beats. In this paper, we focus on detecting the
second category of anomalies. However, this work
can be applied to the other anomaly types once it is
based on generic signal processing techniques.
Motifs. The motif definition is not consistent
throughout the literature, and usually they are iden-
tified in pairs. Motifs are usually informally defined
as repeated segments in a time series. According
to (Mueen, 2014), the strategies for motifs discov-
ery rely on two categories: similarity-based, which
goals to identify motifs with the highest similarity;
and support-based, which aims to find subsequences
with the highest number of matches (Torkamani and
Lohweg, 2017). This work uses a similarity-based
motif definition based on (Linardi et al., 2020) and
(Yeh et al., 2016), which defines motifs in sets. Ac-
cording to (Linardi et al., 2020), a motif set contains
subsequences which are similar to others, being for-
mally defined as: Given a time series T of size n,
a size m where 1 ≤ m ≤ n , the subsequence T
i,m
(where i is the starting point of the subsequence end-
ing on i + m − 1), A motif set S
m
r
can be defined
as S
m
r
= {T
i,m
|(dist(T
i,m
,T
j,m
) ≤ r)}. The cardinal-
ity of S
m
r
represents the frequency of the motif set.
At (Yeh et al., 2016), a motif pair is a pair of sub-
sequences (T
i,m
,T
j,m
) where there is no pair T
k,m
,T
l,m
where dist(T
k,m
,T
l,m
) < dist(T
i,m
,T
j,m
). Therefore,
using the MP, the subsequences with the smallest MP
value are the motifs. For this work, the motifs of
length m of a time series are defined by the motif set
S
m
r
where r is the smallest matrix profile value.
Discords. A time series discord is the subsequence
that has the maximum distance to its nearest sub-
sequence (Yeh et al., 2016). Given a subsequence
T
i,m
and its nearest subsequence T
j,m
, they are con-
sidered discords if there is no pair T
k,m
,T
l,m
where
dist(T
k,m
,T
l,m
) > dist(T
i,m
,T
j,m
). Discords are often
referred to as anomalies. However, to prevent con-
fusion, this work will use the term discord, since on
a time series consisting only of a regular pattern, the
discord will not be an anomaly.
Matrix Profile. The Matrix Profile(MP)(Yeh et al.,
2016) is a structure that allows a time series to be rep-
resented as a matrix. Given a time series T of size
n, the algorithm analyzes all m-sized subsequences
T
i,m
∈ T and represents them with the distance to its
nearest subsequence T
j,m
∈ T . Using these values,
the motif has the smallest MP value, meaning it has
the nearest subsequence. Similarly, discord has the
highest MP value. It is important to reinforce that the
subsequences don’t need to represent a well structure
pattern in the time series, but any segment extracted.
In the context of ECGs, a subsequence can start at the
middle of a heartbeat and end at the beginning of an-
other.
Pan Matrix Profile. The motifs and discords iden-
tified using the MP are limited by the choice of m.
To address this issue, the Pan Matrix Profile (PMP)
was introduced (Madrid et al., 2019). Essentially, the
PMP constructs a framework by utilizing multiple MP
computed using a set of values for m. These values
are defined by an interval from L (lower bound) to
U (upper bound) varying by a ST EP. For instance,
L = 10, U = 20 and ST EP = 2, then for each m ∈
{10,12,14,16,18,20}, an MP will be computed. The
ICEIS 2025 - 27th International Conference on Enterprise Information Systems
244

calculation of MP has evolved since its initial publi-
cation, and the Stumpy library (Law, 2019) encom-
passes all its implementations, along with the corre-
sponding paper references for each algorithm.
3 RELATED WORKS
In this section, we present papers related to this
work, categorizing them into two groups: those fo-
cused on patterns and anomaly detection in time se-
ries and those specifically addressing ECG patterns
and anomaly detection.
Patterns and Anomaly Detection in Time Series.
Several methods have been proposed for pattern and
anomaly detection over time series, using learning
and non-learning approaches(Noering et al., 2021).
Non-learning strategies encompass distance-based al-
gorithms, like Matrix Profile(Yeh et al., 2016), which
uses the Euclidean distance among all subsequences
to identify patterns. However, measuring the distance
between two time series A and B is challenging, since
B may be very similar to A, but shifted in time, which
could give a huge distance value between them.
CrossMatch(Toyoda et al., 2013)is a strategy for
pattern discovering based on Dynamic Time Warp-
ing (DTW), which tries to tackle the time displace-
ment issue by proposing an algorithm to compare the
time series’ points better. (Jiang et al., 2021) uses
the beginning of the time series to represent the nor-
mal signal and applies correlation metrics and statistic
tests to identify segments that diverge from the normal
statistical behavior. Some works ((Malhotra et al.,
2015),(Malhotra et al., 2016)) use predictive mod-
els based on Long Short-Term Memory (LSTM) neu-
ral networks (Hochreiter and Schmidhuber, 1997) to
learn normal behavior and subsequently identify pre-
diction errors, which can assist in anomaly and pat-
tern detection, without any predefined limits or pre-
processing phase. In a broader sense, LSTM networks
and recurrent networks (RNNs) are pivotal in time se-
ries modeling for supervised learning, largely because
they utilize Backpropagation Through Time. Some
studies have combined these networks for anomaly
detection in health data (Fernando et al., 2021). (Chen
et al., 2021) uses adversarial networks to reconstruct
the signals with auto-encoder models and measure
the difference from the original signal to the recon-
structed one to identify anomalies. (Yeh et al., 2023)
proposes some model architectures for time series
classifications using Matrix Profile to find the most
similar subsequences in a time series from another
subsequence and use them as features.
ECG Patterns and Anomaly Detection. (Li and
Boulanger, 2020) provides a comprehensive overview
of normal and abnormal ECG signals. Furthermore,
it conducts a survey of the primary algorithms used
in automatic heart anomaly detection, encompassing
tasks such as noise removal, heartbeat segmentation,
feature extraction, and heartbeat classification. (Wang
et al., 2023) proposes ECGGAN that learns the uni-
versal pattern from representative normal multi-lead
ECG signals based on regular and periodic fluctu-
ations. Then, it reconstructs ECG via Conditional
GAN (CGAN) to distinguish between anomaly and
normal pattern.
4 METHODOLOGY
The main goal of this work is to provide a method to
identify and characterize the most representative mo-
tifs and discords over ECG signals to help experts on
ECG analysis without the need to inspect the whole
data and compare its subsequences.
Hospital
Raw ECG
ECG Data
cleaning
ECG Data
Segmentation
Compute Motifs
and Discords
ECG Data PQRST
identification
Evaluation Metrics
Computation
Heart Rate
Frequency
Paced
Rhythm (PR)
QT < RR/2
RR intervals
shortest
PP/RR
longest
PP/RR
Mean
distance
ECG Anomaly and
Motif Interpretation
Pick the
representative
motif and discord
Figure 1: The overview of our methodology.
We emphasize important aspects of our method-
ology. After applying data cleaning techniques to the
raw ECG signals, we utilize the resulting signal for
two independent tasks: i) identifying the motifs and
discords by calculating the PMP and selecting the op-
timal subsequence starting points for the most rep-
resentative motifs and discords and ii) detecting the
PQRST complex, which allows us a better interpre-
tation of the motifs and discords identified. Further-
more, we compute various metrics that combine the
PQRST data with the motifs and discords to the user
to aid in their interpretation. Most of these metrics are
used to assess the healthiness of the ECG, as pointed
out by (Li and Boulanger, 2020).
Figure 1 provides an overview of our methodol-
ogy, which is explained in detail in the following sec-
tions.
4.1 ECG Data Cleaning and
Segmentation
To avoid noises interfering with the motif/discord dis-
covery, we apply a 0.5Hz high-pass Butterworth filter
Unsupervised Motif and Discord Discovery in ECG
245

of 5th-order, followed by a 50Hz powerline filtering.
The cleaned signal is used for identifying motifs and
discords.
The continuous wavelet transform (CWT) is also
applied over the cleaned signal to identify the PQRST
complex. Following this, we determine the intervals
of these waves and locate their peaks and P/QRS/T
wave boundaries. This information will be useful for
computing metrics over the identified motifs and dis-
cords. Since the cleaning and segmentation algorithm
is not used in this work scope, we did not explore
other approaches. Neurokit library(Makowski et al.,
2021) was used to perform such processing.
4.2 Compute Motifs and Discord
After the signal cleaning, the subsequent phase in-
volves computing the PMP. The selection of values
for m to be analyzed should align with the user’s spe-
cific objectives. In Section 5, we delve into two dis-
tinct window sizes: a smaller one for heartbeat analy-
sis and a larger one for beat-to-beat intervals. Further
elaboration on this can be found in the next section.
Following the PMP calculation, motifs and dis-
cord subsequences can be identified for each value of
m. However, these subsequences may occur at differ-
ent instants, leading to the question of which one to
choose?, irrespective of the subsequence size. To ad-
dress this, it is intuitive to select subsequences with a
high quantity of motifs/discords across various m val-
ues, signifying an area with a high density of points.
If, for some values of m, we notice lots of motifs start-
ing around a timestamp t, it may indicate that sub-
sequences starting from t are more representative so
that the analysis could start from there. Therefore, a
density-based clustering algorithm could be utilized.
We tried DBSCAN and HDBSCAN(McInnes
et al., 2017) to cluster the starting points of the iden-
tified motifs and discords. However, since the data
to be clustered is one dimensional (the starting posi-
tion of the subsequence), the clustering task was ef-
ficiently addressed with a neighborhood counting ap-
proach, avoiding the complexity calculations of ro-
bust unsupervised models. Once we computed the
number of neighbors withing the same cluster of each
subsequence (what we will call its density), we select
the densest one. This point will represent the region
containing the motif/discord, without restricting it to
a specific size.
Once we can point out the motifs/discord subse-
quences, we need to provide some metrics to endorse
(or invalidate) the selection. That is important be-
cause of two main scenarios:
• A motif may not appear as a typical ECG heart-
beat, yet it can still be representative due to factors
such as device malfunctions during data collection
or underlying cardiac conditions in the patient.
• A discord might closely resemble the motifs and
the rest of the time series. However, if the time se-
ries primarily consists of a well-defined pattern re-
peated throughout, the one that deviates the most
from this pattern will be identified as a discord,
even if it’s not a cardiac anomaly.
4.3 Evaluation Metrics Computation
We have developed two sets of metrics. The first set
assesses how well the identified subsequences match
the remainder of the time series, verifying whether a
motif/discord is consistent with its expected charac-
teristics. The second set aims to determine if the ECG
subsequences may contain healthy heartbeats.
4.3.1 Comparing the Subsequences
The straightforward approach to comparing a mo-
tif/discord with the time series is calculating its dis-
tance to all other subsequences of the same size. The
simplest approach is to use Euclidean distance. If a
subsequence is a motif, it should exhibit a small mean
distance and deviation in comparison to all others, or
at least smaller than the discord. However, when we
compare a subsequence T
i
with T
i+1
, T
i+2
, and so on,
we are essentially comparing nearly identical signals.
The Matrix Profile (MP) papers introduce an exclu-
sion zone to prevent comparing a subsequence to the
ones that start close. This exclusion zone is defined as
m/4(Madrid et al., 2019).
The identified motifs/discords vary in size, thus it
is natural to anticipate that longer subsequences will
generally have a greater mean distance than smaller
ones since there are more points to compare. As-
suming that the distance has a positive linear corre-
lation with the subsequence size, we can introduce a
straightforward measure called distance per second,
which represents the distance divided by the length of
the subsequence in seconds, facilitating a more con-
sistent comparison among subsequences of different
sizes. In section 5 we compute the correlation and
sustain the hypothesis.
4.3.2 Interpretation of Motifs and Discords
Under the ECG Context
According to (Li and Boulanger, 2020), the heart
rate observed from normal ECG signals typically fall
within the range of 60 to 100 beats per minute (bpm).
ICEIS 2025 - 27th International Conference on Enterprise Information Systems
246
The PR interval should be between 0.12 to 0.2 sec-
onds, representing the time between atrial depolariza-
tion and ventricular depolarization. The QT interval,
which reflects the time for ventricular depolarization
and repolarization, should be less than half of the cor-
responding RR interval (the time between consecu-
tive R waves). There should be minimal variation be-
tween the shortest PP interval (atrial) or RR interval
(ventricular) and the longest PP interval/RR interval,
typically less than 0.04 seconds. This consistency in-
dicates a regular heart rhythm.
These criteria help healthcare professionals assess
the health and regularity of the heart’s electrical ac-
tivity when analyzing ECG signals. Deviations from
these normal parameters can indicate various cardiac
abnormalities and may require further investigation
and medical attention. Using the heartbeats identified
at the first step we can compute those metrics. How-
ever, sometimes Neurokit fails to identify correctly
all the components of a heartbeat, so we only use
the complete ones (referenced as valid heartbeats).
For metrics that require computing intervals from two
consecutive heartbeats, we only calculate them for se-
quences of valid heartbeats.
5 EXPERIMENTAL ANALYSIS
To evaluate the method previously described, we de-
signed an experiment using MIT-BIH Arrhythmia
Database (MIDTB) (Moody and Mark, 2001; Gold-
berger et al., 2000), with ECG signals collected from
48 subjects for 30 minutes with a sampling rate of
360Hz. This is an open dataset utilized to establish
experiment reproducibility.
For each signal collected in the referred dataset,
we applied the method to identify motifs and discords,
varying the window sizes within two specific inter-
vals: (1) Small windows (L = 1s, U = 5s, STEP =
0.25s), from 1 to 5 seconds, where we can analyze
the heartbeat formation and waveforms intervals; (2)
Large windows (L = 15s, U = 20s, STEP = 0.25s),
from 15 to 20 seconds, where we can analyze car-
diac rhythm and patterns for waveform morphology
changes.
Due to the space limit, this work cannot present
the results for all subjects. We summarized the met-
rics to all of them and we selected some cases to il-
lustrate the main scenarios identified in the experi-
ments. A GitHub repository
1
is available with all the
resources needed to reproduce this experiment, and
the images for all subjects.
1
https://github.com/lucaspg96/motif-discord-ecg
5.1 Metrics Results Overview
First, we must verify if the metric “distance per sec-
ond” is valid. To do so, we got all the motifs and
discords pointed out for all 48 subjects on both win-
dows intervals. We computed the mean distance to all
other subsequences of the same size and found 0.61
for the Pearson correlation coefficient. The value in-
dicates a high positive linear correlation between the
subsequence size and its mean distance, which vali-
dates the hypothesis on which the metric was based.
All metrics were calculated for the most dense
motif and discord for each window interval (small
and large). This analysis produced a large table with
192 lines that would not be adequate to inspect in this
work. Therefore, we compare the values found using
box plots. We expect motifs to have better metrics
than the discords. Consequently, the box plot allows
us to identify not only the median values as well as
their dispersion.
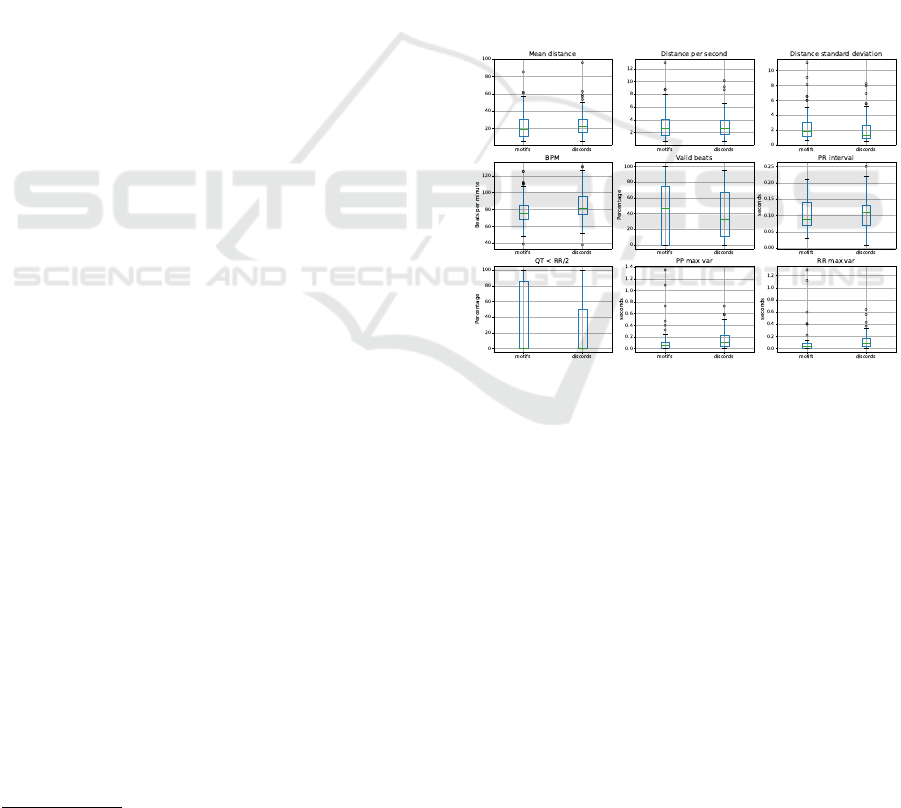
Figure 2: Metrics summary for all the 48 MIT subjects.
Figure 2 contains the graphs for the metrics: mean
distance, distance per second, and the distance stan-
dard deviation; the beats per minute (BPM), expected
to be from 60 to 100); the percentage of beats found
in the segmentation phase that contains all the PQRST
waves properly identified; the PR interval (PR, from
0.12 to 0.2); the number of times the QT duration is
smaller than half of the RR interval (QT ≤ RR/2);
and the variation from the min and max PP and RR
intervals (ideally less than 0.04 seconds).
It is important to mention that for the metrics that
are computed using consecutive heartbeats, we de-
cided only to compute them for pairs of consecu-
tive heartbeats that are fully segmented (i.e., all the
PQRST waves identified). Therefore, for small sub-
sequences analyzed, since it may start and ends on the
middle of a heartbeat (like Figure 3a 3rd most dense
motif), these metrics cannot be properly calculated.
Unsupervised Motif and Discord Discovery in ECG
247

Analyzing Figure 2 we notice that the Euclidean-
based distance metrics (mean distance, standard de-
viation, and distance per second) are not very differ-
ent from motifs and discords. This is not unexpected,
since the Euclidean distance is not the best metric
to compare time series segments. However, it is on
what Matrix Profile is based on. Furthermore, the
ECG health metrics show more promising compar-
isons: the BPM has a smaller variation and a slightly
healthy median value for the motifs, while the dis-
cords present a large volume of data with higher heart
rate; both motifs and discord have a great variance
on the number of correctly identified heart beats, but
the motifs achieve a greater percentage; The PR inter-
val and PP/RR intervals max variance presented better
values for the motifs, being also less dispersed than
the discord ones. Regarding the QT ≤ RR/2 ratio, the
median value is 0% on both sides due to the already
explained problem with the valid heartbeat identifica-
tion. However, the motifs contain higher results than
the discords.
5.2 Analysis of Use Cases
Hereafter, we present some interesting cases extracted
from the 48 subjects analyzed. Unfortunately, due to
the figures’ sizes and the limited space, only 1 sub-
ject will be explored in this work version. We en-
courage the readers to look at the GitHub resources
for a better exploration. Each one has the follow-
ing structure: the first line of plots is a simple sum-
mary computed by Neurokit, presenting the morphol-
ogy of the identified heartbeats, the rhythm as beats
per minute through time, and the R-peaks intervals
duration. Then we have the density grouping results
for the motifs, and the most dense one is highlighted.
At the grouping graph’s right, the three most dense
subsequences are displayed. Below these two graphs,
there is a table with the the start point and the size of
the motif and the previously shown metrics. The same
structure repeats for the discords. Each of these met-
rics has spectated values in normal ECG signals (Li
and Boulanger, 2020). We do not expect all of them
to have values different from the expected normal,
indicating an anomaly. However, when one of the
metrics assumes a value different from the expected
norm, it already serves as an alert that something may
not be normal. There may be some empty cells on
the table. That happens when there are insufficient
valid detected heartbeats to compute the metrics. We
emphasize that the heartbeat detection is carried out
by Neurokit, and thus, there are limitations in cases
where it fails to identify the heartbeat. This, however,
is not a limitation of our approach.
Figures 3a and 3b present the motifs and discords
for record 118. It is interesting to point out that the
method was not able to group the points. That hap-
pens because we do not have enough points suffi-
ciently near each other. For these scenarios, we take
the three motifs with median sizes. The small win-
dow motifs consist of three correctly identified heart-
beats with healthy metric values. Meanwhile, the dis-
cords present a high PP/RR max variation and some
visual anomaly. The large windows motifs and dis-
cords are shown at Figures 3c and 3d. The motifs con-
tain slightly low PR and high PP/RR intervals. The
discords contain more elevated PP/RR intervals and
violate the QT/RR proportion for some beats. They
also contain a more elevated heart rate.
According to the MIT-BIH labels, both motifs pre-
sented to subject 118 do not contain anything but reg-
ular heartbeats. The small window discords exhibit
noise in the data, rather than a cardiac problem, which
may explain why most metrics indicate healthy re-
sults. On the other hand, the large window discords
reveal an atrial premature beat.
Presenting the graphs and metrics to domain ex-
perts, they confirmed the observations highlighted in
this section: the motifs contain healthy heartbeats,
and the discords may indicate some cardiopathic con-
ditions. They also suggested that it would be inter-
esting to find more than one motif/discord for each
subsequence size. This feature could be valuable for
analyzing changes in patient behavior, potentially in-
dicating periods of sleep or physical activity.
The detection and extraction of motifs and dis-
cords have a great potential for describing and syn-
thesizing ECG time series of different legnths and na-
tures. For example, in a 24-h ECG holter, the motifs
and discords may inform concerning the predominant
behaviour and different possible events, like arrhtyh-
mic events, and if the events occurs in isolation or
repeatedly. If both motif and discords are related to
normal and expected ECG metrics, then the special-
ists can conclude that all the time series do not contain
relevant events. On the other hand, if even the motifs
present unexpected ECG metrics, the specialists can
infer that electrocardiographic changes are predomi-
nant and require further investigation.
6 CONCLUSION AND FUTURE
WORKS
This work proposes a new unsupervised method for
ECG analysis based on Matrix Profile. Experiments
have shown that the solution can identify motifs and
discords using an open ECG dataset. Since the Matrix
ICEIS 2025 - 27th International Conference on Enterprise Information Systems
248
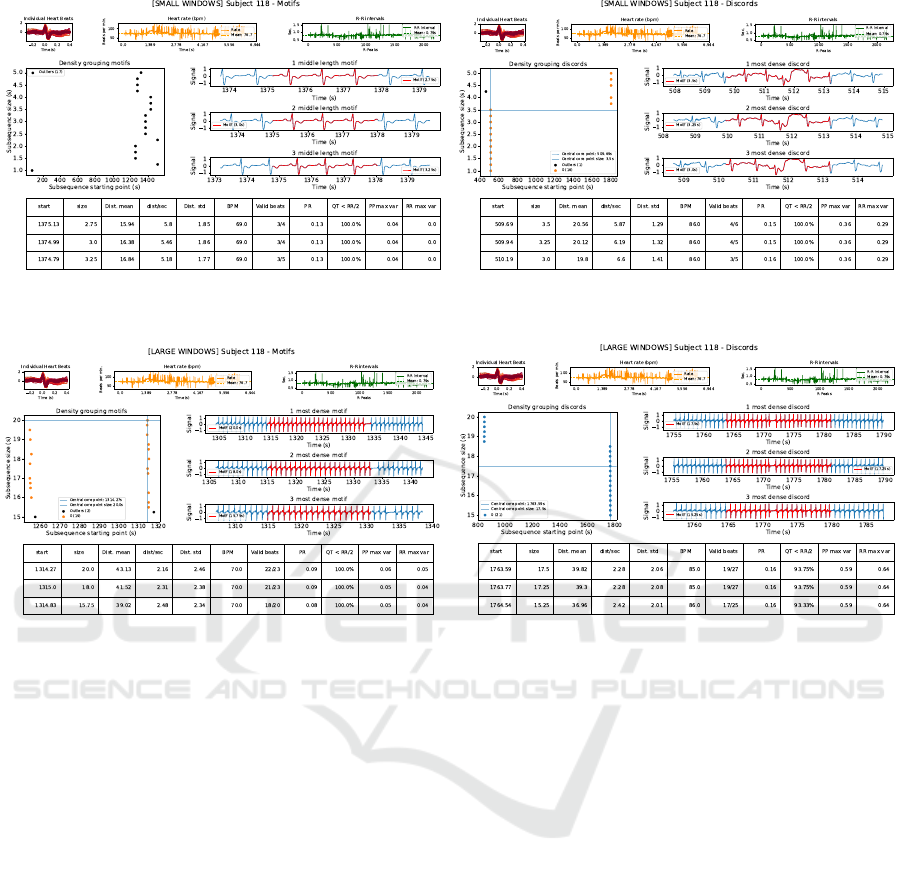
(a) Motifs identified for user 118, analyzing small windows. (b) Discords identified for user 118, analyzing small win-
dows.
(c) Motifs identified for user 118, analyzing large windows. (d) Discords identified for user 118, analyzing large windows.
Figure 3: Motifs and discords analysis for subject 118.
Profile calculation is agnostic to the signal type and
origin, this same method can be applied in other sce-
narios, like accelerometers, thermometers, etc. Fur-
thermore, Matrix Profile also has a solution to mul-
tidimensional time series and this work can also be
extrapolated to such a scenario. The solution modu-
larization allows one to improve it by changing the al-
gorithm to identify the motifs and discords by a DTW-
based, statistics, or machine learning solution.
ACKNOWLEDGEMENTS
Part of the results presented in this work were
obtained through the project ”CENTER OF EX-
CELLENCE IN ARTIFICIAL INTELLIGENCE -
AI4WELLNESS”, funded by Samsung Eletr
ˆ
onica da
Amaz
ˆ
onia Ltda. at Federal University of Cear
´
a,
Brazil, under the Information Technology Law Num-
ber 8.248/91.
REFERENCES
Abbas, A., Raza, A., Ullah, M., Hendi, A. A., Akbar,
F., Khan, S. U., Zaman, U., Saeed, S., ur Rehman,
K., Sultan, S., et al. (2023). A comprehensive re-
view: Epidemiological strategies, catheterization and
biomarkers used as a bioweapon in diagnosis and
management of cardio vascular diseases. Current
Problems in Cardiology, 48(7):101661.
Berkaya, S. K., Uysal, A. K., Gunal, E. S., Ergin, S., Gunal,
S., and Gulmezoglu, M. B. (2018). A survey on ecg
analysis. Biomedical Signal Processing and Control,
43:216–235.
Chen, X., Deng, L., Huang, F., Zhang, C., Zhang, Z., Zhao,
Y., and Zheng, K. (2021). Daemon: Unsupervised
anomaly detection and interpretation for multivariate
time series. In 2021 IEEE 37th ICDE, pages 2225–
2230. IEEE.
Fernando, T., Gammulle, H., Denman, S., Sridharan, S.,
and Fookes, C. (2021). Deep learning for medical
anomaly detection–a survey. ACM Computing Sur-
veys (CSUR), 54(7):1–37.
Goldberger, A. L., Amaral, L. A., Glass, L., Hausdorff,
J. M., Ivanov, P. C., Mark, R. G., Mietus, J. E., Moody,
G. B., Peng, C.-K., and Stanley, H. E. (2000). Phys-
Unsupervised Motif and Discord Discovery in ECG
249

iobank, physiotoolkit, and physionet: components of
a new research resource for complex physiologic sig-
nals. circulation, 101(23):e215–e220.
Hemakom, A., Atiwiwat, D., and Israsena, P. (2023). Ecg
and eeg based detection and multilevel classification
of stress using machine learning for specified genders:
A preliminary study. Plos one, 18(9):e0291070.
Hochreiter, S. and Schmidhuber, J. (1997). Long short-term
memory. Neural computation, 9(8):1735–1780.
Jiang, J.-R., Kao, J.-B., and Li, Y.-L. (2021). Semi-
supervised time series anomaly detection based on
statistics and deep learning. Applied Sciences,
11(15):6698.
Law, S. M. (2019). Stumpy: A powerful and scalable
python library for time series data mining. Journal
of Open Source Software, 4(39):1504.
Li, H. and Boulanger, P. (2020). A survey of heart anomaly
detection using ambulatory electrocardiogram (ecg).
Sensors, 20(5):1461.
Linardi, M., Zhu, Y., Palpanas, T., and Keogh, E. (2020).
Matrix profile goes mad: variable-length motif and
discord discovery in data series. Data Mining and
Knowledge Discovery, 34:1022–1071.
Madrid, F., Imani, S., Mercer, R., Zimmerman, Z., Shak-
ibay, N., and Keogh, E. (2019). Matrix profile
xx: Finding and visualizing time series motifs of all
lengths using the matrix profile. In 2019 IEEE ICBK,
pages 175–182. IEEE.
Makowski, D., Pham, T., Lau, Z. J., Brammer, J. C.,
Lespinasse, F., Pham, H., Sch
¨
olzel, C., and Chen,
S. A. (2021). Neurokit2: A python toolbox for neu-
rophysiological signal processing. Behavior research
methods, pages 1–8.
Malhotra, P., Ramakrishnan, A., Anand, G., Vig, L., Agar-
wal, P., and Shroff, G. (2016). Lstm-based encoder-
decoder for multi-sensor anomaly detection. arXiv
preprint arXiv:1607.00148.
Malhotra, P., Vig, L., Shroff, G., Agarwal, P., et al. (2015).
Long short term memory networks for anomaly detec-
tion in time series. In ESANN, volume 2015, page 89.
McInnes, L., Healy, J., and Astels, S. (2017). hdbscan: Hi-
erarchical density based clustering. J. Open Source
Softw., 2(11):205.
Moody, G. B. and Mark, R. G. (2001). The impact of
the mit-bih arrhythmia database. IEEE engineering
in medicine and biology magazine, 20(3):45–50.
Mueen, A. (2014). Time series motif discovery: dimen-
sions and applications. Wiley Int. Rev. Data Min. and
Knowl. Disc., 4(2):152–159.
Noering, F. K.-D., Schroeder, Y., Jonas, K., and Klawonn,
F. (2021). Pattern discovery in time series using au-
toencoder in comparison to nonlearning approaches.
Integrated Computer-Aided Engineering, 28(3):237–
256.
Torkamani, S. and Lohweg, V. (2017). Survey on time series
motif discovery. WIREs Data Mining and Knowledge
Discovery, 7(2):e1199. e1199 DMKD-00255.R2.
Toyoda, M., Sakurai, Y., and Ishikawa, Y. (2013). Pattern
discovery in data streams under the time warping dis-
tance. The VLDB Journal, 22:295–318.
Wang, H., Luo, Z., Yip, J. W., Ye, C., and Zhang, M. (2023).
Ecggan: A framework for effective and interpretable
electrocardiogram anomaly detection. In Proceedings
of the 29th ACM SIGKDD, pages 5071–5081.
Wang, H., Zhou, Y., Zhou, B., Niu, X., Zhang, H., and
Wang, Z. (2021). Interactive ecg annotation: An arti-
ficial intelligence method for smart ecg manipulation.
Information Sciences, 581:42–59.
Wu, L., Jiang, Z., Meulendijks, E. R., Baylan, U., Waas,
I. S., Bugiani, M., Tuinman, P. R., Fronczek, J., He-
unks, L. M., de Groot, J. R., van Rossum, A. C.,
Niessen, H. W., and Krijnen, P. A. (2023). Atrial
inflammation and microvascular thrombogenicity are
increased in deceased covid-19 patients. Cardiovas-
cular Pathology, 64:107524.
Yeh, C.-C. M., Chen, H., Fan, Y., Dai, X., Zheng, Y., Lai,
V., Wang, J., Zhuang, Z., Wang, L., Zhang, W., et al.
(2023). Ego-network transformer for subsequence
classification in time series data. In 2023 IEEE In-
ternational Conference on Big Data (BigData), pages
1242–1247. IEEE.
Yeh, C.-C. M., Zhu, Y., Ulanova, L., Begum, N., Ding, Y.,
Dau, H. A., Silva, D. F., Mueen, A., and Keogh, E.
(2016). Matrix profile i: all pairs similarity joins for
time series: a unifying view that includes motifs, dis-
cords and shapelets. In 2016 IEEE 16th ICDM, pages
1317–1322. Ieee.
ICEIS 2025 - 27th International Conference on Enterprise Information Systems
250
