
Retrieval of Similar Behaviors of Human Postural Control from the
Center of Pressure in Elderly People with Sarcopenia
Thales Vinicius de Brito Uê, Danilo Medeiros Eler
a
and Iracimara de Anchieta Messias
Faculty of Science and Technology, São Paulo State University, Presidente Prudente, São Paulo, Brazil
Keywords: Center of Pressure, Elderly People, Feature Extraction, Force Plate, Information Retrieval, Postural Control,
Sarcopenia, Visual Analysis.
Abstract: Human postural control acquired by a force plate is an object of study in different Healthcare areas. However,
researchers without much experience in other areas of knowledge, such as Statistics and Information
Technology, observe their data only quantitatively. Therefore, as complement to these biomechanical analyses,
this paper aims to compare, retrieve and visualize similar behaviors of the Centre of Pressure (COP) measured
according to static positions performed by elderly people with sarcopenia, before and after the application of
a muscular training intervention. For this purpose, the medial-lateral (ML) and anterior-posterior (AP)
directions of the COP's oscillations are used, respectively, as coordinates on the x- and y-axes, to which the
Fourier Transform is applied to extract features from each set of coordinates that will represent each data
collection during comparisons by the Euclidean distance metric. The acquisitions are ranked based on the
similarity they share with the one defined as query. As a result, only acquisitions of interest are retrieved.
Case studies involved comparisons of pre- and post-intervention data collections from 4 subjects performing
different static positions on the force plate. Scatter plot visualizations, combined with comparisons and
retrievals of similar behaviors among COP’s oscillations, facilitate analyses and insights regarding the
subjects' postural balance performance during force plate data collections.
1 INTRODUCTION
Force plates, as biomechanical equipment, are
responsible for measuring data and information that
reflect the human body's movement in the context of
different work and daily activities (Uê et al., 2024).
In particular, observations and evaluations of human
postural control during the performances of these
tasks are essential for providing knowledge related to
many Healthcare areas, including Physiotherapy,
Biomechanics and Ergonomics (Advanced
Mechanical Technology, Inc., 2020).
However, analyses of data acquired by force
plates are more commonly based on a quantitative
approach involving mathematical software (e.g.,
MATLAB and SPSS), which require researchers to
have prior knowledge to be able to operate them
(Dunn et al., 2017). Consequently, researchers in the
Healthcare areas with less experience in other areas
of knowledge (e.g., Statistics and Information
Technology) become dependent on the support of
a
https://orcid.org/0000-0002-9493-145X
others to operate the software or on a prior and basic
training (Uê et al., 2023). Hence, despite the
predominance of statistical results for biomechanical
research (e.g., assessment of static postural control),
qualitative information has its importance in
biomechanical analyses as it provides another way of
looking at a set of data (Uê et al., 2024). A visual data
analysis provides an overview of all the data collected
or the values calculated from them for the variables
of interest, displaying how they all relate, in contrast
to quantitative information that summarizes an entire
human body's performance in a single numerical
value, as is the case with calculating a statistical
average (Uê et al., 2024).
For the purpose of applying a different approach
to visually analyzing force plates data, Information
Retrieval techniques embraces the processes of
storing, organizing and representing information so
that only those of interest to the user can be easily
retrieved, providing information from documents,
web pages, multimedia objects and other forms of
Uê, T. V. B., Eler, D. M. and Messias, I. A.
Retrieval of Similar Behaviors of Human Postural Control from the Center of Pressure in Elderly People with Sarcopenia.
DOI: 10.5220/0013288500003929
In Proceedings of the 27th International Conference on Enterprise Information Systems (ICEIS 2025) - Volume 1, pages 771-780
ISBN: 978-989-758-749-8; ISSN: 2184-4992
Copyright © 2025 by Paper published under CC license (CC BY-NC-ND 4.0)
771

content, both structured and non-structured (Baeza-
Yates and Ribeiro-Neto, 2013). Therefore, in
principle, the resolution of problems in this area aims
to retrieve all relevant content to a user's query, while
trying to include the minimum amount of irrelevant
content. Nowadays, the scope of Information
Retrieval applications ranges from text indexing,
modeling and classification to user interfaces and data
visualization (Baeza-Yates and Ribeiro-Neto, 2013).
Additionally, it consists in an area with strong
interdisciplinary potential, extending its applications
across various domains of knowledge, including
Healthcare.
Retrieving information that is similar to the one
adopted as reference, or query, is commonly applied
in the context of data acquired over a period of time,
i.e., time series. In order to measure and rank the
similarity between sets of values of this category,
features can be extracted from them so that these
attributes represent each set during their comparisons.
Consequently, distance metrics are applied to rank the
level of similarity, based on the characteristics
obtained for each data vector.
As a method for extracting features, also referred
to as descriptors, a set of values represented in the
time domain is converted to the frequency domain.
For this purpose, the Fourier Transform provides a
means of applying these transformations, resulting in
the acquisition of the power spectral density of the
data (Quijoux et al., 2021). Once Fourier descriptors
are extracted, they compose a feature vector able to
quantitatively describe each set of values that was
initially modeled as a time series. The task of feature
extraction for later analyses and comparisons is best
performed in the frequency domain, since it allows
for greater distinctions between descriptors
representing each data vector (Villegas et al., 2024).
The aim of this paper is to compare, retrieve and
visualize similar performances of oscillations from
the Center of Pressure (COP) in elderly people with
sarcopenia during data collections on a force plate,
before and after muscular training intervention.
Therefore, the process of recognizing similar postural
balances, involving data collections from a single
subject or several ones and whether they improve or
worsen their balance after the application of the
intervention, becomes much easier and faster.
For visualization of the COP's performance
throughout the duration of a data collection on the
force plate, it is possible to combine one of its
displacement directions by the other, i.e., to
graphically display each value measured at an instant
of the acquisition in the medial-lateral (ML) direction
by its respective anterior‑posterior (AP) direction that
occurred at the same instant of time (ML x AP) (Uê
et al., 2023). Hence, the oscillations of the Center of
Pressure were represented visually through scatter
plots. This visual representation facilitates the
perception of how the data is concentrated or
scattered, indicating a good or poor postural balance,
respectively. Furthermore, scatter plots can have their
values colored according to the instant of time at
which they were measured during data collection.
For comparisons between data collections, the
COP's oscillations in their ML and AP directions
were used to be extracted features from them, after
converting each set of coordinates from the time
domain to the frequency domain. This conversion
was applied using the Fourier Transform. The
transformed x and y coordinates were then merged
into a single feature vector, or Fourier descriptors
vector, representing the acquisitions. As a result, it is
possible to compare the feature vectors that describe
each data collection to be able to identify similar
Center of Pressure’s behaviors and, therefore, retrieve
only those acquisitions that have similar postural
balances.
This paper is organized as follows: Section 2
presents research that analyze biomechanical data
acquired from force plates by using both time and
frequency domains, along with data visualization and
classification techniques; Section 3 describes the
methodology employed to achieve the aim of this
paper, including the collection of force plate data and
its steps of processing, treatment, transformation,
comparison, visualization and analysis; Section 4
provides the results obtained after applying the
developed methodology to different case studies,
regarding the postural control in elderly people with
sarcopenia at pre- and post-muscular intervention
moments, with discussions on the visual analysis of
the results. The last section, Section 5, presents the
conclusions, advantages and benefits provided by the
development and application of this paper's
methodology.
2 RELATED WORKS
Jeong and Ohno (2017) conducted an evaluation of
the differences that work experience provides in the
workers' Center of Pressure during symmetrical load
lifting with eyes closed. The first group of
participants was composed of 20 trained and
experienced subjects from a transportation company,
and the second one was composed of six university
students with no training or skills for this context. The
Wii Balance Board force plate was used to measure
ICEIS 2025 - 27th International Conference on Enterprise Information Systems
772

the COP’s displacements, from which the velocities
of them in both time and frequency domains were
calculated. The Fourier Transform was used to
convert the velocities’ time series to the frequency
domain. For recognition of patterns and differences
between the postural balance of experienced and
non‑experienced subjects, the Linear Discriminant
Analysis (LDA) classifier was applied to the features
extracted by Fourier Transform. For implementation
of visual representations, graphs of the medial-lateral
direction of the COP's displacement by its
anterior‑posterior direction were used, along with
graphs for both time and frequency series of the
velocities reached by the COP throughout the data
collections.
Rahmati et al. (2019), based on the participation
of 40 Parkinson's patients in a balance training over
12 sessions, aimed to evaluate the effectiveness of
their training program. Authors also investigated the
neurophysiological aspects of the balance
performance in Parkinson's patients and how training
can assist in the rehabilitation of their postural
control. Data related to the Center of Pressure was
measured using a force plate, where subjects
performed two attempts under the conditions of eyes
open or closed, while standing on a rigid or foam
surface. 20 healthy subjects participated in the
experiment as a control group. To compare the results
between groups, time series for the trajectories and
velocities of the COP's displacement were visualized
and analyzed, along with the Power Spectrum
Density (PSD) of these same parameters by using the
Fourier Transform, resulting in a comparative view in
frequency domain.
Park et al. (2024) assessed the postural control of
72 subjects diagnosed with idiopathic normal
pressure hydrocephalus (iNPH) and 56 subjects who
tested positive in the cerebrospinal fluid tap test
(CSFTT). Patients were evaluated in a static posture
with their eyes open, on the day before and after the
test. A force plate was used to acquire data related to
the Center of Pressure's performance, whose
parameters were calculated in the time and frequency
domains for subsequent comparison between pre- and
post-CSFTT results. Python programming language
and its signal processing package, SciPy, were used
for the analysis. COP's trajectories in the frequency
domain were analyzed using the Fourier Transform
and Power Spectral Density. For visual analyses,
graphs were implemented for one of the COP's
displacement directions by the other, in addition to
the medial‑lateral and anterior-posterior directions
being displayed individually by both time and
frequency.
Villegas et al. (2024) employed the Wii Balance
Board force plate to measure data related to the
Center of Pressure, with the aim of identifying
patterns and distinctions between static postural
behaviors of 32 elderly people classified into three
groups: diabetics; healthy people; and those
presenting diabetes with diagnosed diabetic
neuropathy. Over 30 seconds, the subjects performed:
standing posture under the conditions of eyes open
and closed; on stable and unstable surfaces; and
performing, or not, a second cognitive task. Values
measured for COP's oscillations in the ML and AP
directions were represented by time series, from
which features were extracted to be compared and
classified using machine learning methods. The
feature extraction was also applied to COP's
parameters converted into the frequency domain,
since the spectral power is better suited to distinguish
different groups compared to temporal
characteristics. To this end, the Discrete Fourier
Transform was applied to the temporal data to
transform them into a feature vector in the spectral
power domain. Among the selected machine learning
classifiers were the K-Nearest Neighbor (K-NN)
method, which enables pattern recognition by
comparing the Euclidean distance between a data
used as a reference/query and the remaining data in
the sample.
3 MATERIALS AND METHODS
Data collections used in this paper were conducted by
Bertolini et al. (2021), using OR6-6 force plate model
from Advanced Mechanical Technology, Inc.
(AMTI). The aim of their study was to evaluate the
static postural control of elderly people with
sarcopenia, who's balance is affected by the loss of
muscle mass, before and after a 12-week muscular
training intervention (Bertolini et al., 2021). Each
subject was positioned on the surface of the force
plate and made three attempts at the static positions
of feet together (FT) and feet apart (FA) with eyes
open (EO) and eyes closed (EC) for 30 seconds; as
well as the semi‑tandem positions (ST) with eyes
open and closed; and unipodal stance with the
dominant foot and non-dominant foot, for ten seconds
(Bertolini et al., 2021). Data was collected at a
frequency of 100 Hz.
The force plate measures the ground reaction
force components and their respective torque
moments acting on the x-, y- and z-axes of an
orthogonal coordinate system (Advanced Mechanical
Technology, Inc., 2020). The components of force
Retrieval of Similar Behaviors of Human Postural Control from the Center of Pressure in Elderly People with Sarcopenia
773

and their moments are measured according to the
action performed by the subjects on the surface of the
plate. Actions can be characterized as static (e.g.,
subject standing still with changes in relation to the
positioning of their feet or to the condition of their
vision or surface) and dynamic (e.g., subject
performing a jump, walk or run). By obtaining the
force and moment values during data collections, it is
possible to calculate the behavior of the subject's
Center of Pressure over time in its medial-lateral and
anterior-posterior displacement directions,
corresponding to right-left (on the x-axis) and
front‑back (on the y-axis) displacements, respectively
(Duarte and Freitas, 2010). The COP is a measure of
positioning that has the force plate as the
biomechanical equipment commonly used to measure
it, and the observation of the COP's behavior is used
as the most significant evaluation of human static
postural control (Duarte and Freitas, 2010).
For each static position performed by the subjects
and collected before and after intervention, the values
acquired for the Center of Pressure's oscillations in its
medial-lateral and anterior-posterior directions were
used to represent, respectively, coordinates on the x-
and y-axes belonging to each point of the COP’s
displacement throughout data collection. Hence,
every static position performed by a subject on the
surface of a force plate has oscillations in the ML and
AP directions of the Center of Pressure. By
representing these displacement directions as
coordinates for the x- and y-axes, the Fourier
Transform was applied to these two sets of values to
extract descriptors from them, characterizing and
describing the COP's behavior throughout each data
collection. Therefore, it becomes possible to
distinguish or assimilate an acquisition to others that
have different or similar displacements in the x- and
y-axes. With the combination of the two sets of
Fourier descriptors, a feature vector was obtained to
represent the COP's behavior and to be used to make
similarity comparisons with feature vectors extracted
from other data collections.
As a method to compare the oscillations of the
COP obtained during the pre- and post-intervention
data collections, data was transformed into features to
describe and represent a data collection. This process
enables the calculation of a similarity distance
between acquisitions. For this purpose, the Fourier
Transform was applied to both sets of coordinates
(one with values on the x-axis and another with values
on the y-axis) and, from the resulting values, the data
extracted from each set were those that belonged to
the interval starting from the central value subtracted
by ten, and ending at that same central point added to
ten. By including the middle value, a total of 21 data
points were extracted from each set, which are
referred to as Fourier descriptors. By merging these
descriptors obtained with the Fourier Transform
applied to both sets of coordinates, a new set was
generated, named feature vector, containing 42
descriptors. The first half of values in this vector
correspond to the feature extraction from the
coordinates on the x-axis while the second half
corresponds to the same process for the y-axis.
To determine how similar the Center of Pressure's
performance is from one data collection to another,
the Euclidean distance metric was applied to compare
the feature vectors acquired from each static position.
Based on this metric, it is defined that the shorter the
distance results, the greater the similarity. And the
longer the distances, the less similar the data
collections will be to one another.
The COP in its medial-lateral and
anterior‑posterior directions of displacement was
visualized in the form of scatter plots colored to be
distinguished by subject, positioning and moment of
intervention. The displacement values in the graphs
were also individually colored to reflect the instant of
time they occurred during data collection. All steps of
data processing, treatment, analysis and visualization
were accomplished by using Python programming
language.
Finally, in addition to comparisons based on
Euclidean distance, the feature vectors acquired from
different data collections were submitted to the
PEx‑Image (Projection Explorer for Images)
software, developed by Eler et al. (2009), to visualize
how they are positioned within a feature space, where
similar vectors are represented by points close to each
other and, as the points are getting further apart, there
is a perception of how distinct the feature vectors are.
With this application, it was also possible to connect
sets of points that were close and similar with the
K‑Nearest Neighbor machine learning classifier
method. This algorithm provides connections
between the most similar neighboring acquisitions
and separates them from their more distant neighbors.
4 RESULTS ANALYSIS
As a case study to demonstrate the developed
application, the data collections acquired from a force
plate for four different elderly people with sarcopenia
were evaluated during the pre- and post-intervention
moments of a muscular training program. Each
subject performed three attempts at the static
positions of FTEO, FTEC, FAEO, FAEC, STEO and
ICEIS 2025 - 27th International Conference on Enterprise Information Systems
774
STEC at both intervention moments. In total, 144 data
collections were gathered, from which the
displacements of the Center of Pressure in its
medial‑lateral and anterior-posterior directions were
calculated, representing the balance and postural
control behavior of the subjects during the
performance of each position. For a visual
representation of the postural behavior, scatter plots
were modeled to display the coordinates obtained for
each COP oscillation along the x-axis (medial-lateral
direction) and y-axis (anterior-posterior direction).
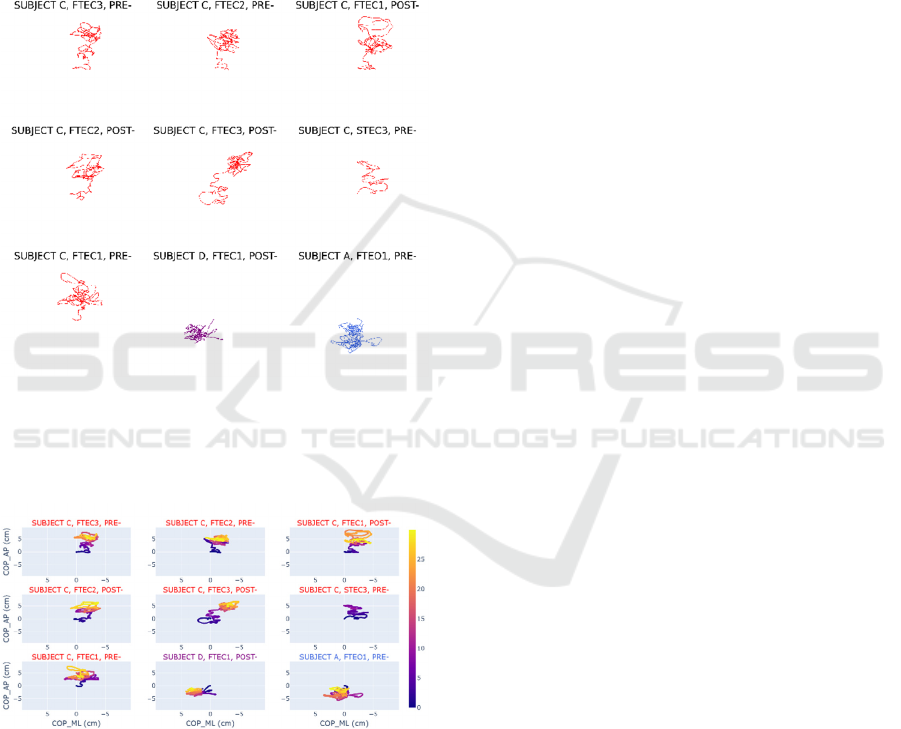
Figure 1: ML x AP scatter plots colored by subjects and
ranked in ascending order of Euclidean distances measured
in relation to the COP's performance during the positioning
defined as query (FTEC3 in the pre-intervention) and
compared to other acquisitions.
Figure 2: ML x AP scatter plots colored by time; with titles
colored by subjects; and ranked in ascending order of
Euclidean distances measured in relation to the COP's
performance during the positioning defined as query
(FTEC3 in the pre-intervention) and compared to other
acquisitions.
For each acquisition, the Fourier Transform was
applied to the coordinates of both x- and y-axes; the
Fourier descriptors were extracted from each set of
resulting values; the two sets were unified, defining a
feature vector to now represent the data collection;
and a visual analysis was then performed for two
cases of retrieving similar acquisitions from one
defined as the query.
In one of the cases, the aim was to retrieve data
collections containing CP displacements indicating
large oscillations, i.e., imbalances throughout time.
For this purpose, the third attempt to perform the feet
together with eyes closed (FTEC3) position from the
elderly person identified as the letter C, which was
acquired before the intervention applied to the
subjects, was used as the query. This means that its
feature vector, that represents it, was compared with
those features representing the other acquisitions by
using the Euclidean distance metric. Figure 1
illustrates the ranking in ascending order of the
distances obtained in relation to the subject's COP
behavior during the data collection used as a query,
corresponding to the first graph in the top left corner.
The remaining scatter plots represent the 8
acquisitions most similar to the query, arranged from
left to right and top to bottom in order of similarity.
Therefore, as there are larger similarity distances with
the query, these data collections will be positioned
less close to it. It is also important to emphasize the
relevance of the retrieval process, since it provides a
means for gathering acquisitions from the same
subject, even at different moments of intervention and
with different positions.
For the visualizations, as it is changed which
aspect that is being highlighted in the graphs of each
figure, it is important to emphasize that different ways
of coloring the graphs indicate that it is possible to
evidence different parts of the data collection,
facilitating the perception and analysis of the data. In
the first coloring method, visualizations were colored
red, green, blue and purple, so that each subject is
represented by one of these colors. The data
collections belonging to the elderly person, whose
one of his acquisitions was used as query, were
colored red. Figure 1 shows that the first 6 collections
most similar to the query belong to the same elderly
person (colored red). The last two acquisitions belong
to other two different subjects. As a result, more than
half of these unbalanced retrieved acquisitions belong
to the same subject.
Figure 3 shows the representations of static
positions being colored by the type of positioning
performed (second form of coloring). It can also be
noticed that the differentiation between eyes open and
closed for the same position is due to the change in
the tonality of the same color (e.g., light blue for the
feet together with eyes closed (FTEC) position and
dark blue for the feet together with eyes open (FTEO)
Retrieval of Similar Behaviors of Human Postural Control from the Center of Pressure in Elderly People with Sarcopenia
775

Figure 3: ML x AP scatter plots colored by positions and
ranked in ascending order of Euclidean distances measured
in relation to the COP's performance during the positioning
defined as query (FTEC3 in the pre-intervention) and
compared to other acquisitions.
Figure 4: ML x AP scatter plots colored by moments of
intervention and ranked in ascending order of Euclidean
distances measured in relation to the COP's performance
during the positioning defined as query (FTEC3 in the
pre‑intervention) and compared to other acquisitions.
position). Thus, nearly all retrieved acquisitions
involved feet together performances and, within this
group, there is a predominance of data collection with
eyes closed.
A third method of coloring the scatter plots
corresponds to the differentiation between pre- and
post-intervention acquisitions (Figure 4). Positions
collected before the intervention are colored blue and
those collected after intervention are in red. This
modeling illustrates a greater presence of
pre‑intervention positions in the recovered data
collections. Furthermore, it is important to notice that
the retrieval process identified many of the most
similar acquisitions to the query as being from the
same subject (Subject C), collected both pre- and
post-intervention. This consistency in retrieving the
same subject among those with most similar data
collections to the query, at any moment of
intervention, reflects the fact that the algorithm
succeeds in retrieving similarities. Another
consistency that can be observed is that, even in
different acquisitions and moments of muscular
training, subject C maintains the same behavior.
In addition, scatter plots were also modeled in
which each COP displacement value was colored
according to the time, in seconds, that it occurred
during data collection. The visualizations were
colored so that the darker colors (e.g., blue)
corresponded to the beginning of data collection,
while the lighter colors (e.g., yellow) indicated the
final instants. With this method of visualization, it is
possible to observe the temporal behavior of the COP
and at which instants (beginning, middle or end) the
displacement oscillations occur or not. Because the
graphs were already colored on a time scale, the text
titles of each acquisition were colored to distinct the
different subjects who performed it, as illustrated in
Figure 2. The texts were also colored according to the
moment of intervention and to the type of positioning
performed. By adding the time variable, the COP
oscillations can be better understood. In this case of
retrieving unbalanced data collections, the greatest
variations occur when the colors are darker (start of
the collection) and as the end of the period approaches
(lighter colors), some acquisitions manage to reduce
the amplitude of the COP displacements, i.e., the
subjects found a point of balance despite an
oscillating start.
Figure 5: Feature space, where feature vectors, representing
each acquisition, correspond to points colored by subjects
and connected based on the KNN classifier, highlighting
the query (FTEC3 in the pre‑intervention) and its most
similar neighbors.
ICEIS 2025 - 27th International Conference on Enterprise Information Systems
776
After visualizing different styles of scatter plots,
the feature vectors for each data collection were
submitted to PEx-Image software, in which the
feature space with all acquisitions was visualized.
The application provides the multidimensional
projection technique Interactive Document Map
(IDMAP) to be used for the visualization of the
Fourier descriptors vectors within the feature space
(Minghim et al., 2006). The points representing
similar vectors in this space were connected after
applying the K-Nearest Neighbor classification
algorithm. This connection between data points,
highlighting the one representing the query and its
nearest neighbors, is illustrated in Figure 5, where
acquisitions are colored by subjects. Therefore, the
query data collection belonging to subject C is
colored green, and it has other acquisitions from the
same subject as its most similar. Additionally, there
are more green-colored points which are also closer
to the query. The largest cluster of points on the left
side of Figure 5 indicates acquisitions sharing a
greater number of similar characteristics, resulting in
a large concentration of points. This form of
visualization by displaying the feature space,
contributes to the information retrieval process, as it
provides an overview of the similarities between all
acquisitions performed by all subjects.
On the other case study, acquisitions with a higher
concentration of COP displacement values were
retrieved, indicating a more desirable balance. Figure
6 illustrates the scatter plot visualizations modeled to
represent the behavior of the Center of Pressure
measured during the executions of each static
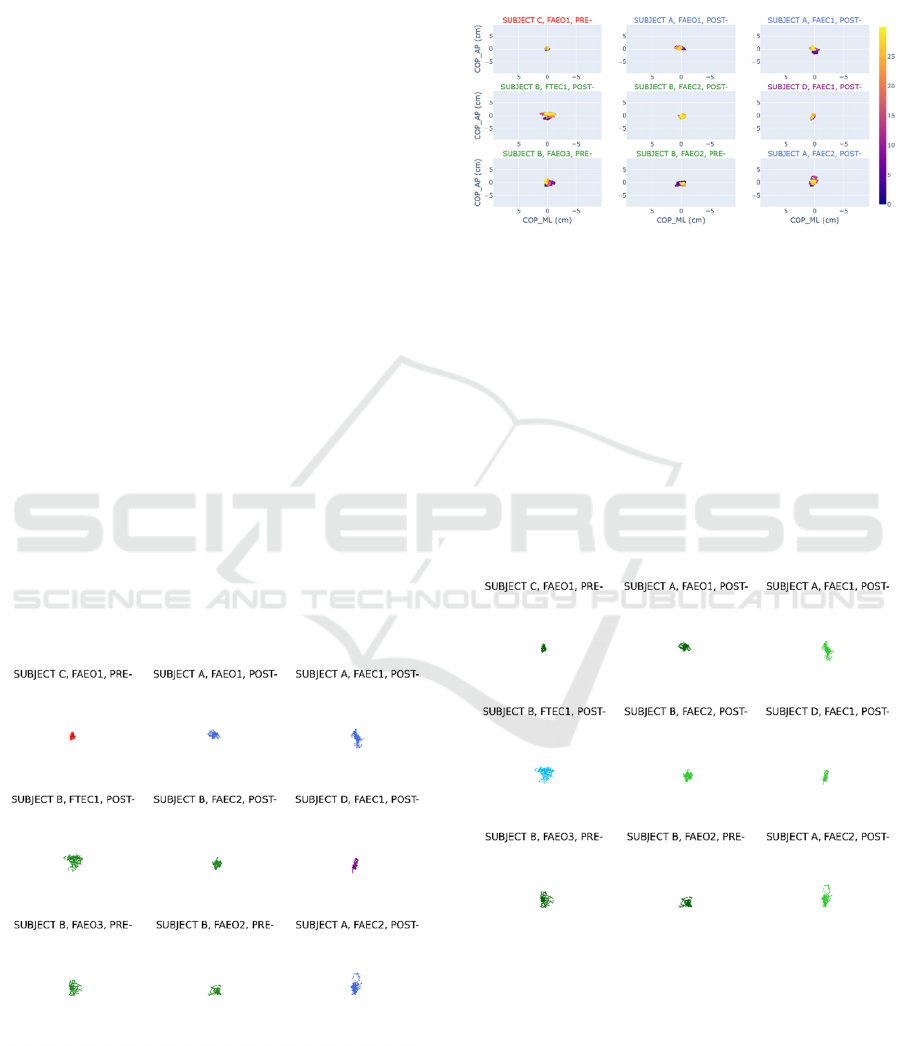
Figure 6: ML x AP scatter plots colored by subjects and
ranked in ascending order of Euclidean distances measured
in relation to the COP's performance during the positioning
defined as query (FAEO1 in the post-intervention) and
compared to other acquisitions.
position. The positioning defined as query for the
comparisons with other acquisitions corresponded to
the first attempt at the feet apart with eyes open
(FAEO1) position performed during pre‑intervention.
Figure 7: ML x AP scatter plots colored by time; with titles
colored by subjects; and ranked in ascending order of
Euclidean distances measured in relation to the COP's
performance during the positioning defined as query
(FAEO1 in the post-intervention) and compared to other
acquisitions.
The visualizations for this case were also colored
in different ways for each figure, highlighting
different parts of the data collection to provide more
insights and an easier analysis of the data. By coloring
the visualizations to differentiate the subjects, as seen
in Figure 6, it is possible to notice a greater presence
of elderly people whose data collections are in green
and blue.
Figure 8: ML x AP scatter plots colored by positions and
ranked in ascending order of Euclidean distances measured
in relation to the COP's performance during the positioning
defined as query (FAEO1 in the post-intervention) and
compared to other acquisitions.
Retrieval of Similar Behaviors of Human Postural Control from the Center of Pressure in Elderly People with Sarcopenia
777
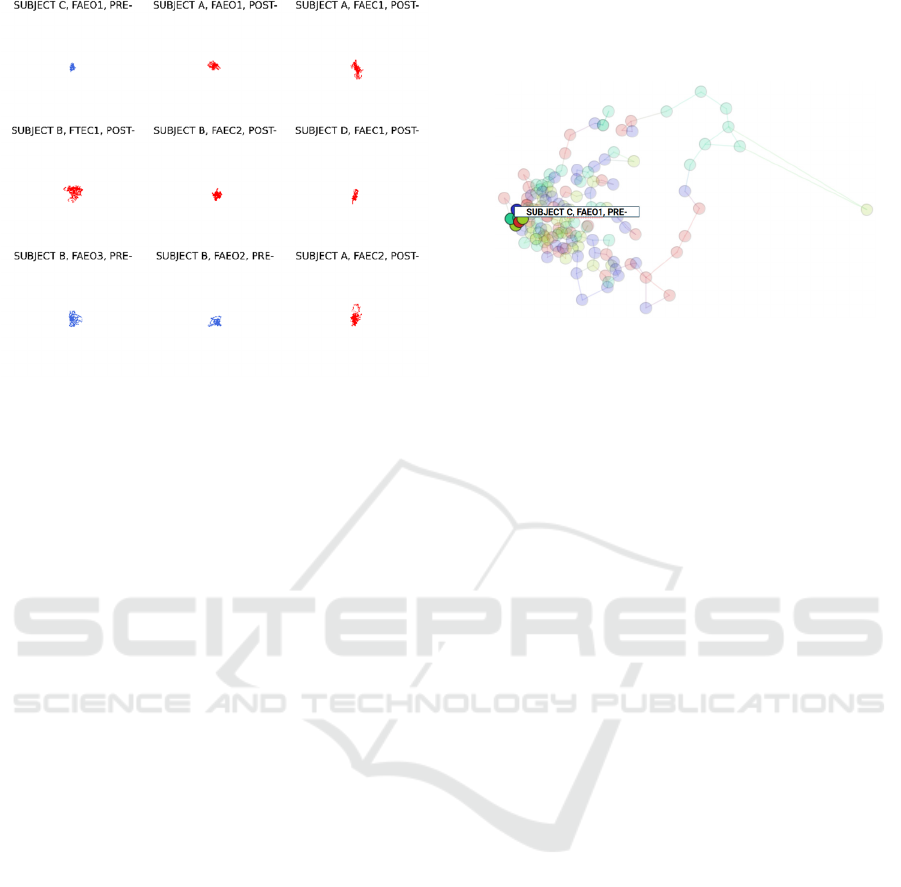
Figure 9: ML x AP scatter plots colored by moments of
intervention and ranked in ascending order of Euclidean
distances measured in relation to the COP's performance
during the positioning defined as query (FAEO1 in the
post‑intervention) and compared to other acquisitions.
On the other side, by coloring the graphs
according to the type of positioning, as seen in Figure
8, it is possible to observe the majority presence of
green coloring, whether in light or dark tones,
indicating the attempts to perform the feet apart
position with eyes open (FTEO) or closed (FTEC).
By coloring the scatter plots according to the
intervention moment at which each type and attempt
of positioning was performed (Figure 9), it is possible
to observe a dominant presence of post‑intervention
data collections colored in red among the first ones
retrieved, just as in the overall picture compared to
the amount of data collections in blue
(pre‑intervention). It is also possible to notice from
the retrieval results that some subjects (Subjects A
and B) maintained a consistency in their balance
behavior from pre- to post-intervention, in relation to
some of the positions, especially the FAEO one.
Those elderly people were able to achieve a more
concentrated postural balance, both before and after
muscular training.
The addition of the time variable to the modeling
of the scatter plots is illustrated by Figure 7 (with text
titles colored by subjects). The titles were also
colored by both positions and moments of
intervention. With this form of visualization for this
case study, it is possible to notice a greater balance of
the subjects due to a concentration of their COP
displacement values, occupying less area in the
graphs. Furthermore, the overlapping of the colors,
that indicate the time at which each displacement
value occurred in the collection, also indicates less
variations in the data, as the light colors (end of data
collection) mostly overlap the dark colors (beginning
of data collection).
Figure 10: Feature space, where feature vectors,
representing each acquisition, correspond to points colored
by subjects and connected based on the KNN classifier,
highlighting the query (FAEO1 in the post‑intervention)
and its most similar neighbors.
After applying the feature vectors, that were
defined for each acquisition, to PEx-Image software,
the visualization of the feature space was modeled
with the projection technique of IDMAP, as each
vector is being represented as a data point connected
to those most similar to it, through the K-Nearest
Neighbor method. Figure 10, where acquisitions are
colored by subjects, illustrates the KNN algorithm’s
results, in which only the point representing the query
vector and its most similar neighbors was selected
and highlighted. In this case, there are points with
different colors besides the green representing the
query. Therefore, there are other subjects’ data
collections very similar to subject C's acquisition
defined as query. It is also possible to observe that the
nearest neighbors to the query are in the largest
cluster of points on the left side of the image,
indicating multiple data collections from multiple
subjects that are also highly similar.
5 CONCLUSIONS AND
DISCUSSIONS
The force plate biomechanical equipment measures
data that provides information about the human body
movement, i.e., its behavior and postural control (Uê
et al., 2024). However, analyses of this data require
researchers to have experiences and a greater
understanding of other areas of knowledge in addition
to the Healthcare ones (Dunn et al., 2017). In
consequence, statistical analyses involving force
plate data are often conducted without a qualitative
view of the results to complement it (Uê et al., 2023).
ICEIS 2025 - 27th International Conference on Enterprise Information Systems
778

A visual analysis provides an overview of the data
and how they are related to each other, without
summarizing the human body's behavior in a single
statistical value (Uê et al., 2024).
With data collected using a force plate, it is
possible to use visualizations (e.g., scatter plots) to
qualitatively observe the performance of a subject's
Centre of Pressure in its medial-lateral and
anterior‑posterior directions during a data collection
(Uê et al., 2023). From these displacement directions
acquired for each acquisition, it is possible to use
feature extraction techniques, also referred to as
descriptors, so these can be compared with other
features extracted from COP's displacements
belonging to other acquisitions (Baeza-Yates and
Ribeiro-Neto, 2013). Once distance metrics are
applied to compare data collections, these can be
ranked according to their level of similarity, allowing
the user to retrieve only acquisitions that are similar
to the one defined as their interest, which is used as
query (Baeza-Yates and Ribeiro-Neto, 2013).
The aim of this article is to compare, retrieve and
visualize, in a ranked manner, similar performances
of the COP's displacements in elderly people with
sarcopenia, during data collection on the force plate
before and after a muscular training intervention.
Consequently, the recognition of similar postural
balances is optimized and automatized for the
comparisons of acquisitions belonging to the same or
different subjects.
For comparisons between data collections, values
obtained by the oscillations of the Center of Pressure
in its ML and AP directions were used to correspond
to coordinates on the x- and y-axes, respectively.
Fourier Transform was then applied to each of these
two sets of values to extract descriptors from them,
which combined characterized and described the
behavior of the COP during an acquisition. Having
defined the sets of Fourier descriptors values (or
feature vectors) to represent each data collection,
these vectors were compared with an acquisition
defined as query. Then, the feature vectors of all
acquisitions were ranked using the Euclidean distance
metric, so similar behaviors would have smaller
distances from the query, placing them close to it. In
the opposite way, the greater the distance result, the
less proximity the data collection shares with the
query.
For the case studies, performances of four
different subjects were compared by using their three
attempts for the static positions of FTEO, FTEC,
FAEO, FAEC, STEO and STEC, in pre- and
post‑intervention moments (Bertolini et al., 2021). In
the first case, comparisons were made between data
collections that presented large oscillations during the
displacement of the COP, i.e., the values were
scattered across the area of the graph. One of these
acquisitions that involved many postural imbalances
was defined as the query, so that behaviors most close
to it were ranked and retrieved. Results from the
retrieval of data collections similar to the one defined
as query were visualized through scatter plots, where
values were colored to differentiate the subjects,
positions, and moments of intervention. Similarly, in
another visualization model, these three coloring
forms were used in the titles of each acquisition,
because the COP's oscillation values were colored
according to the instant of time in which they
occurred.
In the second case, the query was defined as an
acquisition whose COP's displacement values were
more concentrated and placed at the center of the
scatter plot, indicating a focused and desirable
balance. The same forms of coloring by subjects,
positions, moments of intervention, and time, were
also used for the visual analysis of the results for the
most well-balanced data collections retrieved based
on the one defined as query.
Based on the developed approach of analysis, it
was possible to identify that subjects A and B
presented the largest number of data collections with
a concentrated postural control and few variations in
its amplitude. Similarly, most of performances from
feet together with eyes open (FTEO) and eyes closed
(FTEC) positions were retrieved when it was desired
to observe COP's behaviors whose displacement
values were more concentrated. There was also a
more significant presence of post‑intervention
acquisitions among the first data collections ranked.
In contrast, subject C presented the greatest balance
difficulties, especially when performing the FTEC
position at both pre- and post-intervention, as his
displacement values were more dispersed across the
area of the graphs. In general, the execution of feet
together position resulted in the greatest variations in
postural control. Additionally, most of these retrieved
data collections exhibiting the subject's difficulties in
finding their balance point, were taken in the moment
prior to the intervention.
Therefore, as methods to compare performances
of the Center of Pressure acquired in each data
collection, the feature extraction and the ranking of
acquisitions according to the one defined as a base,
i.e., a query, consist of techniques that make it
possible to retrieve data collections presenting similar
performances of the subjects’ postural control. Thus,
by associating each acquisition with a visual
representation, it becomes faster and easier to
Retrieval of Similar Behaviors of Human Postural Control from the Center of Pressure in Elderly People with Sarcopenia
779

qualitatively analyze which positions, and in which
attempts the subjects performed in a more balanced
way and with fewer COP's oscillations, or also, which
positions and attempts showed the most postural
imbalances. In addition, coloring the data values
facilitates comparisons between subjects; positions;
moments before and after intervention; and time of
collection, whether for the same subject or for
comparisons of different sets of individuals who
performed actions in contact with the surface of the
force plate.
For future work, the inclusion of professionals and
researchers, who are familiar with force plates, is
essential and of extreme importance in evaluating the
proposed visual analysis method's usability. Users'
participation, based on interviews and their
perceptions on the visual results, is a fundamental
assessment metric which provides their observations,
opinions, and narratives regarding the advantages and
potential improvements of the developed approach to
analyze postural balances acquired from force plates.
ACKNOWLEDGEMENTS
This study was financed in part by the Coordenação
de Aperfeiçoamento de Pessoal de Nível Superior -
Brasil (CAPES).
REFERENCES
Advanced Mechanical Technology, Inc. (2020). AMTI
Home Page. Accessed 2 June 2020, <https://amti.biz/>.
Baeza-Yates, R., Ribeiro-Neto, B. (2013). Modern
Information Retrieval, Bookman Editora. Porto Alegre,
2
nd
edition.
Bertolini, G. N., Silva, B. S. A., Santos, V. R., Messias, I.
A., Ribeiro, J. P. J., Marini, E., Gobbo, L. A. (2021).
Are bioelectrical parameters and functionality
associated with postural control in the elderly? Clinical
Biomechanics. Bristol, v. 82.
Duarte, M., Freitas, S. M. S. F. (2010). Revision of
posturography based on force plate for balance
evaluation. Rev. Bras. Fisioter. São Carlos, v. 14, n. 3.
Dunn, W., Burgun, A., Krebs, M., Rance, B. (2017).
Exploring and visualizing multidimensional data in
translational research platforms. Brief Bioinform. v. 18,
n. 6.
Eler, D. M., Nakazaki, M. Y., Paulovich, F. V., Santos, D.
P., Andery, G. F., Oliveira, M. C. F., Batista Neto, J.,
Minghim, R. (2009). Visual analysis of image
collections. The Visual Computer. v. 25, n. 10.
Jeong, H., Ohno, Y. (2017). Symmetric lifting posture
recognition of skilled experts with linear discriminant
analysis by center-of-pressure velocity. Intel Serv
Robotics. v. 10.
Minghim, R., Paulovich, F. V., Lopes, A. A. (2006).
Content-based text mapping using multi-dimensional
projections for exploration of document collections.
Proceedings of SPIE 2006. v. 6060.
Park, E., Lee, S., Jung, T.-D., Park, K.-S., Lee, J.T., Kang,
K. (2024). Changes in postural stability after
cerebrospinal fluid tap test in patients with idiopathic
normal pressure hydrocephalus. Front. Neurol. v. 15.
Quijoux, F., Nicolai, A., Chairi, I., Bargiotas, I., Ricard, D.,
Yelnik, A., Oudre, L., Bertin-Hugault, F., Vidal, P.-P.,
Vayatis, N., Buffat, S., Audiffren, J. (2021). A review
of center of pressure (COP) variables to quantify
standing balance in elderly people: Algorithms and
open-access code. Physiological Reports. v. 9.
Rahmati, Z., Schouten, A. C., Behzadipour, S., Taghizadeh,
G., Firoozbakhsh, K. (2019). Disentangling stability
and flexibility degrees in Parkinson’s disease using a
computational postural control model. Journal of
NeuroEngineering and Rehabilitation. v. 16.
Uê, T. V. B., Eler, D. M., Messias, I. A. (2023). A
Ergonomia Construtiva como Ferramenta na Interface
Participativa da Modelagem de Visualização Gráfica de
Posturas e Gestos. Proceedings of ABERGO 2023.
Hotel Majestic, Florianópolis, SC, Brazil.
Uê, T. V. B., Eler, D. M., Messias, I. A. (2024). A Visual
Analysis Approach to Static Postural Control Acquired
by a Force Plate. Proceedings of the 26th ICEIS. v. 1.
Villegas, C. M., Curinao, J. L., Aqueveque, D. C.,
Guerrero-Henríquez, J., Matamala, M. V. (2024). Data
augmentation and hierarchical classification to support
the diagnosis of neuropathies based on time series
analysis. Biomedical Signal Processing and Control. v.
95.
ICEIS 2025 - 27th International Conference on Enterprise Information Systems
780
