
Hazard Modeling Using Sentinel Data for Risk Assessment and
Management of Tsho Rolpa Glacier, Nepal
Prasil Poudel, Nikesh Budha Chettri, Nabin Sah and Drabindra Pandit
Department of Physics, St. Xavier's College, Maitighar, Kathmandu, Nepal
Keywords: Glacier Lake Outburst Flood (GLOF), Synthetic Aperture Radar (SAR), Geographic Information System (GIS),
and Hazard Modeling.
Abstract: The accelerated melting of the Himalayan glaciers due to climate change has caused significant issues
including Glacier Lake Outburst Floods (GLOFs), to the downstream communities and the infrastructure.
This study focuses on the Tsho Rolpa Glacier in Nepal, utilizing Sentinel-1 Synthetic Aperture Radar (SAR)
data to measure ice velocity and analyze the impacts of glacier melting on lake dynamics. A GLOF occurs
when the volume and surface area of glacier lake water exceeds the capacity of the moraine dam. For hazard
modeling, SAGA GIS 8.3.0 was used for the terrain modeling and hydrological analysis, which highlighted
the flood-prone areas. ArcGIS 10.5 facilitated the integration of Sentinel-2 imagery with local topographic
data to predict the flood scenarios. The integration of these tools enhanced the accuracy of flood paths
predictions and provided much needed valuable insights into the impacts on the local infrastructure. The
results highlights the growing risks associated with the climate-induced GLOFs, demonstrating the
importance on real-time glacier monitoring and predictive hazard modeling. This study tries to be a helpful
tool for decision-support framework for mitigating the socio-economic impacts of GLOFs in vulnerable
regions such as the Himalayas.
1 INTRODUCTION
Glaciers are a very important component of the
hydrological cycle of the earth system i.e. glaciers
play a significant role as a fresh water reservoir in
maintaining global sea level and regional water
availability. Himalayan Glaciers acts as a freshwater
reservoir to rivers downstream, which acts as a
lifeline for millions of people living downstream.
However, in the past few decade due to the ongoing
impacts of the climate change, it has accelerated the
rate at which the glaciers are melting, increasing the
risk of Glacier Lake Outburst Flood (GLOF),
landslides and other environmental disasters that
threatens the local infrastructure, ecosystems and the
daily livelihoods of the people living in those GLOFs
prone areas.
In particular, the threat of GLOFs has raised a
significant concern to the local demographic, as these
events cause catastrophic flooding downstream when
the moraine dam holding back glacier lake water fails
due to excessive increase in the glacier lake due to
melting of the glacier lake. The accurate and timely
monitoring of glaciers and the hazards associated to it
would play a critical factor for the risk assessment and
disaster management in the event of GLOF incident.
Thanks to the advancement in satellite technology,
monitoring of glacier dynamics has become more
precise and accessible. The Sentinel-1 Synthetic
Aperture Radar (SAR) and Sentinel-2 optical data,
both provided by the European Space Agency (ESA),
have proven to be indispensable tools for glacier
monitoring and the development of hazard models.
While Sentinel-1’s radar capabilities enables the year-
round monitoring (even in challenging weather
conditions due to cloud penetrating radar capabilities)
and are ideal for measuring ice velocity which is a key
factor in understanding glacier dynamics (Copernicus
Climate Sentinel-1, n.d.) but Sentinel-2’s high-
resolution optical imagery is particularly useful for
assessing surface changes and developing detailed
hazard models and predict the flood-path and the
subsequent impacts of potential GLOFs.
Our approach to this study, was to generate
awareness towards the potential disaster than could be
caused by the GLOFs incidents in high impact areas
such as Tsho Rolpa Glacial Lake in the Rolwaling
Valley (Rounce, Watson, & McKinney, 2017). This
Poudel, P., Chettr i, N. B., Sah, N. and Pandit, D.
Hazard Modeling Using Sentinel Data for Risk Assessment and Management of Tsho Rolpa Glacier, Nepal.
DOI: 10.5220/0013288700003935
In Proceedings of the 11th International Conference on Geographical Information Systems Theory, Applications and Management (GISTAM 2025), pages 165-171
ISBN: 978-989-758-741-2; ISSN: 2184-500X
Copyright © 2025 by Paper published under CC license (CC BY-NC-ND 4.0)
165
study utilized the Sentinel-1 SAR data to measure the
ice velocity of the Tsho Rolpa Glacier from 2020 to
2023, enabling the analysis of glacier dynamics. In
addition to this, Sentinel-2 imagery was used to create
an extensive hazard model. This study serves as a small
yet significant step toward mitigating the impacts.
2 RELATED WORKS
2.1 Glacier Hazard Monitoring and
Risk Assessment
Glacier hazard modeling is very important for the
prediction of associated flood path in case of GLOF
incident. Various studies have already been published
on this topic, especially the effects of climate change
in glaciers (Bolch et al., 2012).
Studied glacier retreat and thinning pattern in
Himalayan glaciers. This study suggests the increase
in potential risk of GLOFs as ice volume declines.
2.2 Sentinel-1 SAR Applications in
Glacier Monitoring
Sentinel-1 SAR data provides all-weather year-round
glacier monitoring, which acts as a great tool to
monitor areas such as Himalayan region where cloud
coverage is common. Several glaciers in previous
studies such as (Rankl, Kienholz, & Braun, 2014)
have utilized Sentinel- 1 data to monitor changes in
Ice velocity and surface deformations.
2.3 Sentinel-2 Imagery Data for
Hazard Modeling
Since Sentinel-2 provides a higher spatial resolution of
10 meters for visible and Near Infrared band (NIR), 20
meters for red-edge and SWIR band and 60 meters for
atmospheric correction bound as compared to 5-20
meters of Sentinel-1 SAR (ChatGPT, Personal
Communication, 2024). Hence, Sentinel-2 can be an
important tool for monitoring small changes in glacier
flood path making it more effective in Hazard
modeling as compared to Sentinel-1 SAR (Paul et al.,
2016).
2.4 Glacier Lake Area and Volume
Change
The previous studies by (Maskey et al., 2013)
provides insights on the significant expansion of Tsho
Rolpa Glacier Lake, driven by impacts of climate
change and accelerated melting of its parent glacier.
The lake’s surface area, recorded at merely 0.23 km²
in 1957, increased substantially to 1.65 km² by 1997,
reflecting a dramatic growth of approximately 617%
over four decades. This expansion of Tsho Rolpa
Glacial Lake has heightened the threat of GLOFs.
3 METHODOLOGY
3.1 Study Area
Tsho Rolpa glacier, located in Rolwaling Valley of
Himalayan region of Nepal is prone to GLOF
incidents because of its large glacier lake that is
actually growing because of melting glaciers
(Damen, 1992) This study analyzes the spatial and
temporal aspects of glaciers and glacier lakes.
3.2 Data Acquisition
Our study utilizes Sentinel-1 and Sentinel-2 data
obtained from the open-access Copernicus Open
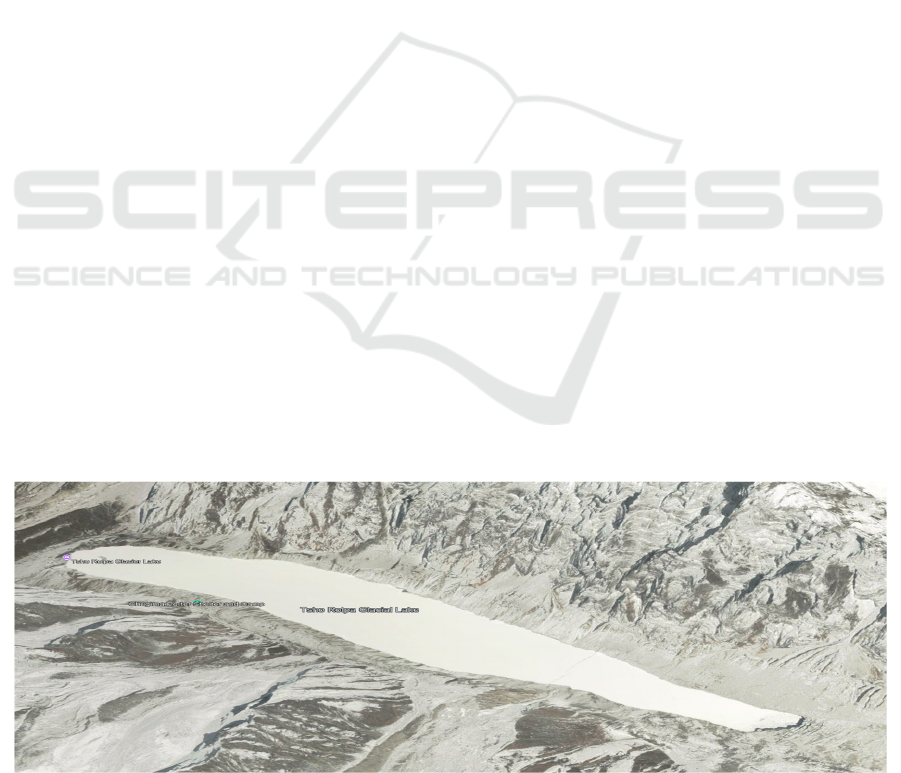
Figure 1: Google. (2021). [Map showing Tsho Rolpa Glacier] [Map]. Google Earth Pro (Version 7.3). Imagery date: March
25, 2021. Retrieved January 20, 2025, from https://earth.google.com/.
GISTAM 2025 - 11th International Conference on Geographical Information Systems Theory, Applications and Management
166
Access hub (Copernicus.eu). Since Sentinel-1 data
were used for different purpose like monitoring
natural disasters, environmental monitoring and
different climatic analysis
(Copernicus Sentinel-1, n.d.). In our study, we
have use Sentinel-1 as well as Sentinel-2 data for
analyzing Ice velocity and Hazard modeling
respectively provided by the European Space Agency
(ESA). The datasets were taken in following ways:-
3.2.1 Sentinel-1 Data
Sentinel-1 uses a spatial resolution of 5m in range
with 20m in azimuth (Du et al., 2021). The Twin
polar-orbiting satellites i.e Sentinel-1A and Sentinel-
1B are equipped with supply geographical data for
environmental and security warranting for the
expansion of the remote sensing, world economy and
business which means the satellites function both
during the day and at night and perform a synthetic
aperture with radar imaging i.e. it process radar signal
to create high-resolution image of Earth which is
obtained by simulating a large synthetic aperture
using the motion of the radar platform. We can obtain
the imagery using Sentinel-1 bands in any weather.
An active phased array antenna called C-SAR was
developed to offer faster azimuth and elevation
scanning which allows to cover bigger areas of
incidence angle to support the SAR operation
(Yulianto et al., 2021). In this research, High-
resolution SAR images from the Sentinel-1 satellites
were downloaded in Ground Range Detected High
resolution (GRDH; Level-1).
Sentinel-1 is a sun- synchronous, near-polar orbit
satellite with 175 orbits around the earth and 12 days
repeat cycle. Both Sentinel-1A and Sentinal-1B share
the same orbit plane with a 180- orbital phasing
difference. The orbit altitude of Sentinel-1 Satellite is
693 km (Yulianto et al., 2021, September).
We have acquired the imageries in Interferometric
Wide Swath (IW) Mode, which helps to monitor large
area, and in Vertical-Horizontal (VH) Polarization i.e
the signal is transmitted vertically and received
horizontally. Also, all the images were downloaded in
GRD.
3.2.2 Sentinel-2 Optical Imagery Data
Sentinel-2 provides a multispectral imaging that
allows for high-resolution imagery data, useful for
analyzing surface characteristics, glacier extent etc.
For this study, Sentinel-2 imagery data was assessed
from Copernicus Open Access hub/Copernicus
browser, which is a platform for Sentinel data. A
processing level of 2A was used, which provides
atmospherically correct surface reflectance
(Copernicus Open Access Hub, n.d.)
3.3 Methods of Hazard Modeling
Hazard Modeling is crucial for predicting the
potential flood paths in case of GLOF incidents.
Knowing the potential flood path/flow paths would
prepare local governmental bodies and demography
to be more prepared in such incidents. Along with that
it is also crucial for the planning infrastructural
development around such GLOF prone areas.
For hazard modeling Sentinel-2 imagery data was
utilized which was taken from the Copernicus hub
and then pre-processed using SAGA GIS 8.3.0
software’s “Filled sink (Wang & Liu)” pre-
processing tool to correct the elevation layer in
Digital Elevation Model (DEM) map and from DEM
map, channel network vector was created using the
Hydrology tool in Terrain analysis of SAGA GIS
8.3.0. Then the original DEM map and channel
network was imported into ARCGIS 10.5 and merged
into a single layer. The channel of order greater than
0.1 in terms of width and length was specified and
connected creating the hazard modeling layer in 2D.
Now the map was converted into a KML file and 3D
visualization was done in Google earth. Both the
DEM model and TIN visualization layers in Google
Earth Pro are taken as final results as 2D and 3D
hazard models. Both DEM layer and TIN layer were
used as results as they both could high light the aspect
of elevation to present the actual terrain features.
3.4 Ice Velocity
Glacier ice velocity plays a crucial role in understanding
Table 1: Parameter of images.
Acquisition date Acquisition date Acquisition date Acquisition date
2020-01-04 2021-01-10 2022-01-05 2023-01-12
2020-02-09 2021-02-15 2022-02-10 2023-02-17
Hazard Modeling Using Sentinel Data for Risk Assessment and Management of Tsho Rolpa Glacier, Nepal
167
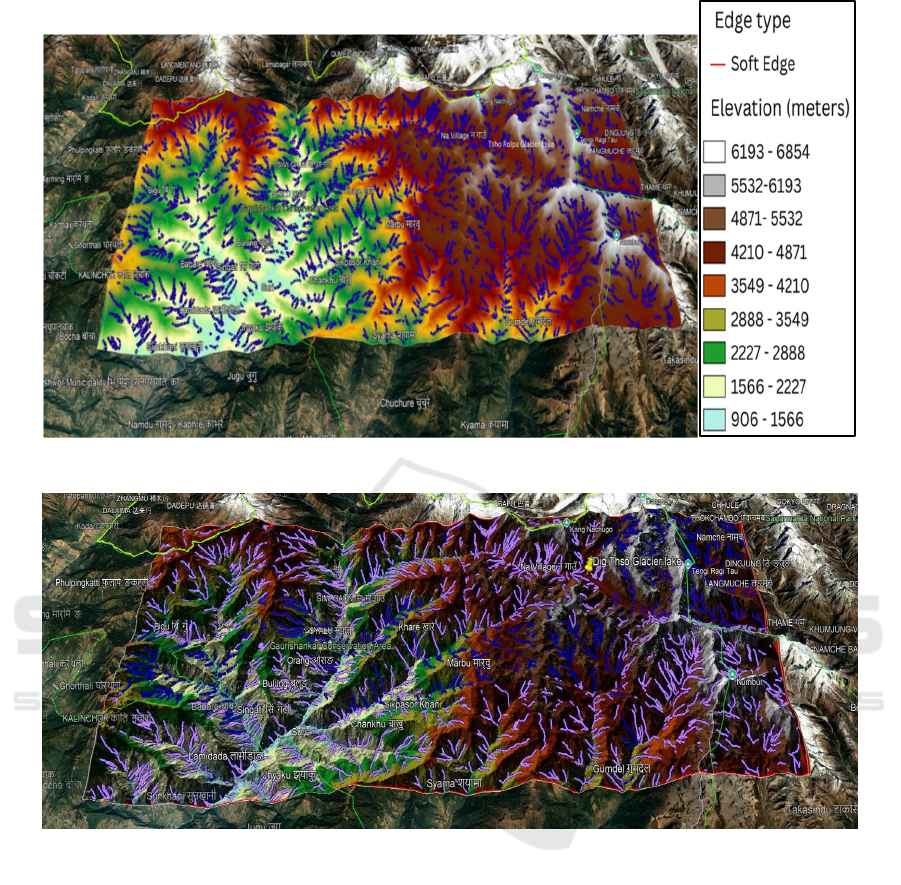
Figure 2: 2D DEM layer Hazard Model.
Figure 3: 3D Hazard Model.
the overall glacier dynamics influenced due to climate
change. The velocity of glaciers caused by different
factors including geographical location, ice thickness,
and environmental conditions (Hyde, 2024). In regions
like Himalayans the glacier dynamics affects the
availability of fresh drinking water highlighting socio-
economic effect to the country and measurement of
glacier’s ice velocity are essential for modeling future
glacier changes and potential natural calamities like
flood and landslide (Millan et al., 2023). Ice Velocity of
glaciers can be measured using different techniques but
in this study we have used optical and SAR imageries to
analyze the glacier ice velocity since high resolution
optical imageries provides high accurate measurement
(Gu et al., 2024). In this research study, we have use
offset tracking analysis calculated by Sentinel
Application Platform (SNAP) to analyze image intensity
information for identifying and matching points
between image (Gu et al., 2024). In offset tracking
random points are generated and compared between two
points which allows to analyze glacier movement with
high accuracy and calculated by
Offset =
√
𝐴
𝐷
(1)
Where, Offset is the offset of the drifted glacier
area, A is the average value of offset drifted glacier
area, D is the standard deviation of the drifted glacier
area (Gu et al., 2024).
We have used the following technique for the
analysis of the Ice velocity:
GISTAM 2025 - 11th International Conference on Geographical Information Systems Theory, Applications and Management
168
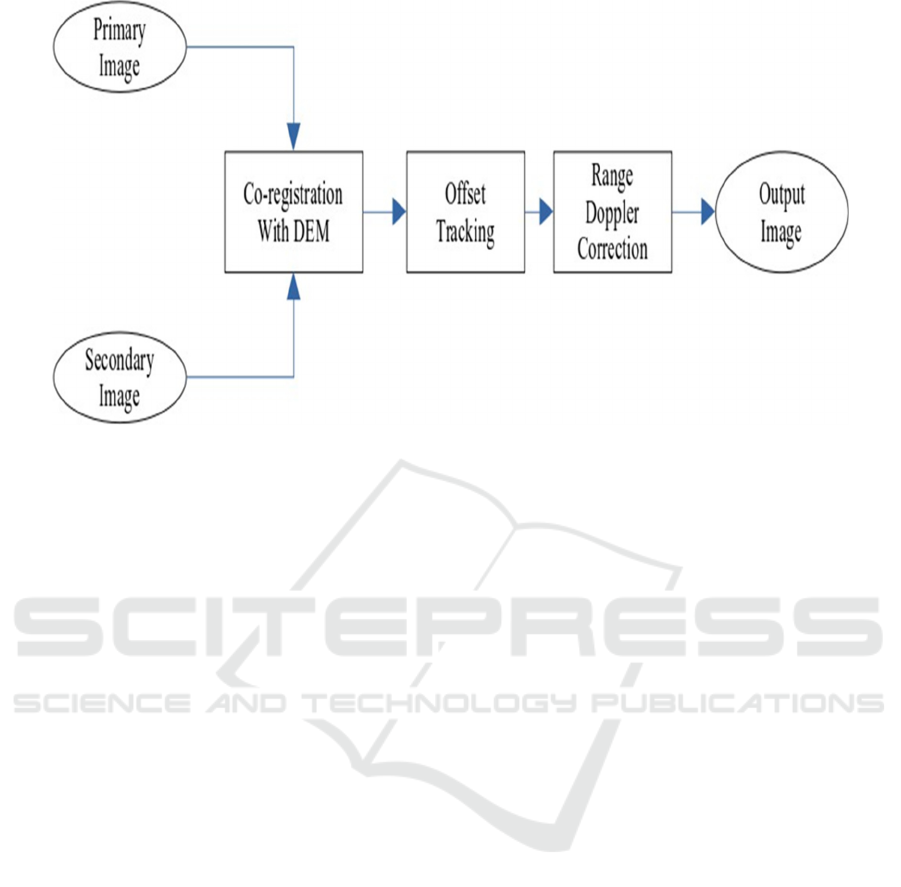
Figure 5: Flowchart of Ice Velocity Processing.
4 RESULTS AND DISCUSSION
4.1 Results from Hazard Modeling
The Hazard Modeling of Tsho Rolpa glacier lake
reveals detailed potential flood paths and hazard zones
in case of a GLOFs event. This model shows flood
paths (purple and blue lines as in figure 2 and figure 3)
where water could flow as a direct result of an outburst
event of the Tsho Rolpa glacier lake. From this model,
it was clearly shown that rural communities such as Na
Village (as seen in map) are at a high risk which serves
as a critical tool for identifying vulnerable areas and
guiding mitigation strategies.
4.2 Results from Ice Velocity
Measurement
From the figure 5(a), (b), (c), (d) it was found that the
ice velocity in the area in the year 2020 January-
February was a maximum of 0.129m/day and
minimum of 0.016m/day indicated by Red color and
White color respectively similarly in the year 2021
January-February there was a slightly fluctuation in
the velocity with a maximum velocity of 0.056m/day
and minimum of 0.002m/day indicated by Red color
and White color respectively. In the year 2022, we
can observe that the ice velocity became twice as of
2021 with a maximum velocity of 0.106m/day and
minimum of 0.006m/day indicated by the red and
white color. In the year 2023, we observed a decrease
in the velocity of ice with maximum of 0.058m/day
and minimum of 0.002m/day.
5 DISCUSSION
5.1 Interpretation of Hazard Modeling
Results
The Hazard Modeling of Tsho Rolpa glacial lake
highlights the GOLF risks of the region. The flood
paths visualized in the Figure 2 and Figure 3 shows
those rural communities such as Na Village which are
in a direct hazard zone. The visualized flood paths
demonstrate the utility of integrating remote sensing
data with the hazard assessment tools. The accuracy
of the flood paths can be further refined which was
discussed in the future works.
5.2 Interpretation of Ice Velocity of
Measurement
From the above result, we can conclude that the Ice
velocity in the area has fluctuation over time and can
lead to moraine dam collapse due to continuous flow
of water in the Tsho Rolpa lake and with fluctuation in
ice velocity the possibility of GLOF can be occurred
anytime. With Global temperature rising (Copernicus
Climate Change Service, n.d.), the possibility of
glacier melting with numerous amount of water
flowing
into
the
lake
can
lead
to
a
possible
GLOF
Hazard Modeling Using Sentinel Data for Risk Assessment and Management of Tsho Rolpa Glacier, Nepal
169
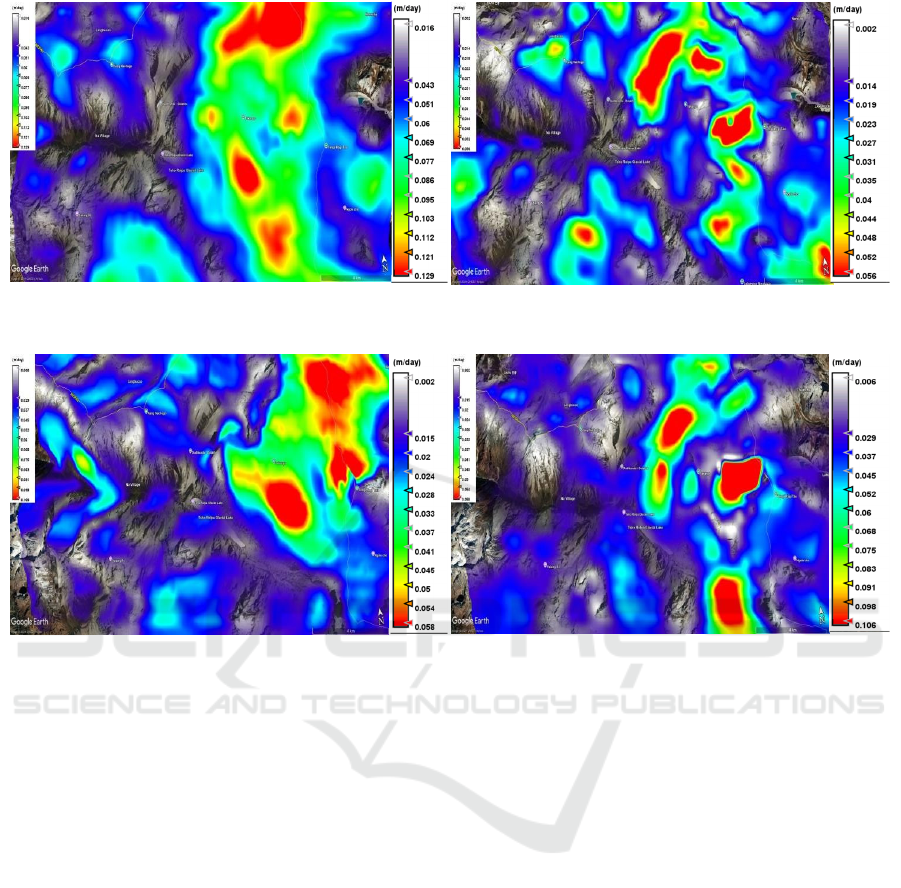
Figure 5(a): Ice velocity of 2020.
Figure 5(b): Ice velocity of 2021.
Figure 5(c): Ice velocity of 2022.
Figure 5(d): Ice velocity if 2023.
condition in the area which can badly affect the
country’s economic as well as long-term effect can be
seen.
6 CONCLUSION AND FUTURE
WORKS
GLOFs are natural disasters that will happen
eventually. The only viable method of risk reduction
are the early warning systems. The study of glacier
ice velocity provides us an insight about the dynamics
of glaciers, sea-level rise and response to climate
change. With the help of ice velocity integrated with
hydrology, we can design an early warning system.
The hazard modeling provides crucial insights on the
nature of flood paths and high-risk zones, where the
early warning can effectively reduce the risk on life
and properties. The rapid expansion of glacial lake
and the resulting potential flood path emphasizes the
urgent need for intervention for the mitigation of
GLOFs.
One of the major challenges many countries
that has direct access to the ocean or sea are facing is
continuous sea-level rise and one of the major cause
for sea level rise is melting of glaciers, which add tons
and tons of water continuously in the ocean resulting
in rise of sea level. Future work should focus on
refining the accuracy of flood paths generated by
hazard models by incorporating real-time data.
Further works can be done analyzing different
parameters like ice thickness, surface displacement
using satellite data as well high precision GPS
stations and InSAR to get high accuracy results.
Similarly more sophisticated modes can be developed
that can simulate ice velocity in different weather and
climate variables taking in note about the surface as
well as internal glacier melting and deformation. The
current hazard model relies on the geospatial data and
the assumption of the lake stability which might not
full capture the dynamic nature of GLOF events so
direct field-based data collections and validation of
observations along with advanced hydrodynamic
modeling could address these gaps and provide a
more refined hazard model.
GISTAM 2025 - 11th International Conference on Geographical Information Systems Theory, Applications and Management
170

REFERENCES
Bolch, T. K. (2012). The state and fate of Himalayan
glaciers. Science, 336(6079), 310–314.
doi:https://doi.org/10.1126/science.1215828
ChatGPT. (2024). Explanation on spatial resolution of
Sentinel-2 and Sentinel-1.
Copernicus Climate Change Service. (n.d.). Home Page (or
Copernicus Climate Change Service Website).
Retrieved from European Centre for Medium-Range
Weather Forecasts: https://climate.copernicus.eu/
Damen, M. C. (1992). Study on the potential outburst
flooding of Tsho Rolpa glacier lake, Rolwaling valley,
East Nepal. International Institute for Geo-Information
Science and Earth Observation.
Du, Q. L. (2021). Deformation Monitoring in an Alpine
Mining Area in the Tianshan Mountains Based on
SBAS-InSAR Technology. Advances in Materials
Science and Engineering, 2021(1), 9988017.
doi:https://doi.org/10.1155/2021/9988017
Gu, F. Z. (2024). The velocity extraction and feature
analysis of glacier surface motion in the Gongar region
based on multi-source remote sensing data. Frontiers in
Earth Science, 12(Article 1413531).
doi:https://doi.org/10.3389/feart.2024.1413531
Hyde, A. (2024, January 15). Measuring glacier velocity.
Retrieved from Antarctic Glaciers:
https://www.antarcticglaciers.org/glaciers-and-
climate/observing-and-monitoring-glaciers-and-ice-
sheets/measuring-glacier-velocity
Maskey, R. K. (2013). Water and energy security in the
mountainous region of Nepal: Lessons from Dig-Tsho,
Tsho-Rolpa, and Imja glacial lakes.
Millan, R. M. (2023). Author correction: Ice velocity and
thickness of the world’s glaciers. Nature Geoscience,
16(1), 188.
Paul, F., Winsvold, S. H., Kääb, A., Nagler, T., &
Schwaizer, G. (2016). Glacier remote sensing using
Sentinel-2. Part II: Mapping glacier extents and surface
facies, and comparison to Landsat 8. Remote Sensing,
8(7), 575. doi:10.3390/rs8070575
Rankl, M. K. (2014). Glacier changes in the Karakoram
region mapped by multimission satellite imagery. The
Cryosphere, 8, 977–989. doi:https://doi.org/10.5194/tc-
8-977-2014
Rounce, D., Watson, C., & McKinney, D. C. (2017).
Identification of hazard and risk for glacial lakes in the
Nepal Himalaya using satellite imagery from 2000–
2015. Remote Sensing, 9(7), 654.
doi:https://doi.org/10.3390/rs9070654
Yulianto, S. A. (2021, September). Spatial Distribution of
Paddy Growth Stage Using Sentinel-1 based on CART
Model. 2021 IEEE Asia-Pacific Conference on
Geoscience, Electronics and Remote Sensing
Technology (AGERS). Institute of Electrical and
Electronics Engineers.
doi:https://doi.org/10.1109/AGERS53903.2021.96173
17
Google, E. (2021). Google Earth Pro [Map].
Hazard Modeling Using Sentinel Data for Risk Assessment and Management of Tsho Rolpa Glacier, Nepal
171
